
Salako Ahmed
Research & M&E Analyst | Data Analysis | Excel & Power BI



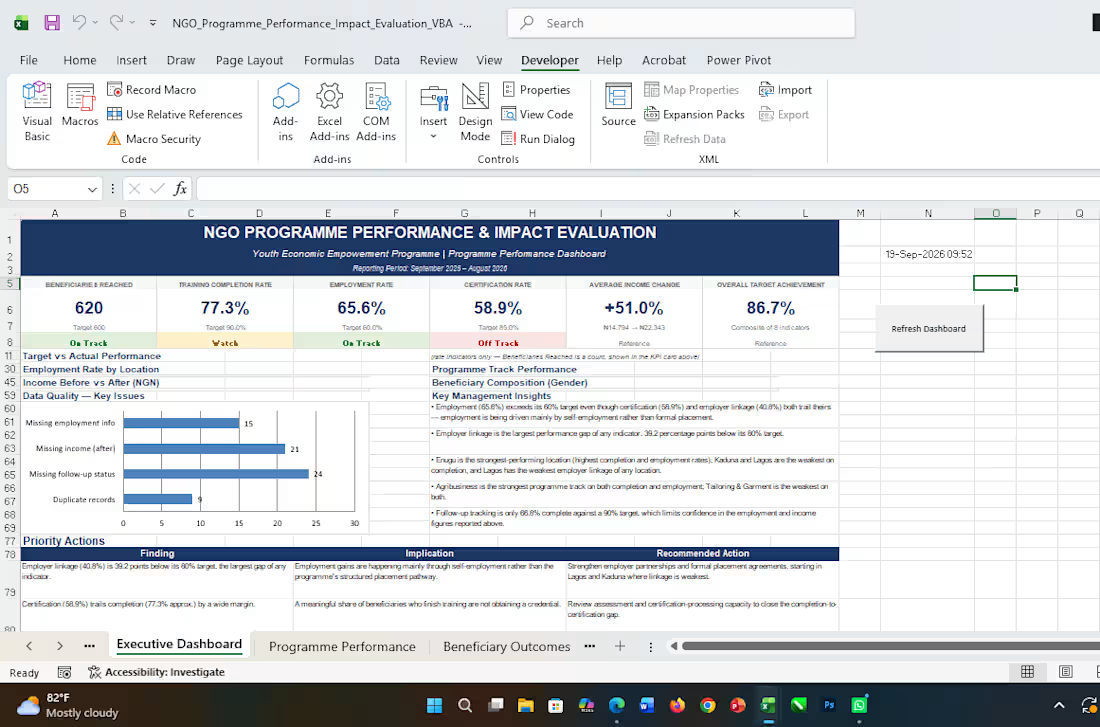
Developed an Excel-based Monitoring & Evaluation dashboard for a simulated NGO youth economic empowerment programme. The project covered data quality assessment, M&E indicator and KPI tracking, target-versus-actual performance analysis, beneficiary outcomes, employment and income analysis, and executive reporting.
I also implemented VBA automation to streamline dashboard refreshes, validate KPIs, check duplicate IDs and missing data, refresh charts, update timestamps, and maintain an automation log. The project demonstrates how programme data can be transformed into practical insights for monitoring performance and supporting evidence-based decision-making.
0
21
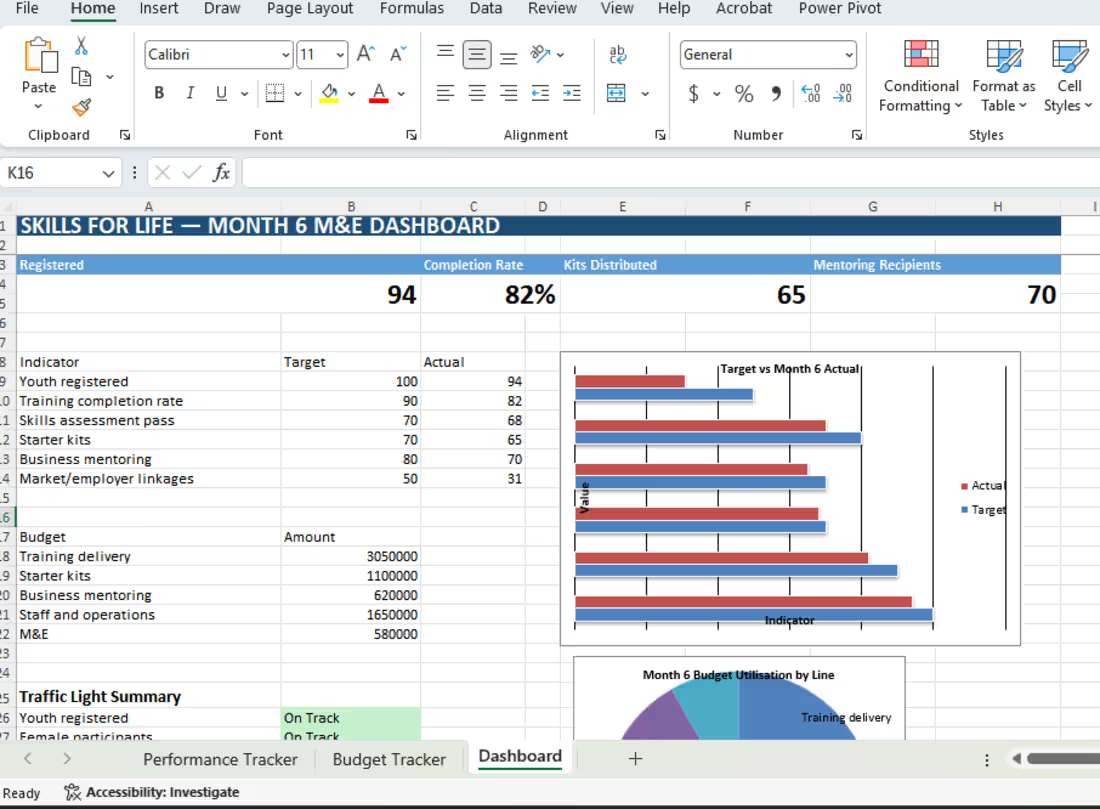
Skills for Life — Month 6 Mid-Term Monitoring Report
Developed a comprehensive mid-term monitoring and reporting
package for a simulated 12-month youth economic empowerment programme,
assessing implementation progress against programme targets and translating
monitoring data into actionable management insights.
Key deliverables:
• Performance Monitoring: Tracked nine programme indicators
across participant registration, training delivery, completion, skills
assessment and post-training support, including achievement analysis and
performance status.
• Budget Monitoring: Analysed an ₦8 million programme
budget, tracking expenditure, variance and utilisation across five budget
lines.
• M&E Dashboard: Developed an Excel dashboard presenting
key performance indicators, Target vs Actual analysis, budget utilisation and
traffic-light performance status.
• Mid-Term Reporting: Produced a structured donor-style
monitoring report covering programme performance, financial utilisation,
accountability and community feedback, implementation challenges, corrective
actions and recommendations.
Key finding: Market and employer linkages stood at 31
against a target of 50, representing 62% achievement and the most significant
performance gap at mid-term. The analysis informed targeted recommendations to
strengthen employer partnerships and expand market linkage opportunities during
Months 7–12.
Tools: Microsoft Excel | Microsoft Word
1
171
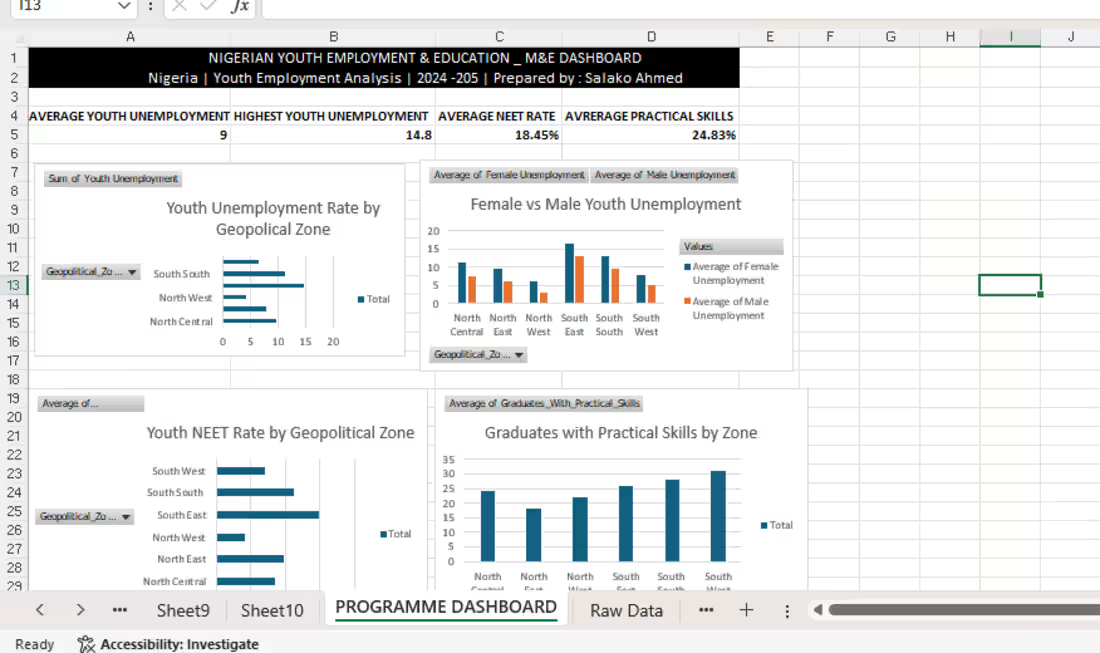
Building my professional presence on Contra while continuing to develop my work in Research, Monitoring & Evaluation, and Data Analysis.
My focus is on delivering practical, evidence-based research, data analysis, dashboards, and professional reporting.
One step at a time. 📊
3
325
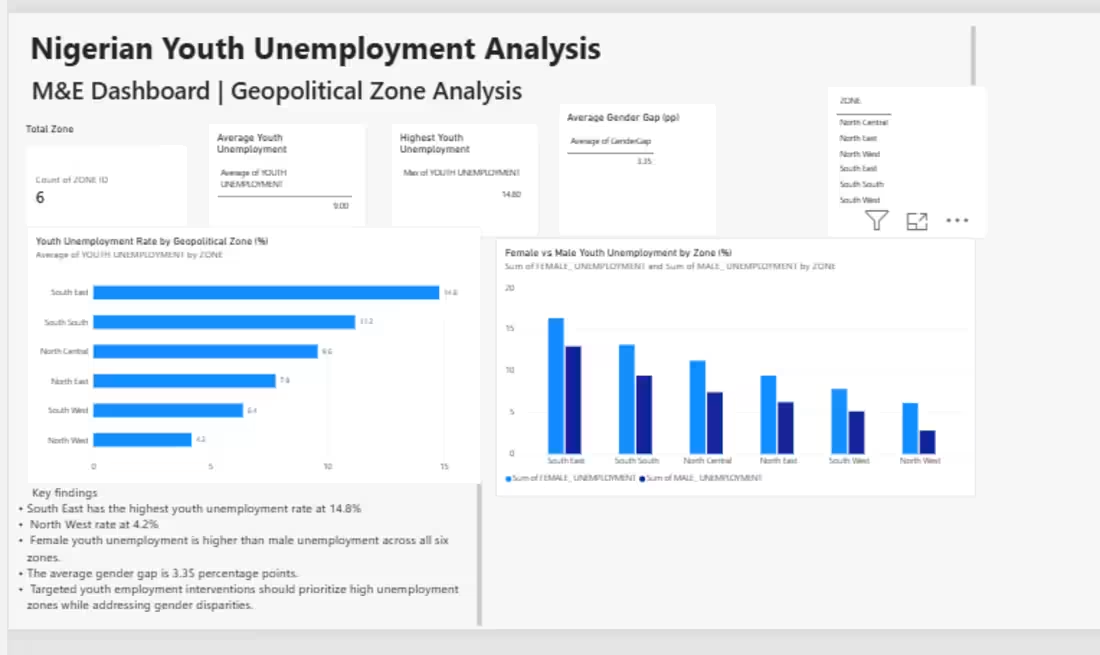
Nigerian Youth Unemployment — Power BI Dashboard
I built this Power BI dashboard to analyse youth unemployment across Nigeria’s six geopolitical zones using data from the National Bureau of Statistics (NBS).
The aim was to take the data beyond a spreadsheet and make it easier to see where unemployment and related challenges are more pronounced.
What I worked on
Created KPI cards for the main unemployment indicators
Compared unemployment rates across the six geopolitical zones
Analysed the difference between female and male unemployment
Looked at NEET rates (young people not in education, employment or training)
Added a zone slicer so users can explore the data by region
Created DAX measures for gender gap and above-average unemployment
Added key findings and programme recommendations based on the results
One of the main findings was that the South East had the highest youth unemployment rate at 14.8%, with a NEET rate of 29.6%.
Tools: Power BI, DAX, Microsoft Excel
Data: National Bureau of Statistics Nigeria — Labour Force Survey
This project helped me practise turning raw data into a dashboard that can be used to understand patterns and support programme and policy decisions.:
3
270