Freelancers using MySQL in Pimpri-Chinchwad
Sign Up
Post a job
Sign Up
Log In
Filters
2
Projects
People
Sunny Mehta
Pune, India
Data Analyst & BI Dev | Dashboards, SQL, Python & ETL
New to Contra
Follow
Message
Data Analyst & BI Dev | Dashboards, SQL, Python & ETL
1
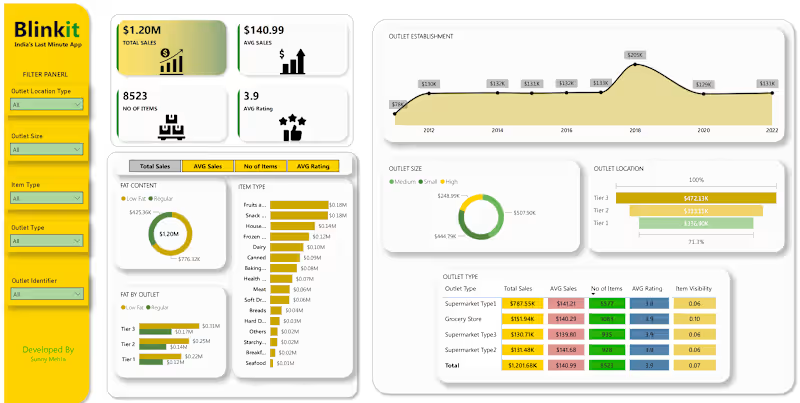
Blinkit-Sales-Dashboard This project is an interactive Power BI dashboard developed to analyse Blinkit's sales performance, outlet operations, product distribution, and customer-related metrics. The dashboard converts raw retail sales data into meaningful business insights through visualisation and KPI tracking. The objective of this project is to monitor business performance, identify sales trends, evaluate outlet efficiency, and support data-driven decision-making. Key KPIs Total Sales: $1.20M Average Sales: $140.99 Number of Items: 8,523 Average Rating: 3.9 Dashboard Features Sales Analysis Tracked total revenue and average sales performance to understand overall business growth. Outlet Performance Analysed outlet sales based on the following: Outlet Size Outlet Location Type Outlet Establishment Year Outlet Type Product Category Analysis Identified top-performing product categories contributing the highest revenue. Customer & Product Insights Compared low-fat and regular products to understand purchasing trends and monitored customer ratings for performance evaluation. Interactive Filters Added slicers for: Outlet Location Type Outlet Size Item Type Outlet Type Outlet Identifier These filters allow users to dynamically explore data and generate business insights. Project Outcome This project demonstrates practical skills in business intelligence, KPI reporting, analytical thinking, and dashboard development using Power BI. It highlights the ability to transform raw business data into business insights for decision-making. Developed By Sunny Mehta
1
60
0
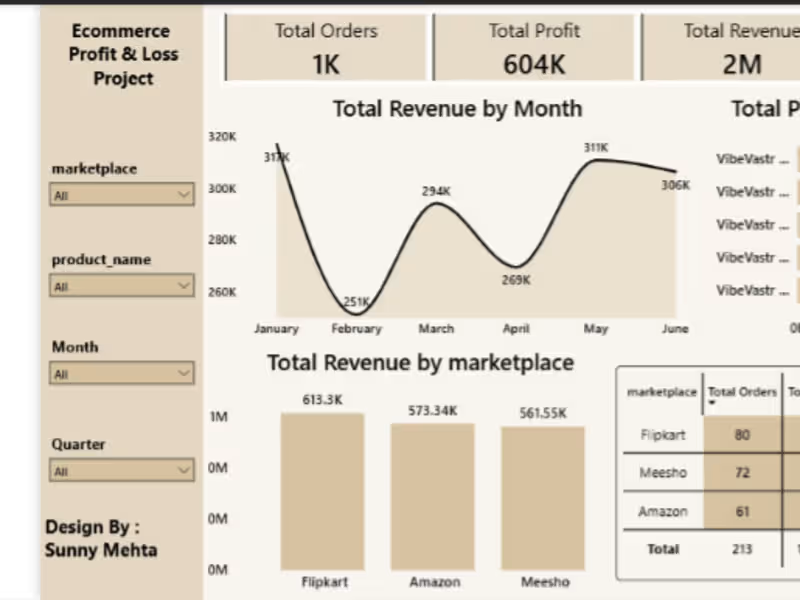
Marketplace Profitability & P&L Engine Overview This project is an end-to-end E-commerce Marketplace Analytics solution built using MySQL, SQL, Power BI, and Excel. The objective of this project is to analyze marketplace profitability across multiple sales channels by calculating revenue, product costs, marketplace commissions, shipping expenses, and net profit. The project simulates a real-world marketplace operations environment where business teams need visibility into product performance, marketplace profitability, and operational KPIs. Business Problem E-commerce businesses often track revenue but fail to understand true profitability. This project helps answer key business questions: Which marketplace generates the highest profit? Which products are most profitable? How do commissions impact margins? What is the overall profit margin? How does shipping cost affect profitability? Tech Stack MySQL SQL Power BI Microsoft Excel Data Sources Products Contains SKU-level product information. Fields: SKU Product Name Category Cost Price Selling Price Orders Contains marketplace order transactions. Fields: Order ID Order Date Marketplace SKU Quantity Marketplace Charges Marketplace commission structure. Fields: Marketplace Commission Percentage Shipping Cost Shipping cost by marketplace. Fields: Marketplace Shipping Cost Returns Order return information. Fields: Order ID Return Status SQL Implementation The project uses multiple SQL tables and joins to create a unified profitability dataset. Key SQL Concepts Used: CREATE TABLE INNER JOIN SQL Views Aggregations Calculated Metrics A consolidated analytical view was created: vw_marketplace_pnl This view combines all business logic and serves as the primary source for Power BI reporting. Profitability Metrics Revenue Revenue = Quantity × Selling Price Product Cost Product Cost = Quantity × Cost Price Commission Cost Commission Cost = Revenue × Marketplace Commission % Shipping Cost Shipping Cost = Quantity × Shipping Cost Profit Profit = Revenue − Product Cost − Commission Cost − Shipping Cost Profit Margin % Profit Margin % = Profit / Revenue Power BI Dashboard Executive Summary KPIs: Total Revenue Total Profit Total Orders Profit Margin % Marketplace Analysis Revenue by Marketplace Profit by Marketplace Marketplace Performance Comparison Product Analysis Top Profitable Products Product Revenue Analysis Product Profitability Ranking Trend Analysis Revenue Trend Profit Trend Order Trend Project Architecture Excel → MySQL → SQL View → Power BI Dashboard Key Outcomes Built a scalable marketplace profitability model. Centralized business logic using SQL Views. Automated profitability calculations. Delivered interactive executive dashboards for decision-making. Simulated a real-world marketplace operations analytics workflow. Skills Demonstrated SQL Data Modeling Business Intelligence Power BI E-commerce Analytics Marketplace Operations Profitability Analysis Data Visualization Author Sunny Mehta Open to opportunities in: E-commerce Operations Marketplace Management Business Analytics Operations Analytics Data Analytics
0
16
3
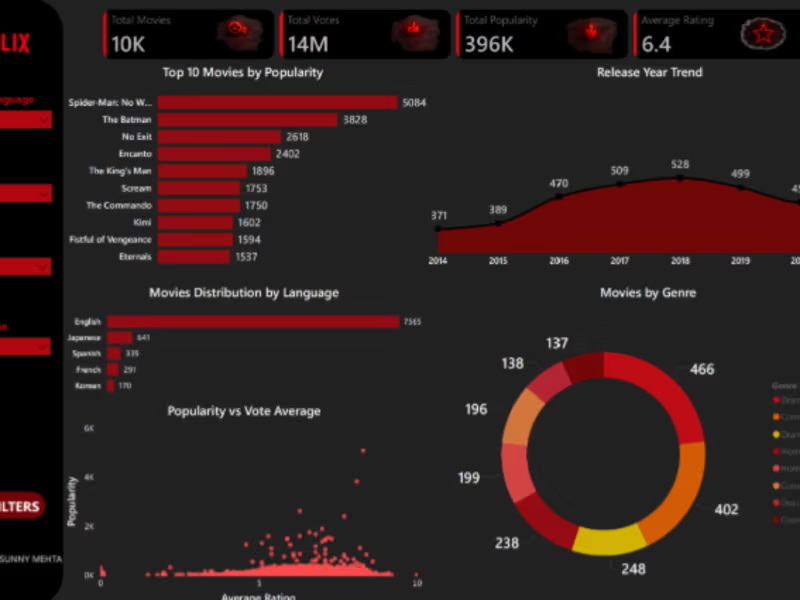
Netflix Movies Analysis Dashboard using Power BI Project Overview Interactive Power BI dashboard analyzing Netflix movie trends, popularity, ratings, genres, and language distribution. KPIs Total Movies Total Votes Total Popularity Average Rating Dashboard Features Top 10 Movies by Popularity Release Year Trend Movies Distribution by Language Genre Analysis Popularity vs Vote Average Tools Used Power BI Power Query DAX Data Modeling
3
81
1
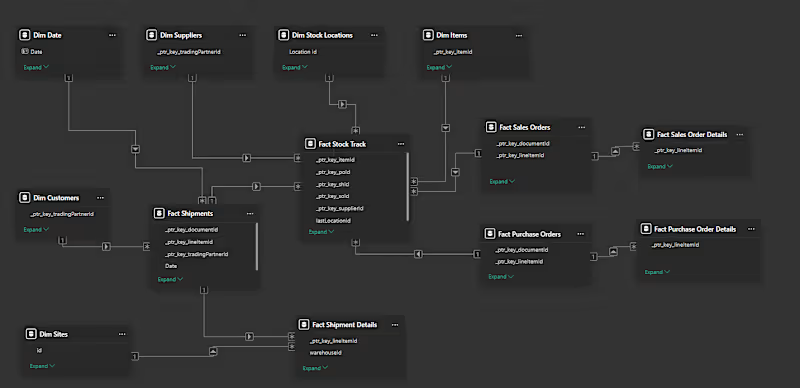
Banking Data Analysis Dashboard Develop a basic understanding of risk analytics in banking and financial services and understand how data is used to minimise the risk of losing money while lending to customers Solution – With our dashboards which are created using Power BI latest tools helps the company to make a decision based on the applicant’s profile like if the applicant is likely to repay the loan then approving the loan otherwise not. About Dataset – This dataset basically contains information about bank details ,various client details which consists of multiple tables which are interlinked with each other through keys like primary key and foreign key. The various tables are Banking Relationship, Client-Banking, Gender, Investment Advisor and Period. KPI’S: In which followings KPIS are present : Total Clients : Total Clients KPI represents total number of clients in banking. Total Clients = DISTINCTCOUNT('Clients - Banking'[Client ID] ) Total Loan : Total Loan gives you information about the bank loan + Business lending + credit cards balance of particular investor , gender. Total Loan = [Bank Loan] + [Business Lending] + [Credit Cards Balance] Bank Loan : Bank Loan gives you information what is the loan amount of loan to be repaid by the client to bank. Bank Loan = SUM('Clients - Banking'[Bank Loans] ) Business Lending : Business lending gives you information about the loan amount given to small business. Business Lending = SUM('Clients - Banking'[Business Lending] ) Total Deposit Total Deposit gives you information about the amount deposited by particular investors in bank Total Deposit = [Bank Deposit] + [Savings Account] + [Foreign Currency Account] + [Checking Accounts] Total Fees : Total Fees is nothing but the amount charged by the bank for account set-up , maintenance charges etc. Total Fees = SUMX('Clients - Banking' , [Total Loan] * 'Clients - Banking'[Processing Fees] ) Bank Deposit : Bank deposit is the money put in the bank. Bank Deposit = SUM('Clients - Banking'[Bank Deposits] ) Checking Account Amount : Checking account amount is nothing but which offers easy access to your money for daily transactional needs. Checking Accounts = SUM('Clients - Banking'[Checking Accounts] ) Total CC Amount : Total CC Amount is a short-term source of financing for a company by a bank. Total CC Amount = SUM('Clients - Banking'[Amount of Credit Cards] ) Saving Account Amount : A savings account is an interest-bearing deposit account held at a bank. Savings Account = SUM('Clients - Banking'[Saving Accounts] ) Foreign Currency Amount : Foreign Currency Account means an account held in a currency that is not the currency of India or Bhutan or Nepal. Foreign Currency Account = SUM('Clients - Banking'[Foreign Currency Account] ) Engagement Account : Engagement Banking is nothing but puts the customer at the center and aims to deliver the digital experiences they expect. Engagment Length = SUM('Clients - Banking'[Engagment Days]) Credit Cards Balance : It is the total amount of money currently owned by a cardholder to their credit card bank. Credit Cards Balance = SUM('Clients - Banking'[Credit Card Balance] ) 📊 Tools Used Excel (Data Cleaning) SQL (Data Processing) Python (EDA) Power BI (Dashboard) 📈 Key Insights Private banks dominate loan distribution European segment shows highest deposits Low-income customers have high loan dependency
1
49
MySQL
(1)
Follow
Message
Smita S
Pune, India
Senior Data Analyst | Business Intelligence Consultant
10
Followers
Follow
Message
Senior Data Analyst | Business Intelligence Consultant
0
Power BI Templates for Self-Service Reporting
0
24
0
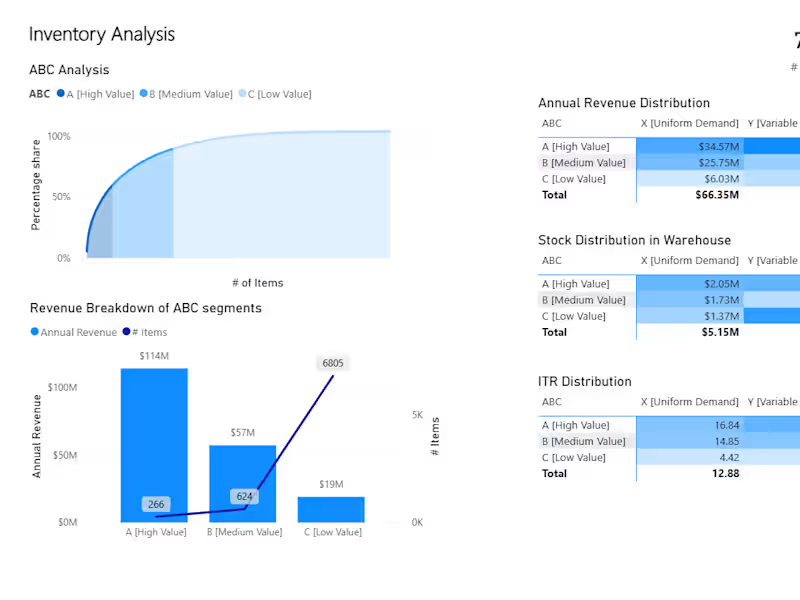
Inventory Optimization with ABC-XYZ Segmentation
0
33
0
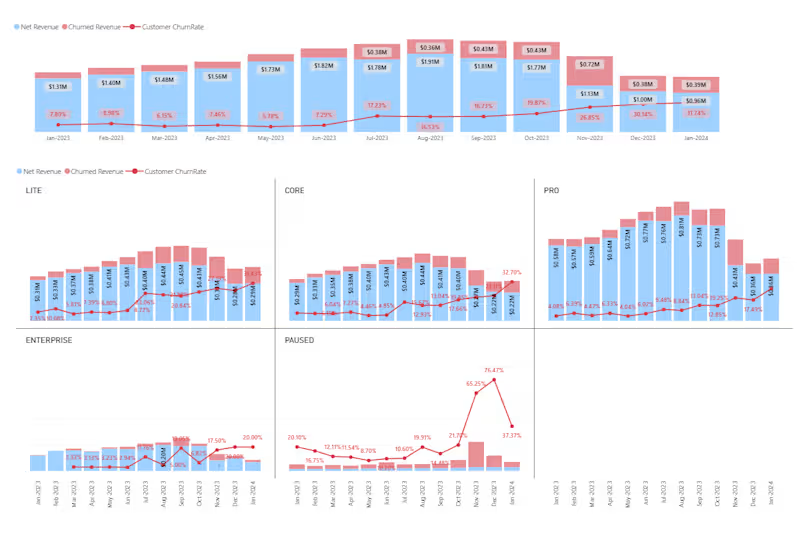
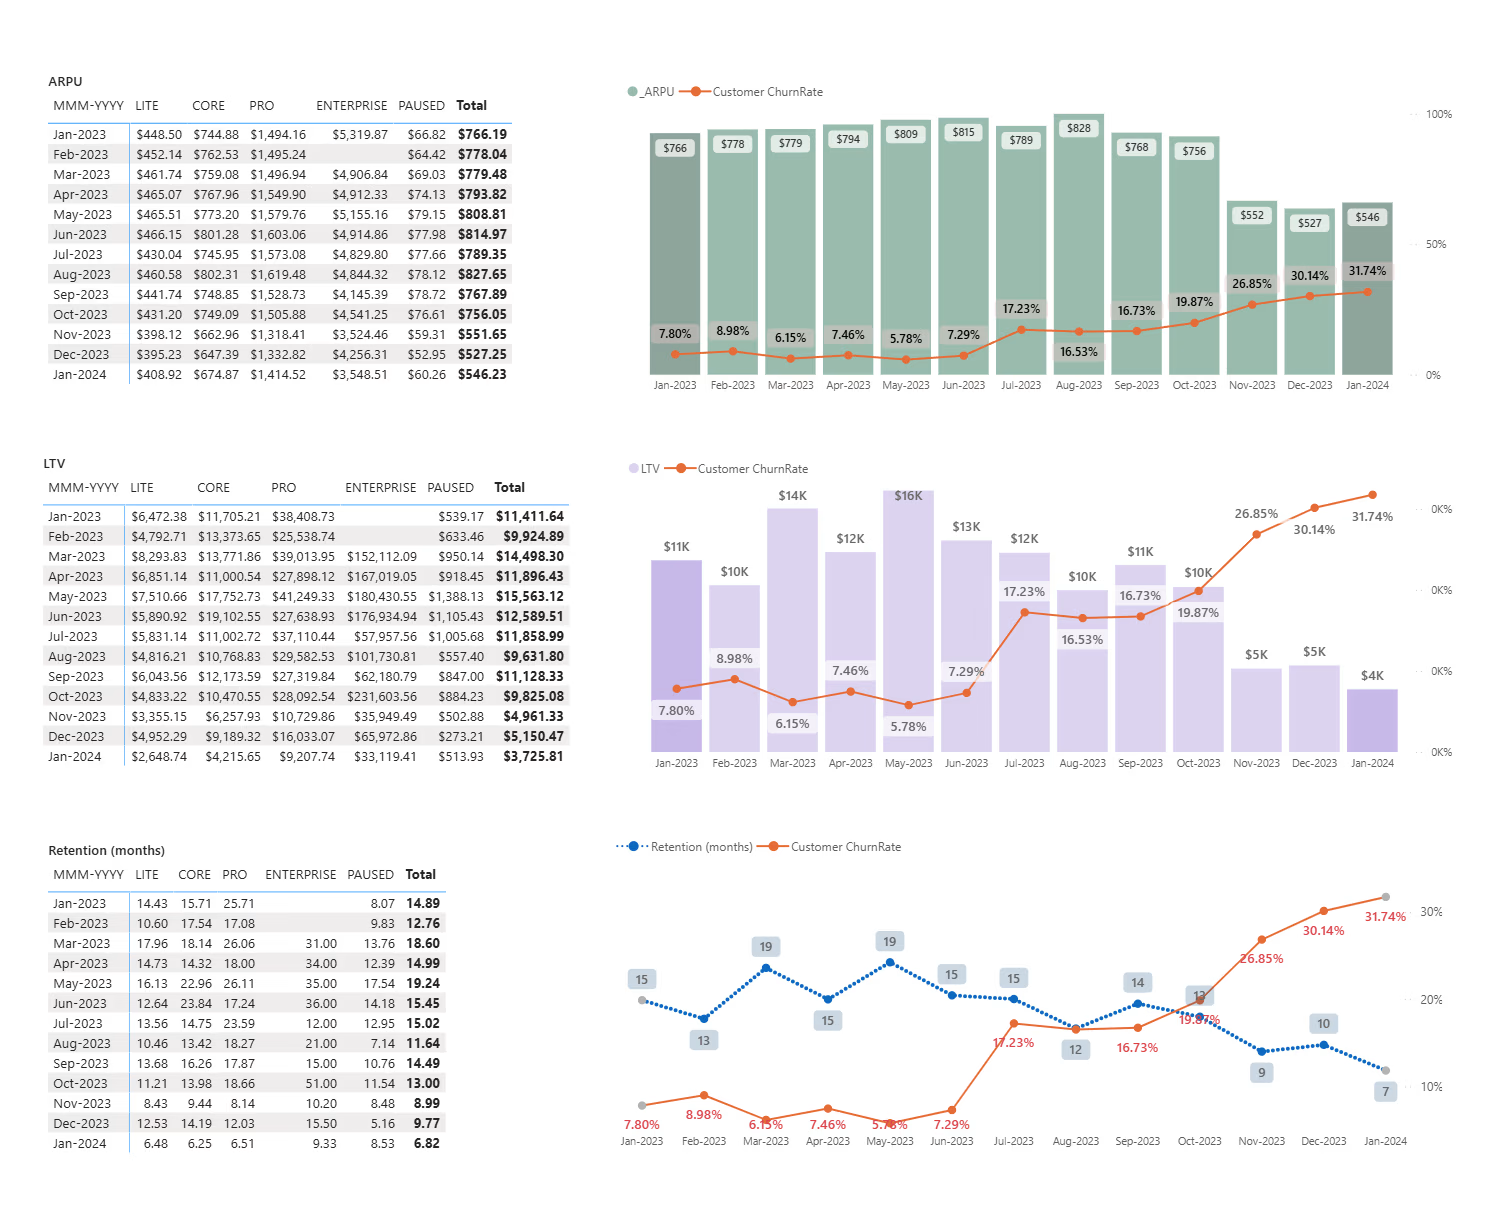
MRR & Churn Analysis Dashboard for SaaS Retention and Growth
0
40
View more →
MySQL
(2)
Follow
Message
Ariston IT Services
Pune, India
Ariston IT: Elevate Your Business with Custom Software

Follow
Message
Ariston IT: Elevate Your Business with Custom Software

0
Business Listing / Advertising Platform
0
16
0
Sports Event Booking App
0
14
0
Tour & Guide Booking and Management
0
21
View more →
MySQL
(1)
Follow
Message
Sarbjot Singh
Pimpri-Chinchwad, India
Power BI Expert | Turning Raw Data into Actionable Insights
Follow
Message
Power BI Expert | Turning Raw Data into Actionable Insights
1
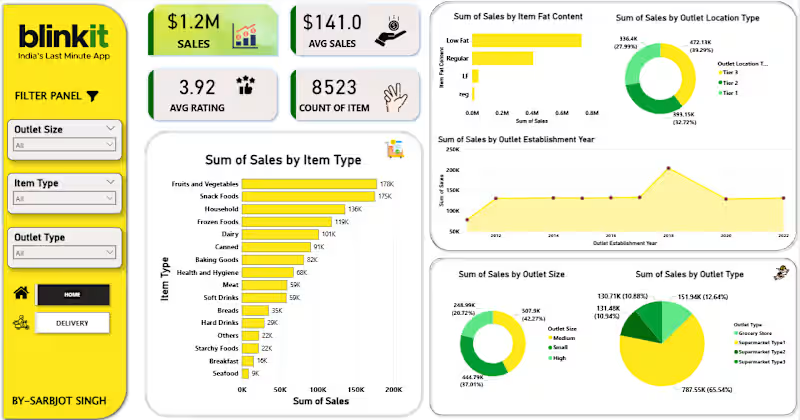
Data Analytics Project | BlinkIT Grocery Sales Analysis Excited to share my latest Data Analytics project ,where I analyzed BlinkIT Grocery Sales Data and delivery data to uncover meaningful business insights 📈 📊 What I worked on: Analyzed sales performance across product categories, outlet types, sizes, and locations Identified top-performing item categories and customer preferences Studied the impact of outlet size, establishment year, and visibility on sales Converted raw data into actionable insights and business recommendations 💡 Key Insights: Fruits & Vegetables, Snack Foods, and Frozen Foods drive maximum sales Medium-sized outlets outperform others in overall revenue FOR FULL PROJECT VIST GIT HUB –( https://lnkd.in/d34sdAPz ) Feedback and suggestions are always welcome!
1
1
90
1
Data Analytics Project | BlinkIT Grocery Sales Analysis Excited to share my latest Data Analytics project ,where I analyzed BlinkIT Grocery Sales Data and delivery data to uncover meaningful business insights 📈 📊 What I worked on: Analyzed sales performance across product categories, outlet types, sizes, and locations Identified top-performing item categories and customer preferences Studied the impact of outlet size, establishment year, and visibility on sales Converted raw data into actionable insights and business recommendations 💡 Key Insights: Fruits & Vegetables, Snack Foods, and Frozen Foods drive maximum sales FOR FULL PROJECT VIST GIT HUB –( https://lnkd.in/d34sdAPz )
1
63
2
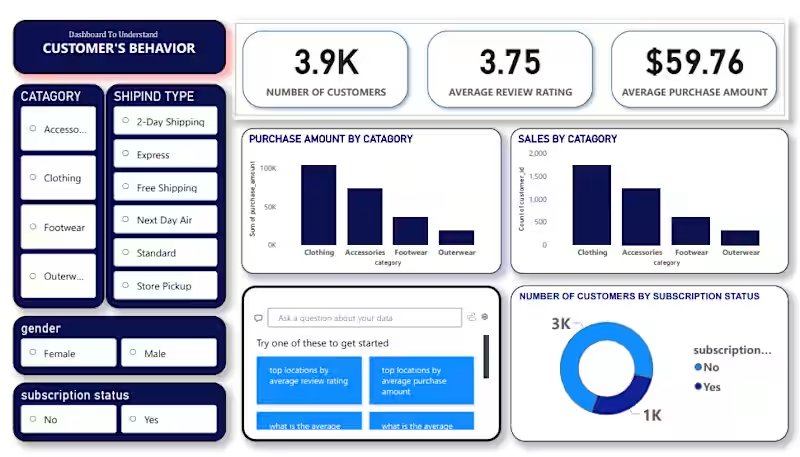
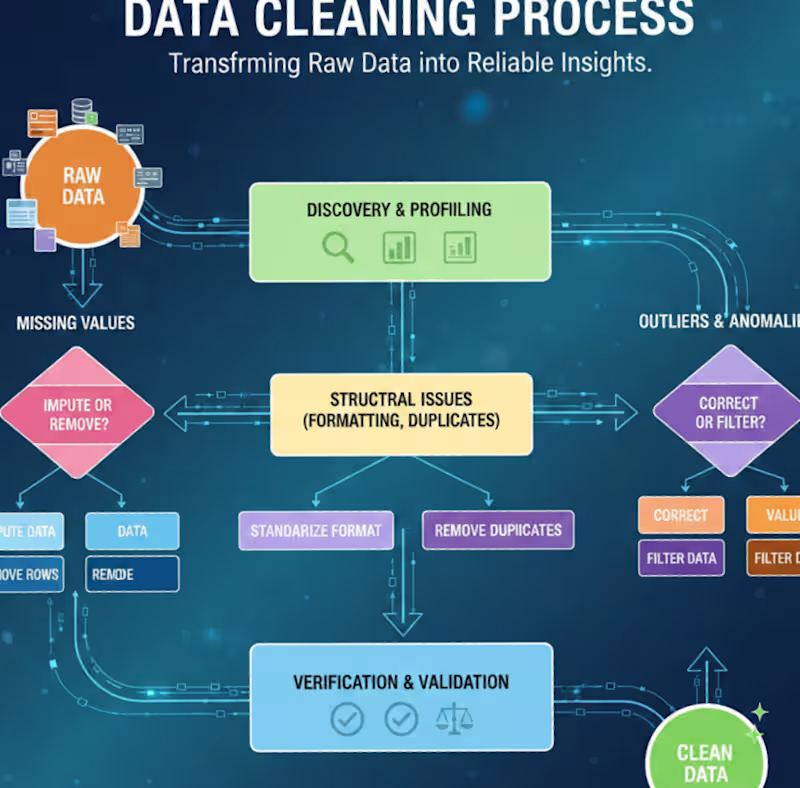
I’m excited to share my latest Data Analytics project where I analyzed Customer Shopping Behavior to uncover trends in sales, demographics, and purchasing habits.This project was a great exercise in building a complete data pipeline. The Tech Stack: Python (Pandas & NumPy): Used in Jupyter Notebooks for initial data exploration and statistical analysis. PostgreSQL: Utilized for rigorous data cleaning, querying, and structuring the dataset for analysis. Power BI: Built an interactive dashboard to visualize key metrics like seasonal trends, subscription impacts, and category performance. Project Highlights: ✅ Data Cleaning: Leveraged PostgreSQL and Pandas to handle missing values and standardize categorical data.
1
2
94
0
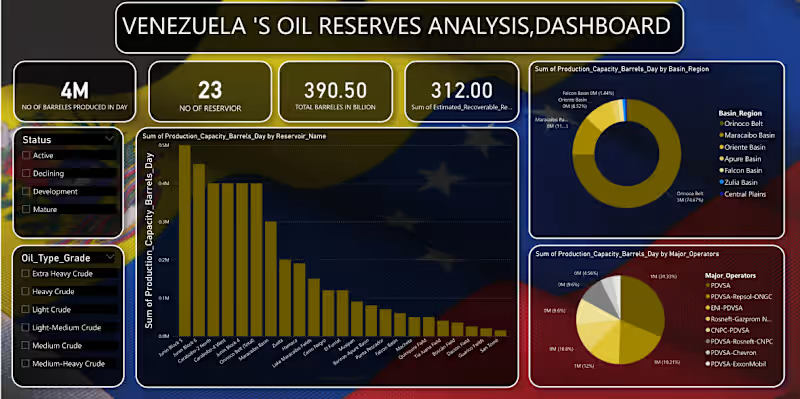
Venezuela’s Oil Reserves Analysis Dashboard 📊 I am excited to share my latest data analytics project focusing on the energy sector. Using a dataset covering 23 reservoirs, I designed a comprehensive dashboard to track production capacity and resource distribution in Venezuela. Key Features: ✅ Real-time Metrics: Tracking the 390.50 Billion total barrels in reserve. ✅ Granular Analysis: Production capacity breakdown by reservoir name and oil grade (Extra Heavy to Light). ✅ Stakeholder Mapping: Visualizing the production sum by major operators. Tools Used: [pandas(jupyter notebook)/mysql(for analysis and cleaning of data), Power BI / Excel(for building dashboard)] I’d love to hear your thoughts or feedback on the dashboard design! must visit my github for full project -( https://lnkd.in/dYKdZ8J2 )
0
70
MySQL
(1)
Follow
Message
Swapnil Bansode
pro
Pune, India
Full Stack Software Developer | Laravel Expert | CRM, MLM
New to Contra
Follow
Message
Full Stack Software Developer | Laravel Expert | CRM, MLM
0
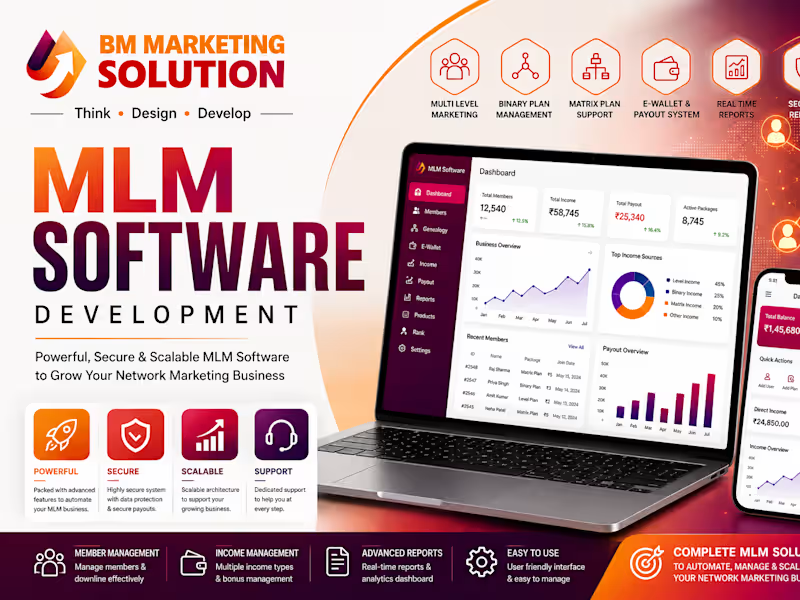
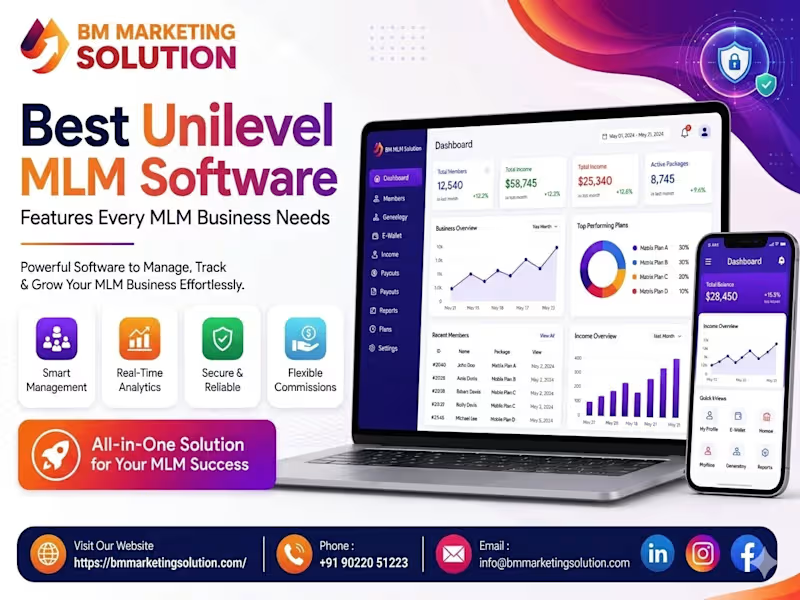
Get complete control over your network marketing business with a centralized, automated administration hub. Based on the robust architecture of MLM Engine, I deliver secure, highly customizable, and "India-Ready" MLM platforms designed to manage your entire downline layout and process accurate commission calculations without glitching. What you will get: • Fully custom compensation plans (Binary with leg balancing calculators, Forced Matrix N×N plans, Single Leg, and Generation structures) • Centralized Admin & Distributor Command Centers (Real-time tracking of registration, sales volume, and conversion rates) • Secure automated E-Wallet & E-Pin transaction frameworks for payouts and digital token management • Regional Indian integrations (GST-compliant digital invoicing, UPI payment gateways, and automated WhatsApp notifications) MLM Software, Network Marketing, Binary Plan, Matrix Plan, Generation Plan, FinTech, E-Wallet System, E-Commerce Integration, Software Development
0
92
0
Best Matrix MLM Software Features Every MLM Business Needs
0
113
0
1. Pages to be Redesigned We would like a complete website redesign covering all major pages, including: Home Page Shop / Products Page Product Details Page About Us Page Cart Page Checkout Page Contact Us Page A full multi-page redesign is preferred to create a strong retail-focused online shopping experience. 2. Design Style & Feel The website should reflect a premium coffee brand with: Warm and earthy color tones Artisan coffee shop atmosphere Modern and bold visual design Clean, professional layouts High-quality product presentation Mobile-friendly and responsive design The designer can suggest creative ideas while maintaining a premium coffee brand identity. 3. Functionality Requirements The website should include working eCommerce functionality, such as: Product listing and filtering Product detail pages Add-to-Cart functionality Shopping Cart page Cart drawer / mini cart Checkout flow (demo or functional) User-friendly navigation Mobile-responsive experience 4. Product Data For the design and development phase, product information can initially be hardcoded in the frontend. Dynamic backend integration can be added later if required. 5. Content & Brand Direction The redesign should take inspiration from the existing Gold Coffee website while improving the overall user experience and visual appeal. Please retain: Brand identity and coffee-focused messaging Company story and heritage (where applicable) Core product categories You may also take creative liberty to enhance content, layouts, imagery, and user experience while maintaining the premium coffee brand voice.
0
58
0
Apna World – Global Immigrant Social Networking Platform Project Overview Apna World is a community-driven social networking platform designed to connect immigrants worldwide through meaningful interactions, cultural exchange, and local support networks. The platform enables users to build connections, share experiences, discover opportunities, and engage with communities that help them adapt and thrive in their new environments. Challenge Immigrants often face challenges when relocating to a new country, including finding reliable information, building professional and social networks, discovering local communities, and accessing support resources. Existing social platforms are often too broad and lack features specifically tailored to immigrant communities. Solution Developed a comprehensive social networking ecosystem that allows users to: Create and manage personal profiles Connect with fellow immigrants and local communities Share posts, experiences, and updates Discover events and community activities Participate in discussions and support groups Build professional and personal networks Access location-based community resources Engage through real-time interactions and notifications Key Features User Management Secure Registration & Login Profile Creation & Customization Privacy Controls User Verification Social Networking News Feed & Activity Stream Friend & Connection Requests Community Groups Follow & Engagement System Likes, Comments & Sharing Community Engagement Discussion Forums Cultural Communities Event Management Community Announcements Resource Sharing Communication Real-Time Messaging Notifications System In-App Communication User Interaction Tracking Content Management Post Creation & Publishing Image & Media Uploads Content Moderation Reporting & Management Tools Admin Dashboard User Management Community Moderation Content Monitoring Analytics & Reporting Platform Configuration Technology Stack Backend PHP Laravel REST API Development MySQL Database Frontend Laravel Livewire Responsive UI/UX Design Mobile-First Development Administration Filament Admin Panel Role-Based Access Control Infrastructure Cloud Hosting Security Implementation Performance Optimization My Contributions Full-Stack Application Development Database Architecture Design Social Networking Feature Development API Development & Integration Admin Panel Development User Authentication & Security Responsive Frontend Implementation Testing & Deployment Results Created a scalable community platform for global immigrants. Improved user engagement through social networking features. Enabled community-driven knowledge sharing and support. Delivered a secure and mobile-friendly user experience. Built a robust administration system for efficient platform management. Skills Demonstrated Social Network Development Laravel Development Livewire Development Filament Admin Panel MySQL Database Design REST API Development Authentication & Security Responsive Web Development Community Platform Architecture Full-Stack Development Project Type: Social Networking Platform | Community Portal | Immigrant Support Ecosystem | Web Application Development
0
73
MySQL
(2)
Follow
Message
Jash Joshi
Pune, India
Data-Driven Strategies for Success
Follow
Message
Data-Driven Strategies for Success
0
Enhancing Operational Efficiency through ETL Solutions
0
5
0
AI-Powered Financial Forecasting for Investment Firm
0
11
0
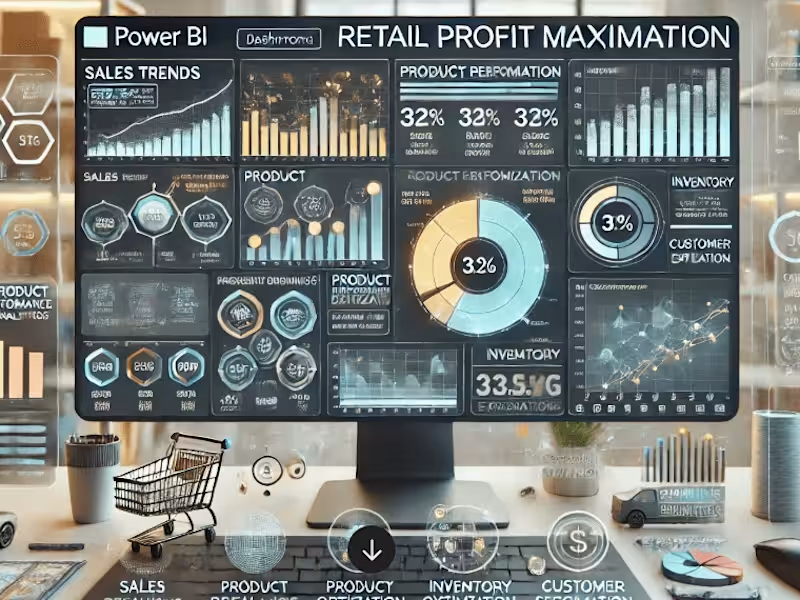
Maximizing Retail Profits with Power BI Dashboards
0
7
View more →
MySQL
(1)
Follow
Message
sakthiy prakash
Pune, India
Web Developer
Follow
Message
Web Developer
0
Rabbit Blood Hair Growth Oil Project
0
4
0
CRA Motors
0
3
0
Import and Export Solutions in India | Universe Freight
0
2
View more →
MySQL
(1)
Follow
Message
Manish Khedekar
Pune, India
Full Stack Developer
Follow
Message
Full Stack Developer
0
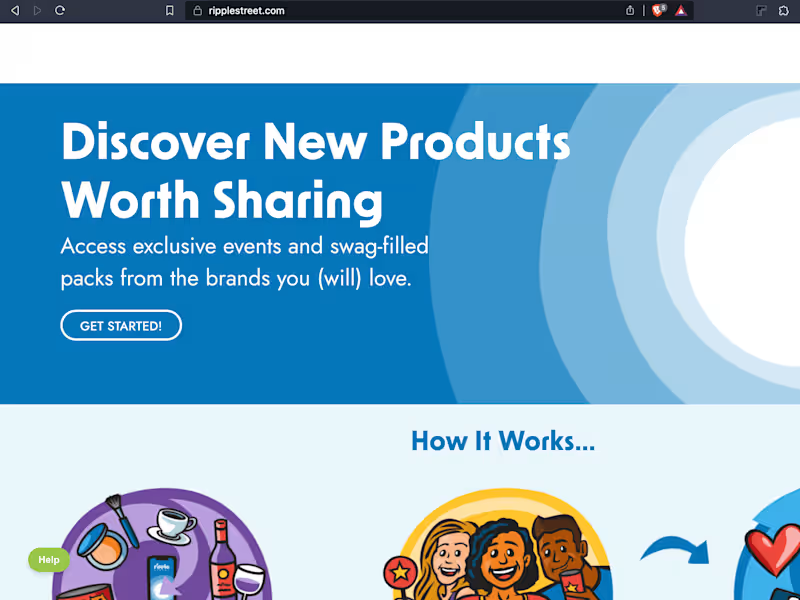
RippleStreet
0
8
0
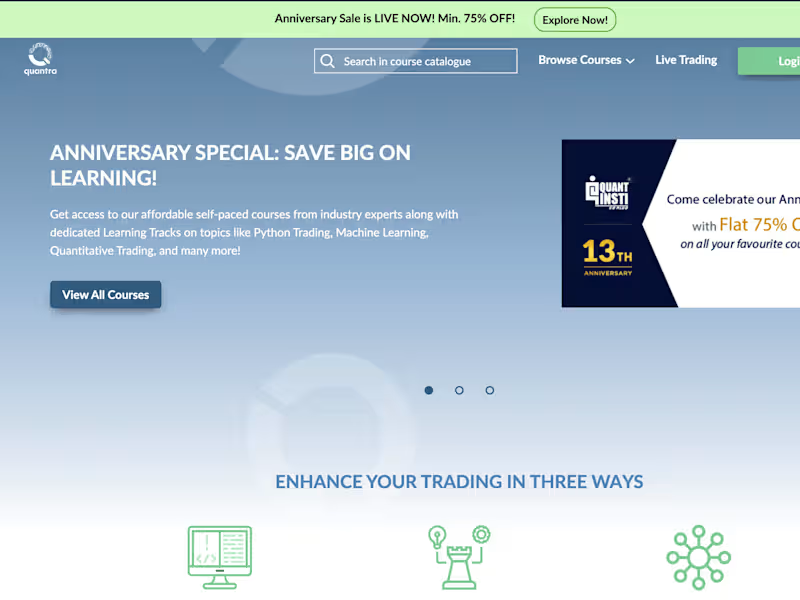
Quantra
0
31
0
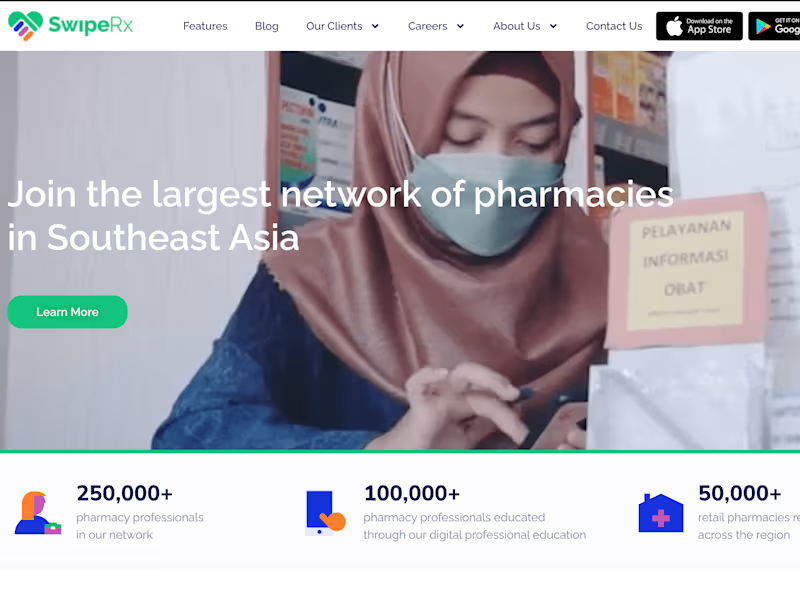
mClinica Connect
0
11
0
Partnerize
0
19
MySQL
(3)
Follow
Message
Explore people