
AI System Architect | Database Expert | Data Analyst
- $25k+
- Earned
- 1x
- Hired
- 5.0
- Rating
- 93
- Followers
AI System Architect | Database Expert | Data Analyst

Transforming Data into Actionable Insights 🔍
Transforming Data into Actionable Insights 🔍
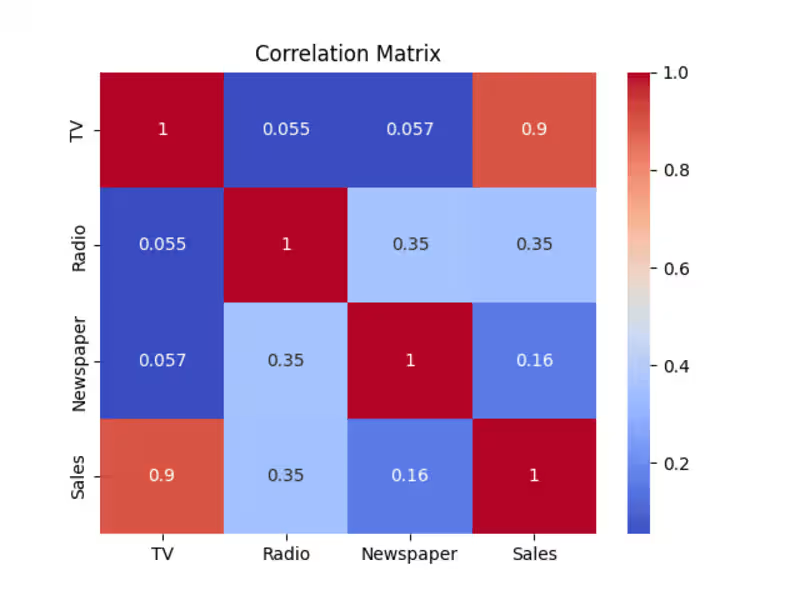
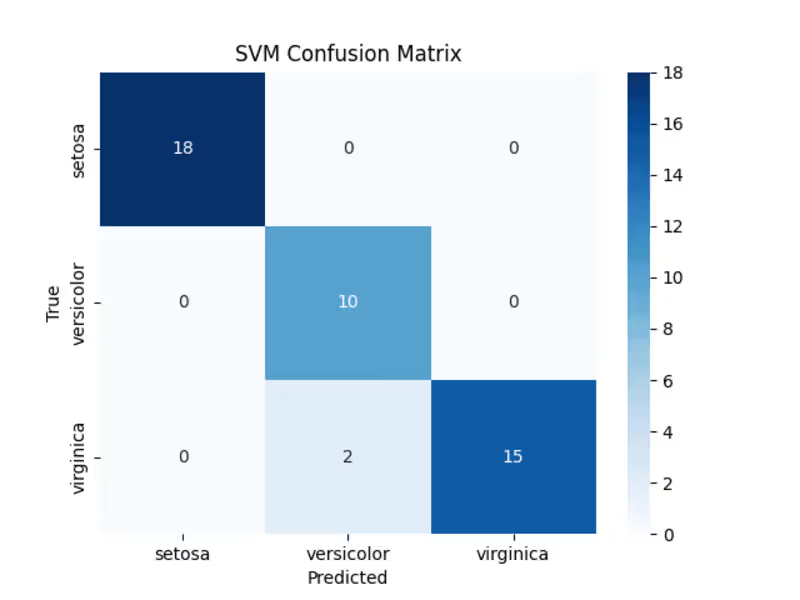
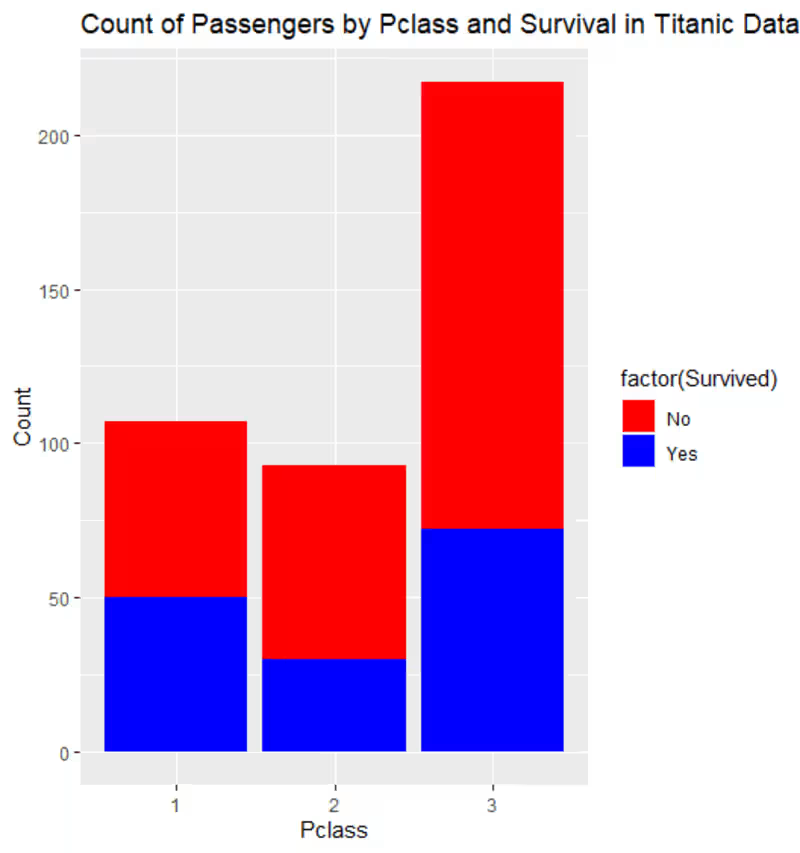
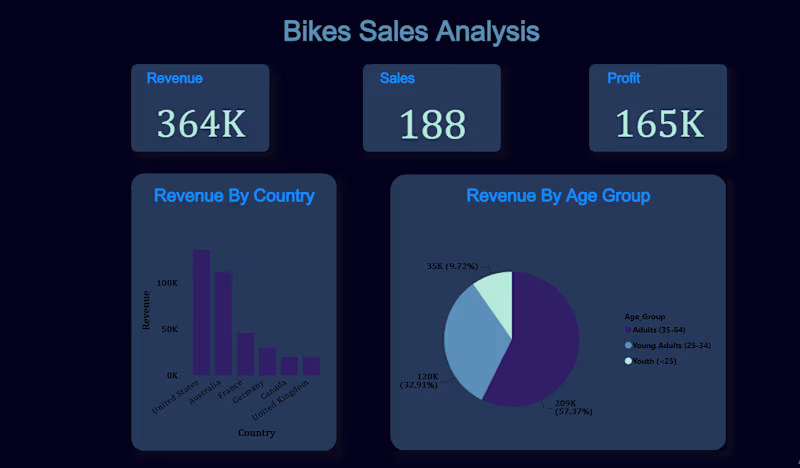

Dashboard & Data Analytics Expert
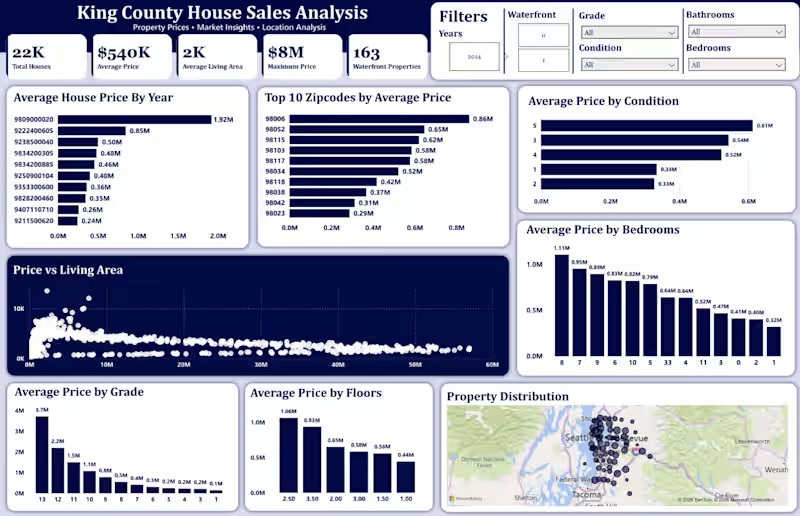
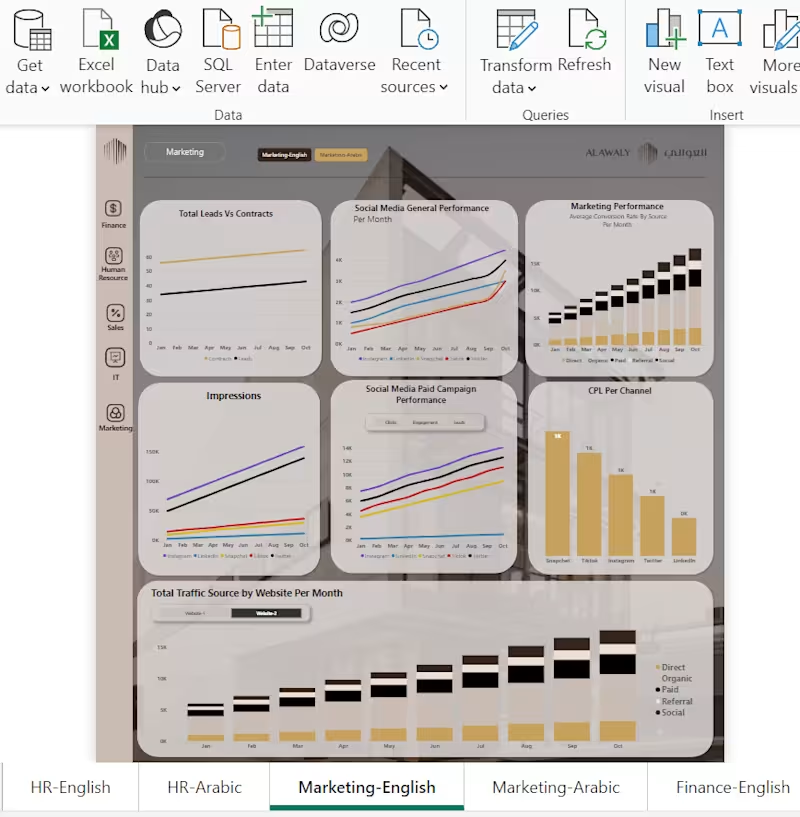
Finally wrapped up the Power BI dashboard for my House Sales Analysis project 🏠📊
After cleaning and exploring the data with Python and writing SQL queries, I used Power BI to turn the analysis into an interactive dashboard.
In the dashboard, I explored:
House price trends
Property size and pricing
House grades
Waterfront vs non-waterfront properties
Location-wise pricing
Bedrooms and other property features
I also worked with DAX measures, slicers, interactive visuals, and KPIs to make the dashboard more useful for exploring the data.
This project helped me practice the complete data analytics workflow:
Python → Data Cleaning & EDA → SQL → Power BI
Still learning and improving with every project. 🚀
#PowerBI #DataAnalyst #DataAnalytics #SQL #Python #EDA #DataCleaning #DAX #BusinessIntelligence #DataVisualization #PowerBIDashboard #PortfolioProject #DataAnalysis
0
68
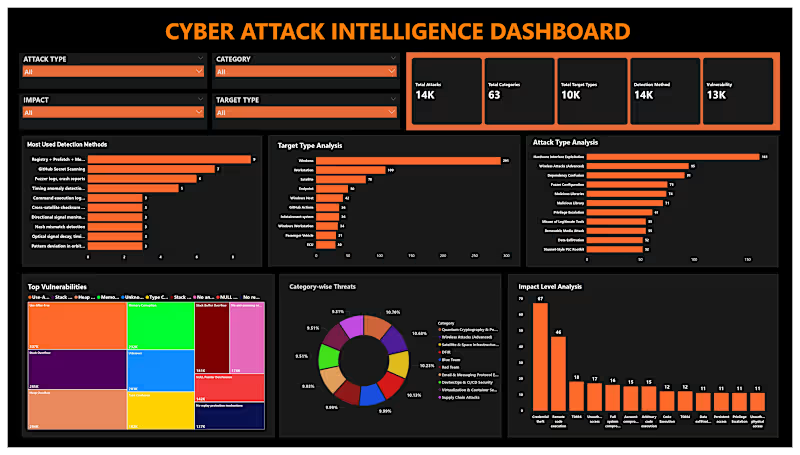
Cyber Security Analytics Dashboard 🔐📊
Cybersecurity is more than detecting threats—it's about turning security data into actionable insights.
In this Power BI dashboard, I analyzed cybersecurity data to monitor security incidents, attack patterns, threat severity, affected systems, and overall security KPIs. The interactive dashboard helps organizations identify risks, improve monitoring, and support faster, data-driven security decisions.
Tools Used:
Power BI
SQL
Python (Data Cleaning & Analysis)
Key Skills:
Cyber Security Analytics | Threat Analysis | Security Dashboard | Risk Analysis | Incident Monitoring | Data Visualization | Business Intelligence | SQL | Python | Power BI | Data Analytics
#PowerBI #CyberSecurity #CyberSecurityAnalytics #ThreatIntelligence #DataAnalytics #BusinessIntelligence #DashboardDesign #SQL #Python #DataVisualization #DataAnalyst #PortfolioProject #SecurityAnalytics
0
94
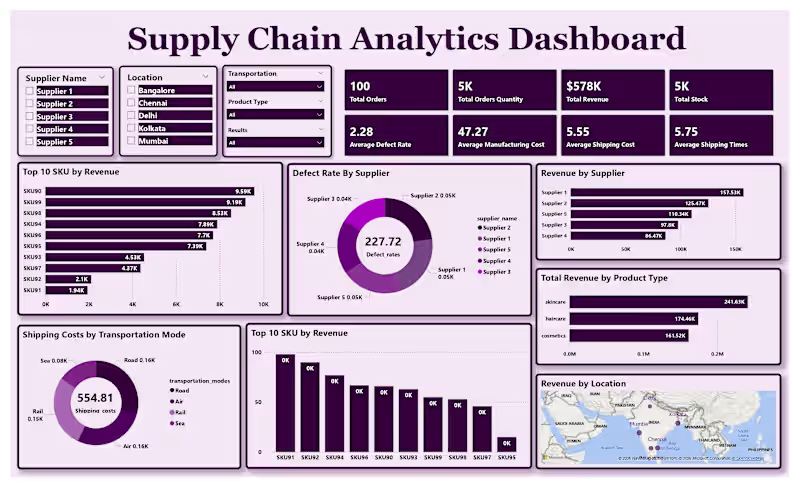
Supply Chain Performance Dashboard 📦📊
Efficient supply chains drive better business outcomes. This dashboard transforms operational data into actionable insights for inventory, logistics, and fulfillment performance.
Using Power BI, I analyzed key supply chain metrics such as order status, inventory levels, shipping performance, supplier efficiency, delivery timelines, and overall operational KPIs. The interactive dashboard helps identify bottlenecks, optimize inventory, and support data-driven decision-making.
Tools Used:
Power BI
SQL
Python (Data Cleaning & Analysis)
Key Skills:
Supply Chain Analytics | Inventory Analysis | Logistics Analytics | KPI Dashboard | Business Intelligence | Data Visualization | Data Cleaning | SQL | Power BI | Python | Business Analytics
#PowerBI #SupplyChain #SupplyChainAnalytics #Logistics #InventoryManagement #BusinessIntelligence #DataAnalytics #DashboardDesign #SQL #Python #DataVisualization #BusinessAnalytics #PortfolioProject #DataAnalyst
0
93
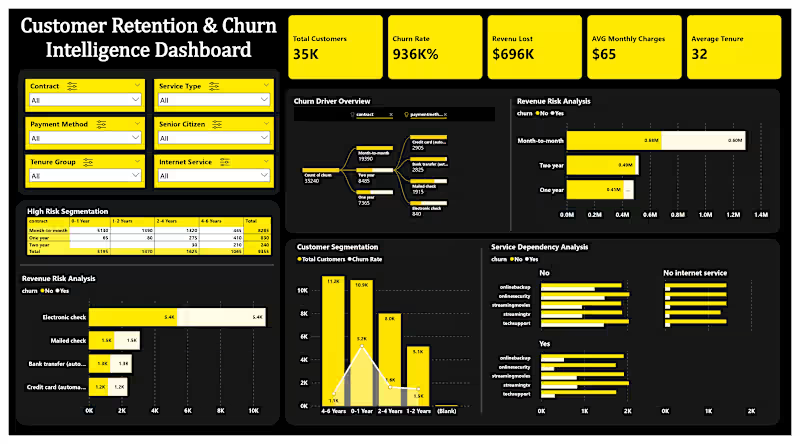
Telecom Customer Churn Analysis Dashboard 📊
Understanding why customers leave is essential for improving retention and business growth.
In this Power BI dashboard, I analyzed a telecom customer churn dataset to identify key churn drivers, customer demographics, contract types, monthly charges, payment methods, and tenure patterns. The dashboard provides interactive KPIs and visual insights that help businesses make data-driven decisions to reduce customer churn.
Tools Used:
• Power BI
• SQL
• Python (Data Cleaning & Analysis)
Key Skills:
Customer Churn Analysis | Data Cleaning | Data Visualization | KPI Dashboard | Business Intelligence | Interactive Reports | Data Analytics | Business Insights
#PowerBI #DataAnalytics #BusinessIntelligence #CustomerChurn #DashboardDesign #SQL #Python #DataVisualization #BusinessAnalytics #DataAnalyst #PortfolioProject #DataDrivenDecisionMaking
0
95

Data Warehouse Engineer | Cloud Enthusiast | Data Engineer
Data Warehouse Engineer | Cloud Enthusiast | Data Engineer

View more →

Data Analyst
Data Analyst


View more →

Software engineer skilled in data analysis, machin
Software engineer skilled in data analysis, machin
View more →

Transforming complex data into clear, strategic insights.
Transforming complex data into clear, strategic insights.

View more →

AI & Data Engineer|Data & AI Architect| AWS|Azure |Snowflake
AI & Data Engineer|Data & AI Architect| AWS|Azure |Snowflake
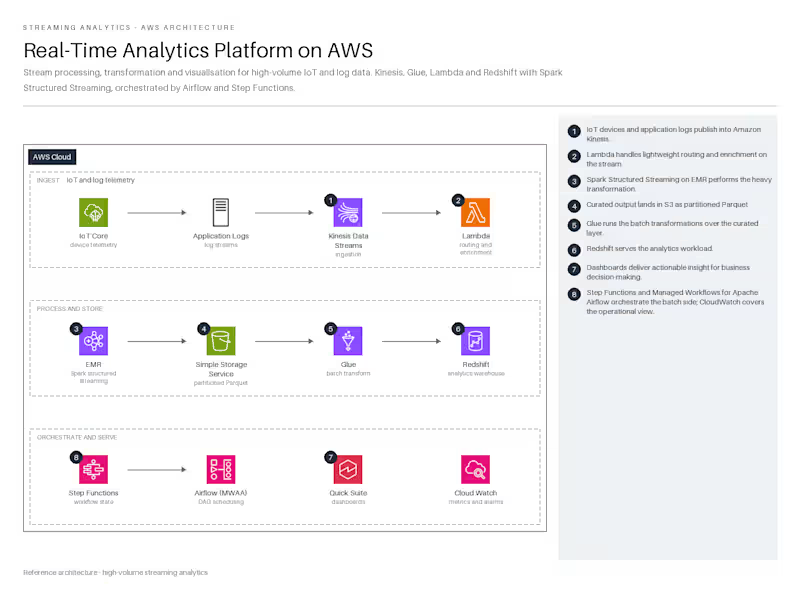
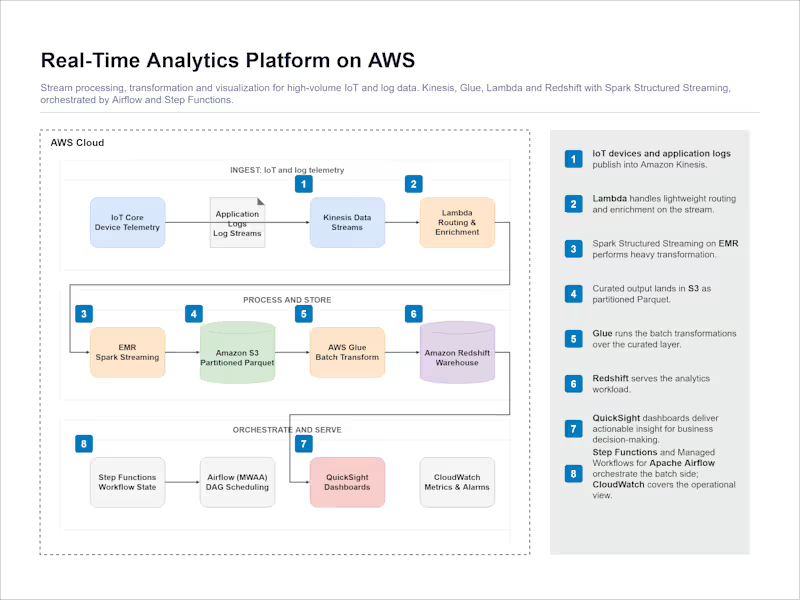
Real-Time Analytics Platform on AWS designed to ingest, process, and visualize high-volume streaming data from IoT devices and application logs.
Ingestion: Device telemetry (IoT Core) and application logs are published into Amazon Kinesis Data Streams, followed by lightweight routing and enrichment using AWS Lambda.
Processing & Storage: Amazon EMR performs heavy data transformations via Spark Structured Streaming, landing the curated output into Amazon S3 as partitioned Parquet files. AWS Glue then handles batch transformations before loading the data into Amazon Redshift for the analytics workload.
Orchestration & Serving: AWS Step Functions coordinate the batch processing workflows. Finally, Amazon QuickSight generates actionable business dashboards while Amazon CloudWatch monitors operational metrics and alarms
0
515
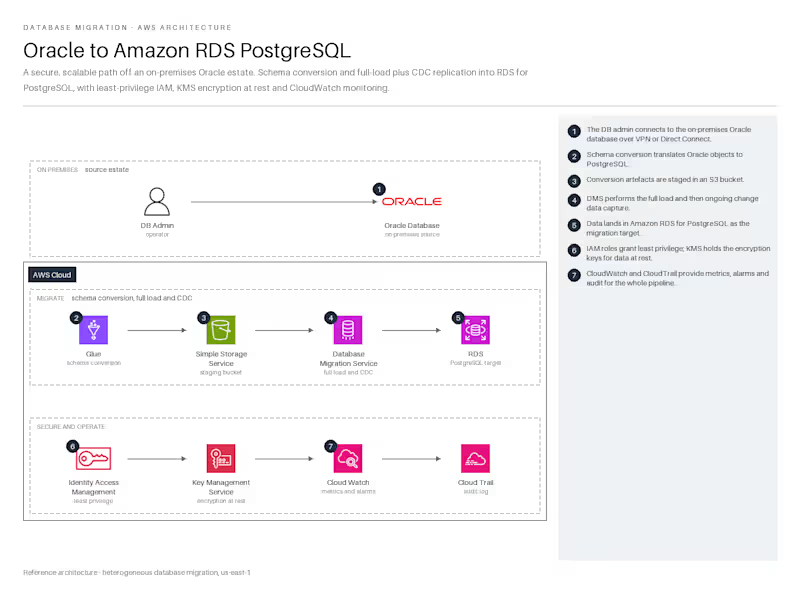
Oracle to Amazon RDS PostgreSQL
Designed and Implemented a secure, scalable architecture to migrate an on-prem Oracle database to Amazon RDS for PostgreSQL.
Data Flow: Modeled end-to-end flow, used AWS Glue (SCT) for schema conversion and DMS for full-load and CDC. Stored artifacts in S3 and loaded into RDS.
Services: Glue for conversion, DMS for Migration , S3 for artifacts, and RDS as target.
Security: IAM roles with least privilege, KMS for encryption at rest.
HA & DR: Architected in us-east-1 with Glue, DMS, RDS, S3, and monitoring via CloudWatch.
0
474
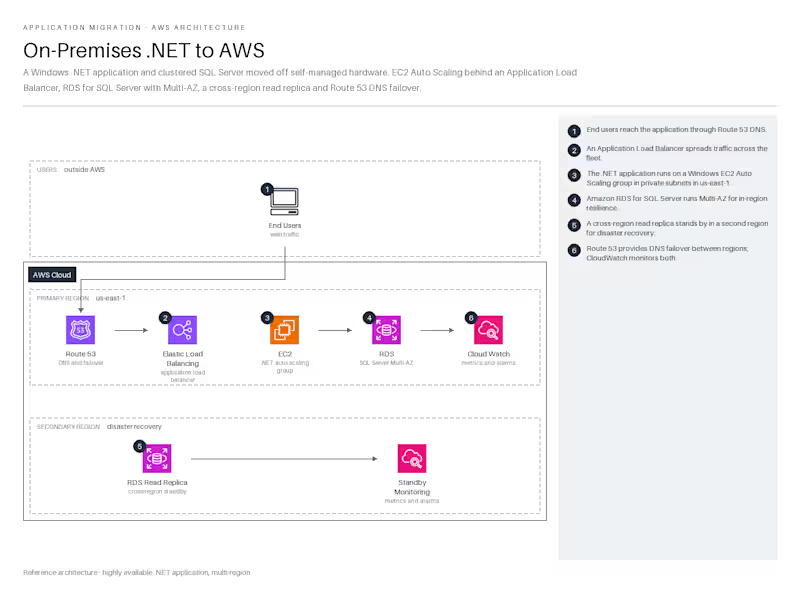
OnPrem .NET to AWS Migration
Migrated an on‐premises .NET web application and SQL Server database to AWS to achieve scalability, high availability, and cross‐region resilience. The legacy environment ran on Windows servers with a clustered SQL Server, resulting in high maintenance and limited elasticity. The new AWS architecture features EC2 Auto Scaling behind an Application Load Balancer (ALB), Amazon RDS for SQL Server with Multi‐AZ and a cross‐region read replica, and DNS failover via Route 53.
◦ Deployed the .NET application on an EC2 Auto Scaling group (Windows AMI) across private subnets in us‐east‐1.
5- Build Scalable Real-Time Data Analytics on AWS for Instant Insights
Designed and implemented a real-time data analytics platform on AWS, enabling stream processing, transformation, and visualization for high-volume IoT and log data. This system was built to process and analyze millions of records per second, providing actionable insights for business decision-making.
The solution leveraged AWS native services like Kinesis, Glue, Lambda, and Redshift, integrating Apache Spark Structured Streaming to handle real-time data ingestion and transformation. Airflow and Step Functions were used for workflow automation.
0
505