
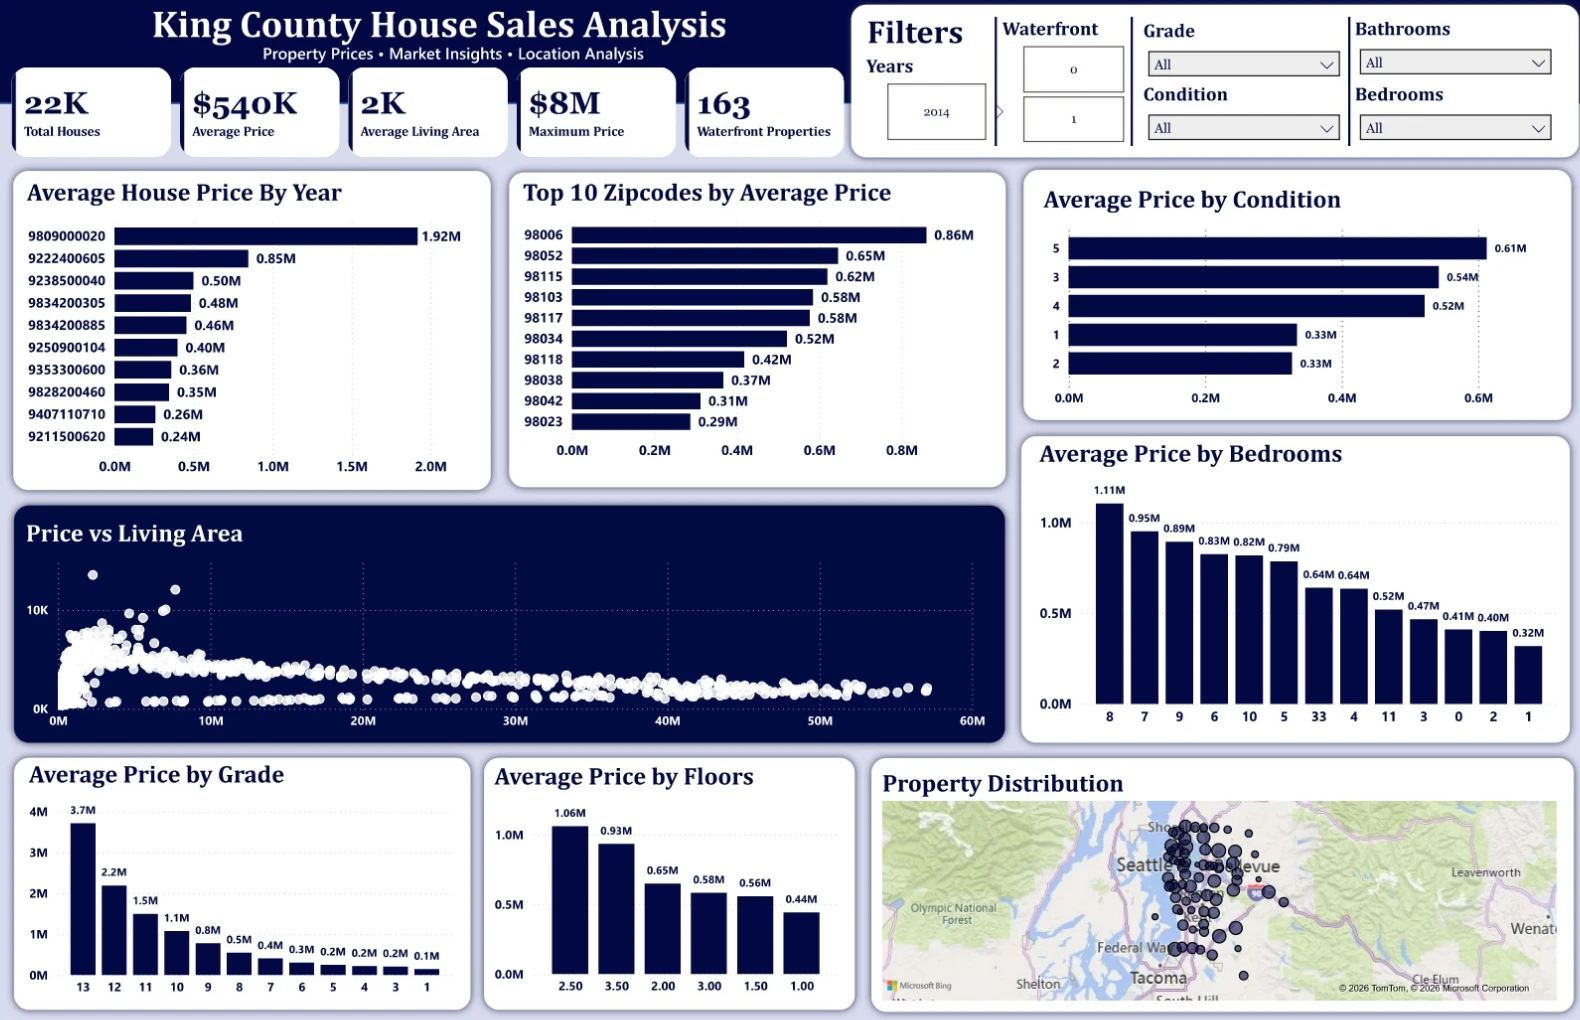
Finally wrapped up the Power BI dashboard for my House Sales Analysis project 🏠📊
After cleaning and exploring the data with Python and writing SQL queries, I used Power BI to turn the analysis into an interactive dashboard.
In the dashboard, I explored:
House price trends
Property size and pricing
House grades
Waterfront vs non-waterfront properties
Location-wise pricing
Bedrooms and other property features
I also worked with DAX measures, slicers, interactive visuals, and KPIs to make the dashboard more useful for exploring the data.
This project helped me practice the complete data analytics workflow:
Python → Data Cleaning & EDA → SQL → Power BI
Still learning and improving with every project. 🚀
#PowerBI #DataAnalyst #DataAnalytics #SQL #Python #EDA #DataCleaning #DAX #BusinessIntelligence #DataVisualization #PowerBIDashboard #PortfolioProject #DataAnalysis
0 likes · 0 views · Aug 15, 2026
Finally wrapped up the Power BI dashboard for my House Sales Analysis project 🏠📊 After cleaning and exploring the data with Python and writing SQL queries,...


