Product Discovery & AI Evaluation Strategist
Product Discovery & AI Evaluation Strategist


Strategy + Operations + Project Management
- $5k+
- Earned
- 1x
- Hired
- 5.0
- Rating
- 17
- Followers
Strategy + Operations + Project Management


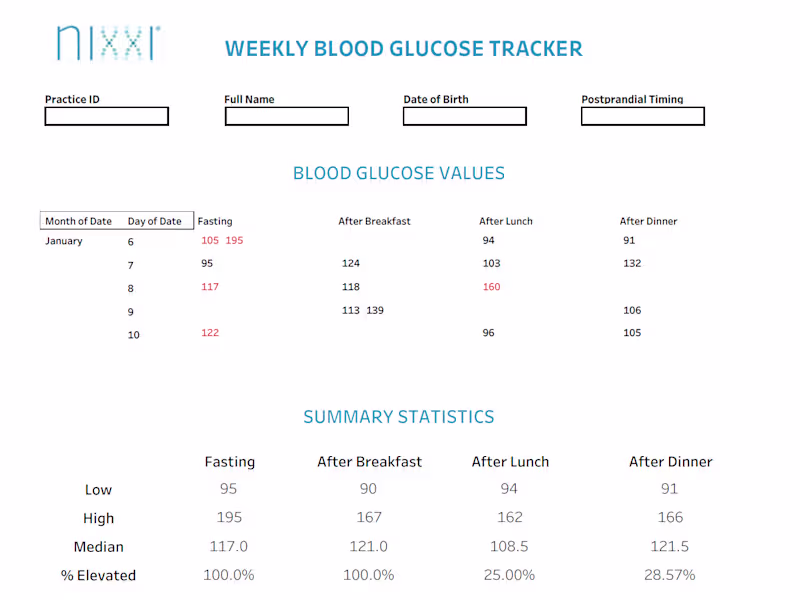
Analytics consultant for dashboards, SQL, and insights.
New to Contra
Analytics consultant for dashboards, SQL, and insights.
Data Analyst helping businesses turn data into insights
Data Analyst helping businesses turn data into insights

View more →
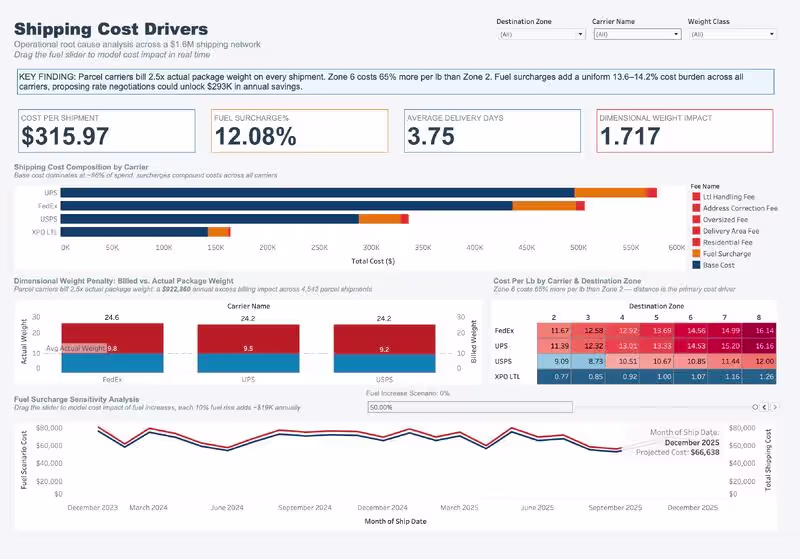
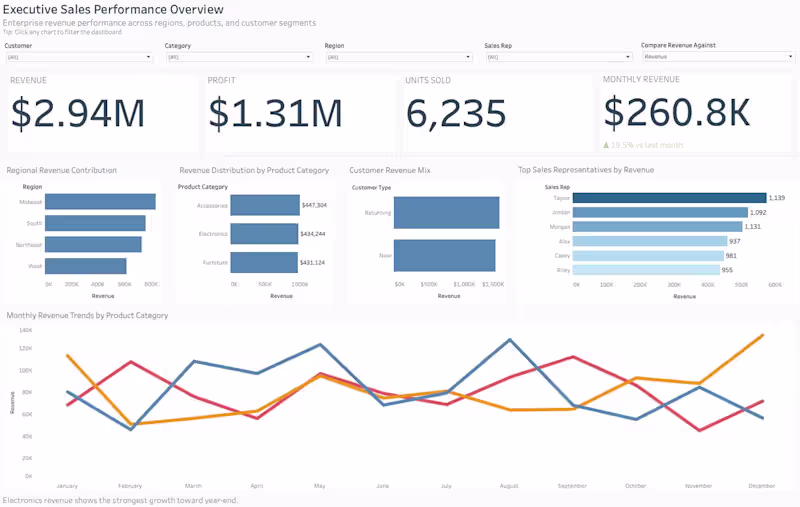
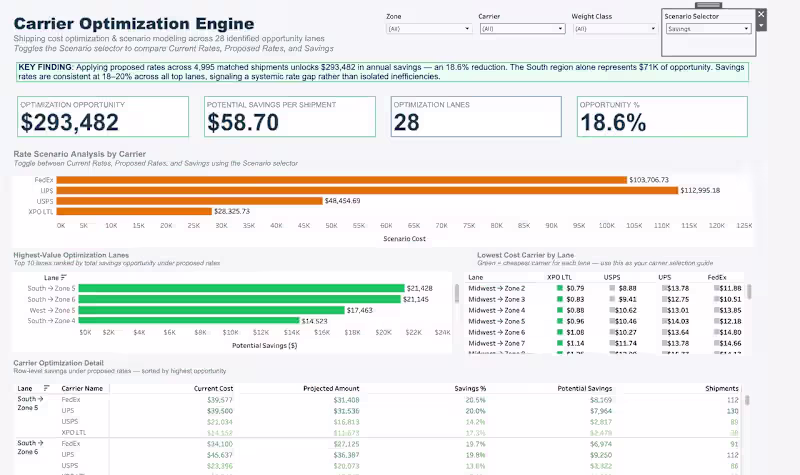
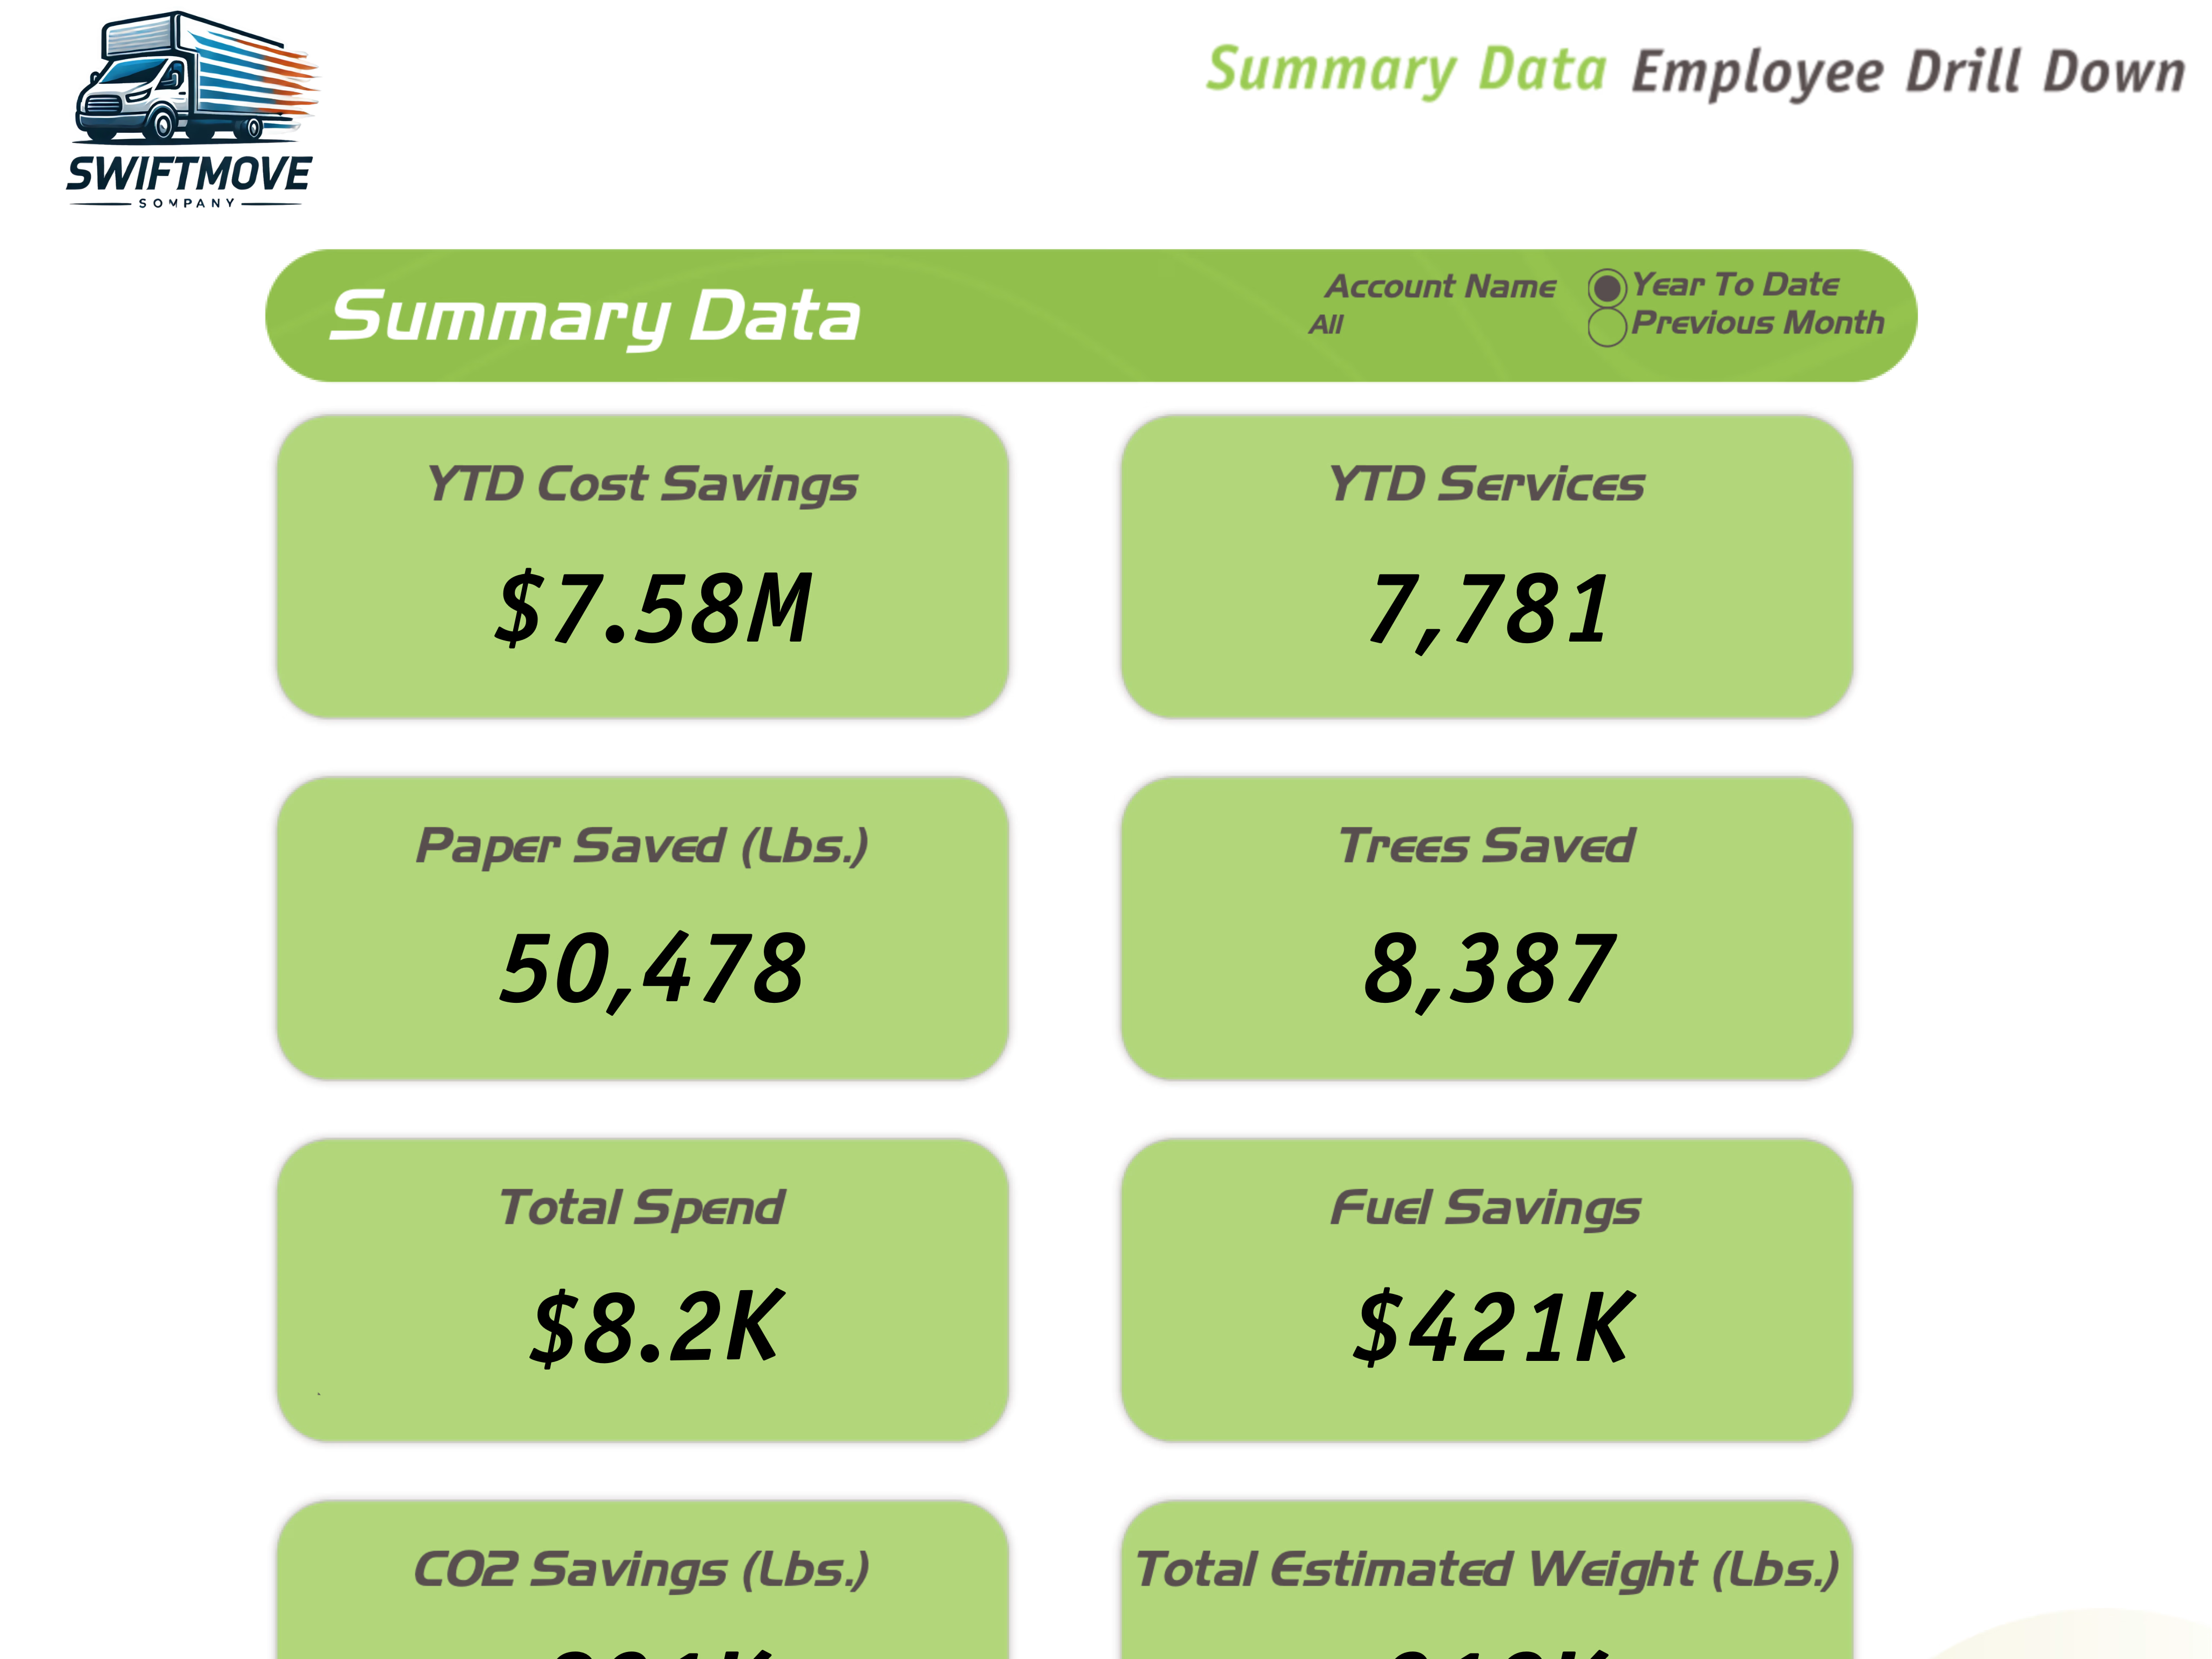
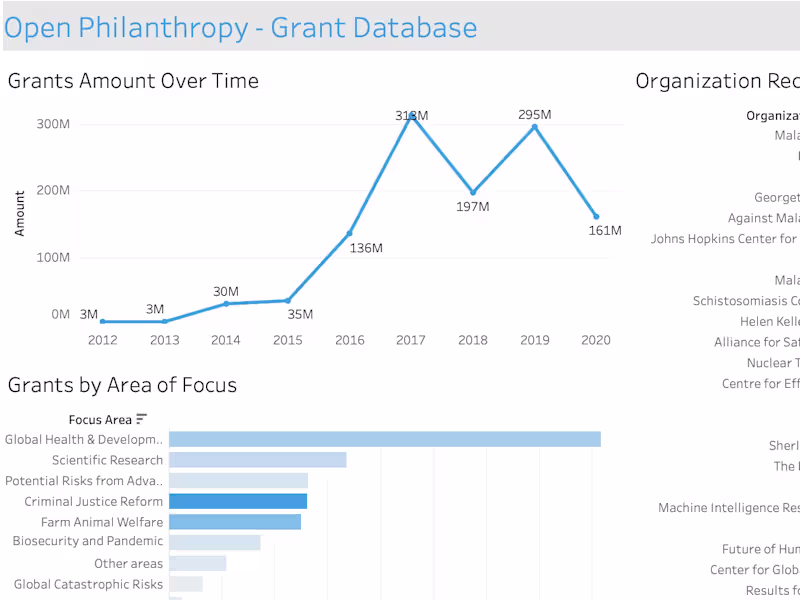
Tableau & BI Design Expert: From Data to Decisions 📊
Tableau & BI Design Expert: From Data to Decisions 📊

View more →
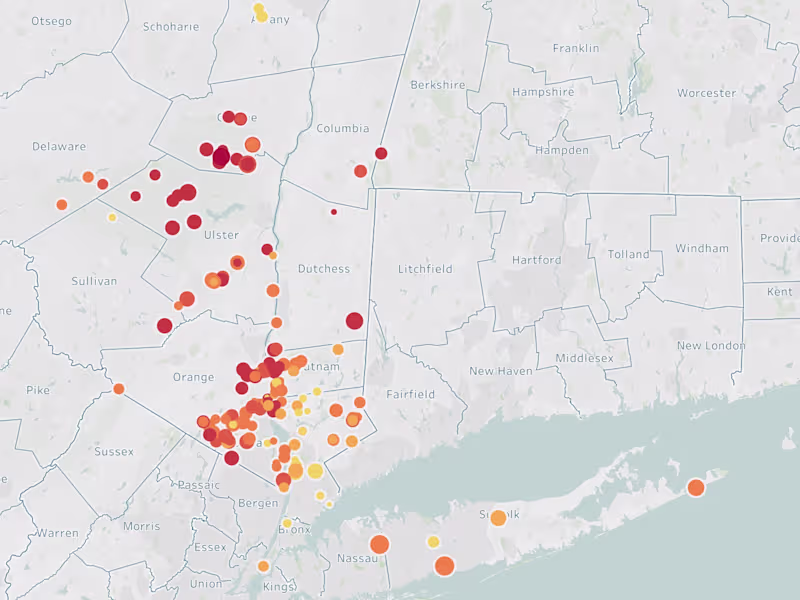
Bringing Data to Life
Bringing Data to Life

Artistic Consultant: Elevating Self-Expression
Artistic Consultant: Elevating Self-Expression


View more →
Writer. Producer. Creative.
Writer. Producer. Creative.