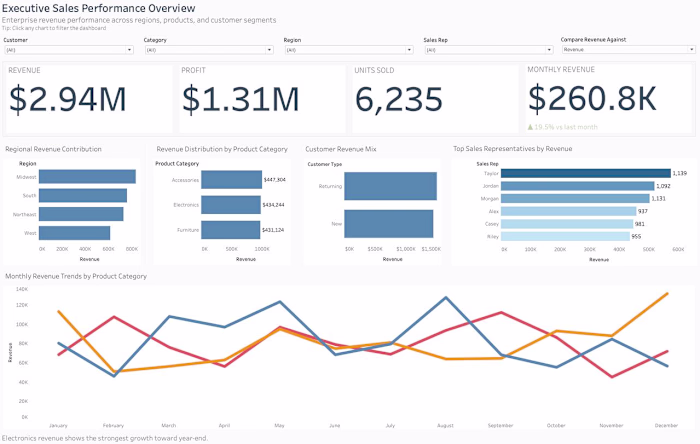
Sales Performance Analytics Dashboard
Jovanne Saldierna
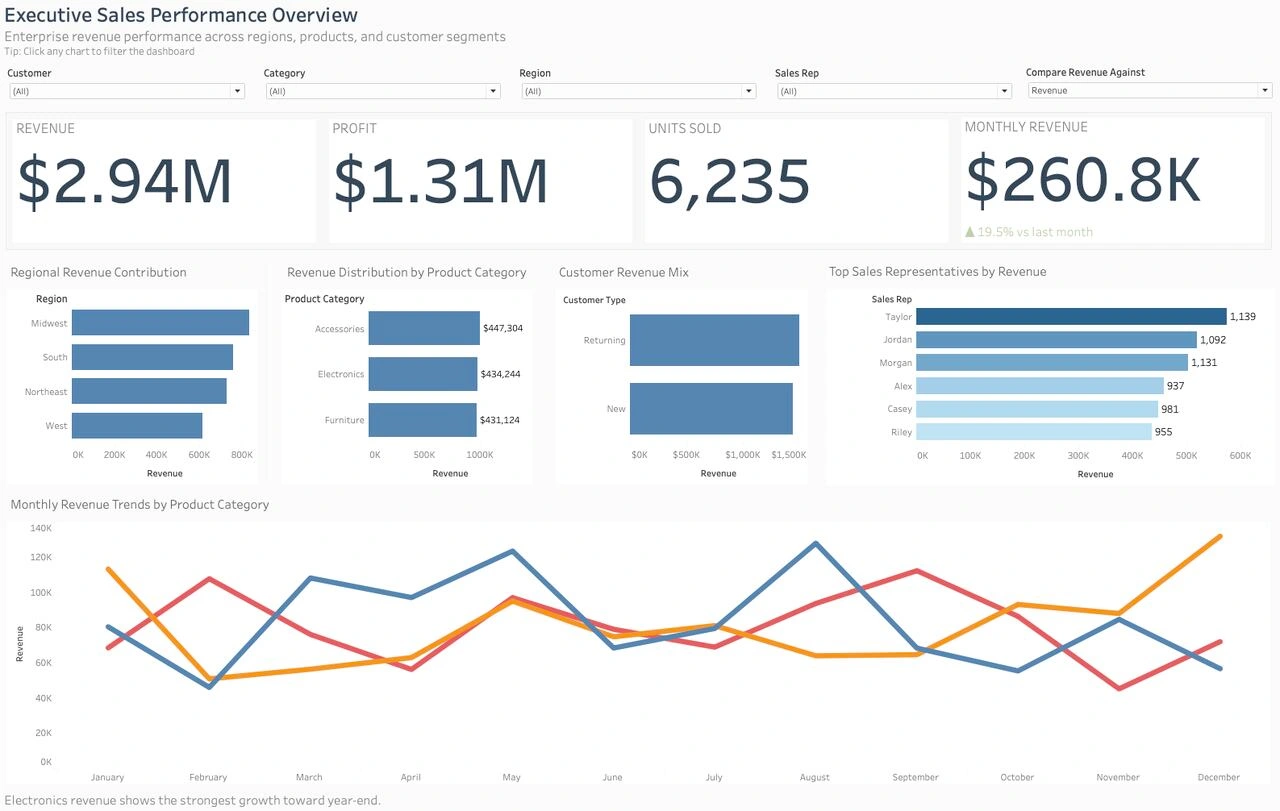
Overview
Built an interactive Tableau dashboard analyzing sales performance, revenue trends, profitability, product performance, regions, and customer segments. The dashboard was designed to help business leaders identify growth opportunities, margin gaps, underperforming segments, and top revenue drivers.
What I Delivered
Executive KPI Dashboard
High-level metrics for sales, profit, quantity, and performance trends, giving leadership a snapshot of business health at a glance.
Product & Category-Level Sales Analysis
Breakdowns by product and category to identify top performers, underperformers, and revenue concentration risks.
Regional & Customer Segment Performance
Geographic and segment-level views to surface regional differences and pinpoint where growth or margin improvement is possible.
Profitability Analysis
Margin gap identification across products, regions, and customer segments to highlight where revenue isn't translating into profit.
Interactive Filters & Drilldowns
Stakeholders can explore the data on their own terms, slicing by product, region, segment, and time period.
Visual Storytelling
Clean, structured layouts that combine KPI reporting, segmentation, trend analysis, and product-level insights into one cohesive view.
Outcome & Impact
Turned raw sales data into a decision-ready analytics experience
Surfaced top-performing products, weaker customer segments, and regional performance differences
Highlighted profitability opportunities across segments and product lines
Supports faster executive review by combining KPIs, segmentation, trends, and product insights in one Tableau dashboard
Like this project
Posted May 31, 2026
Likes
0
Views
4