
Jovanne Saldierna
Analytics consultant for dashboards, SQL, and insights.
New to Contra
Jovanne is ready for their next project!
Most small businesses are making decisions off numbers they don't fully trust.
Mismatched reports. Spreadsheets that take hours to update. Metrics that mean different things to different people.
I spent 4 years fixing exactly this at HCA Healthcare across 186 facilities and at Dell across 100+ enterprise accounts. Reduced manual reporting by 60%. Standardized 30+ KPIs so every team was finally working from the same numbers.
Now I bring that same rigor to smaller teams that need real analytics without hiring a full-time analyst.
If your data is a mess or your reporting takes longer than it should, that's exactly what I do.
Open to dashboard builds, SQL audits, and monthly reporting setups. DMs open. https://public.tableau.com/app/profile/jovanne.saldierna/viz/ShippingCostIntelligenceSystem/ShippingCostIntelligence
1
87
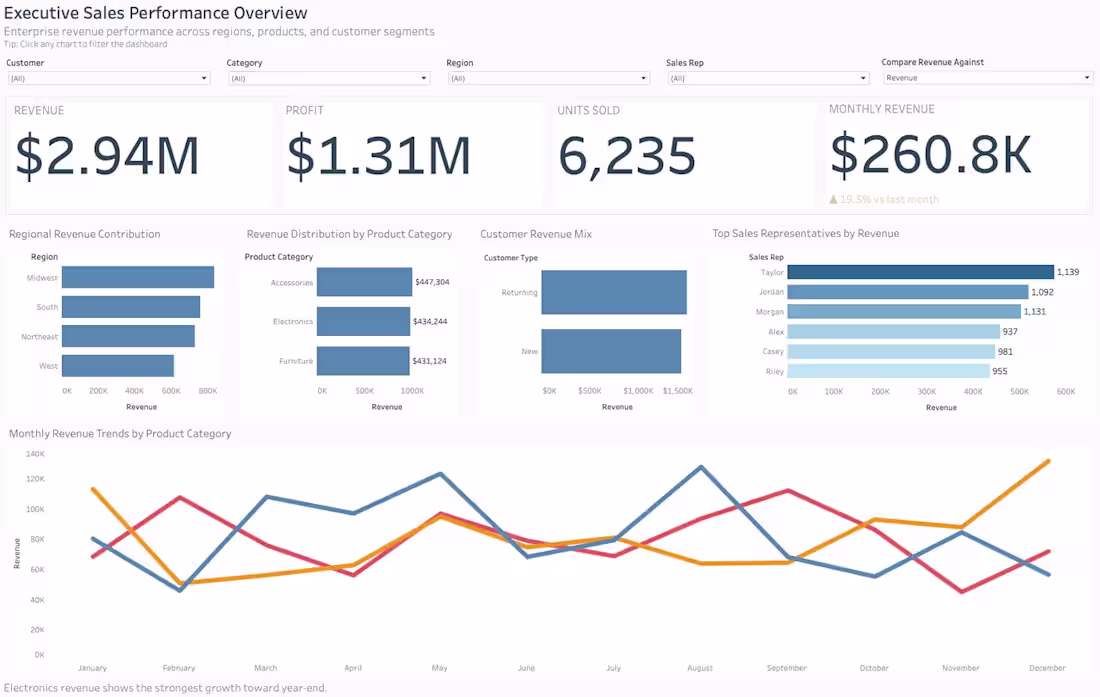
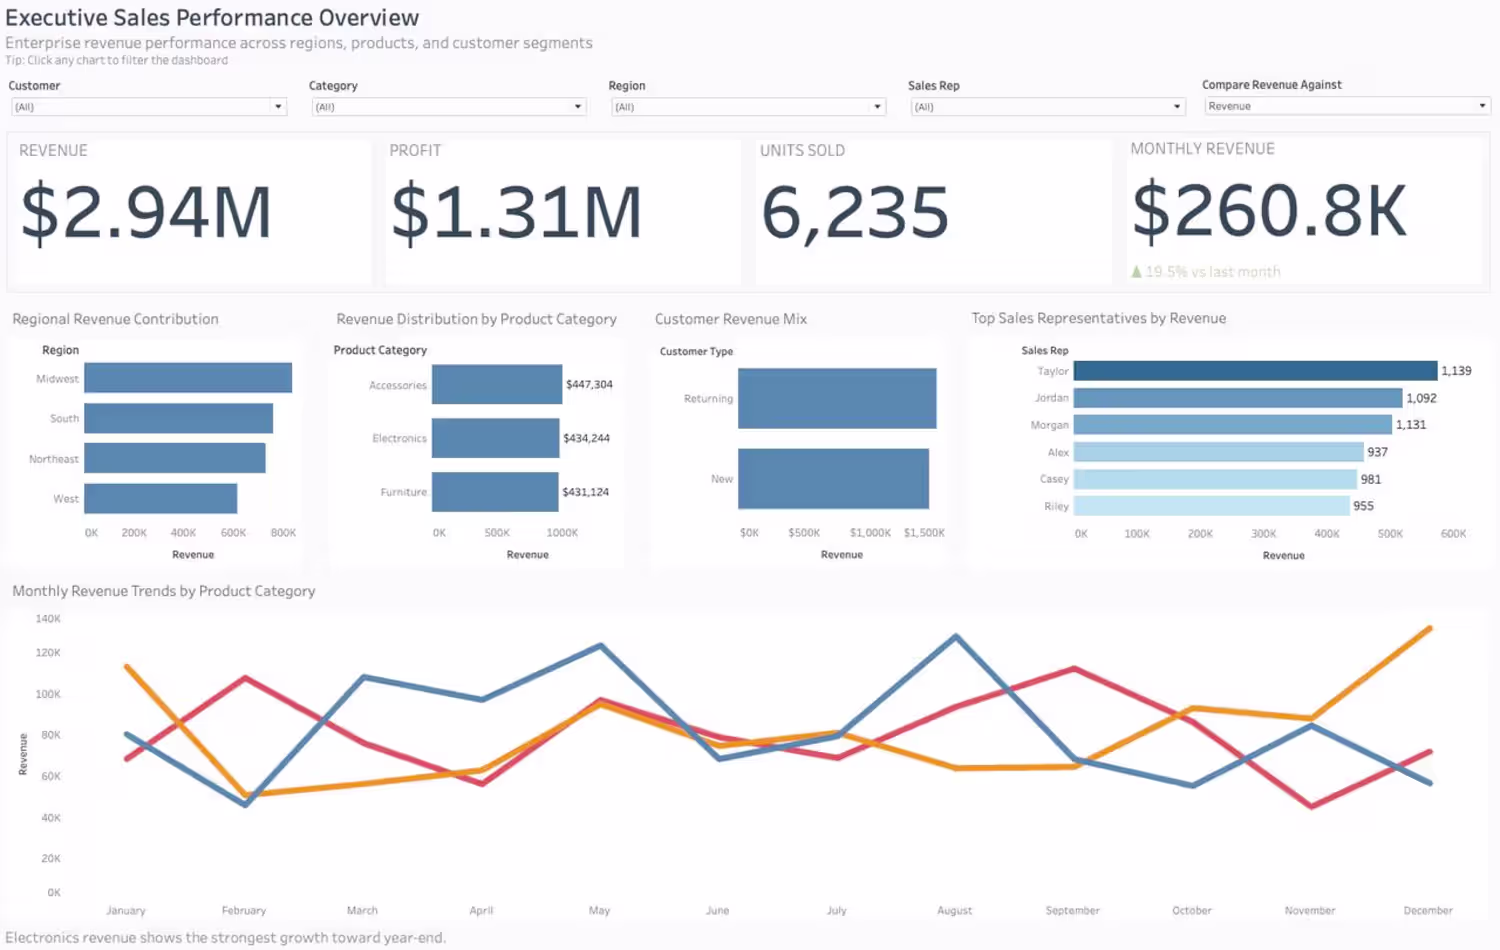
Sales Performance Analytics Dashboard
0
4
Carrier Cost Optimization & Negotiation Dashboard
0
4
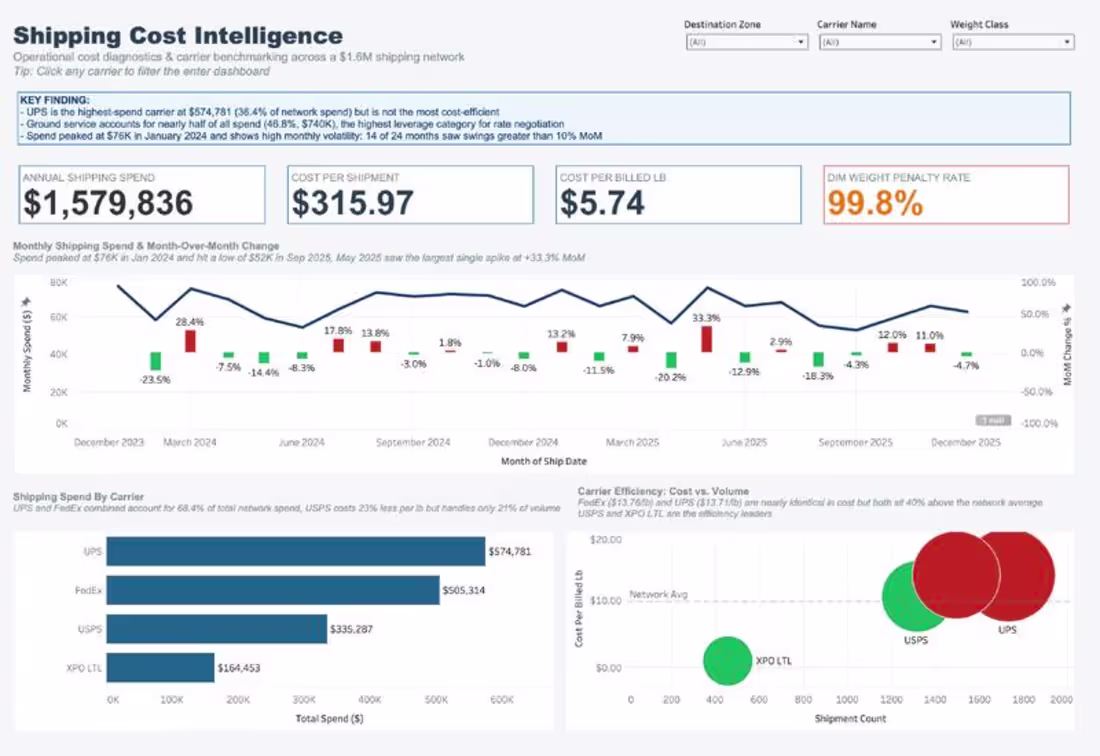
Shipping Cost Intelligence System
A consulting-style analytics case study modeling how a growth-stage retailer with $1.6M in annual shipping spend could consolidate fragmented carrier data into a single decision-support system, unlocking $293,482 in identified savings opportunities (18.6% cost reduction).
1
55
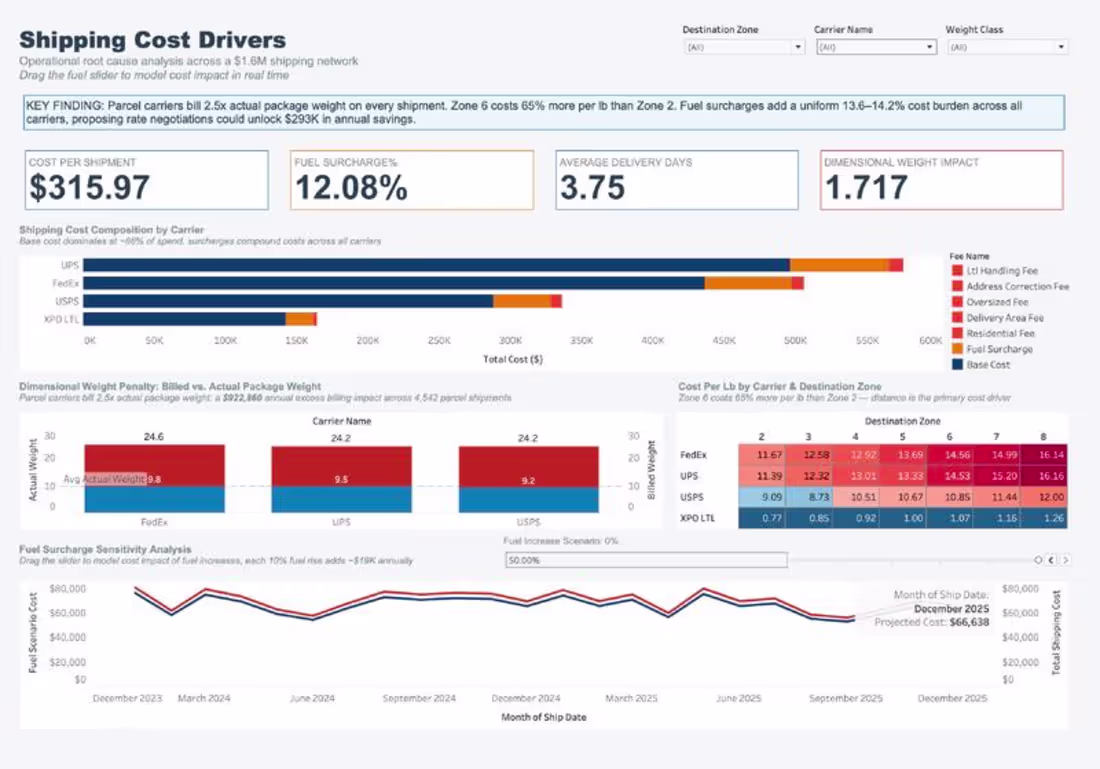
Shipping Cost Drivers , Root Cause Analysis
Built a root-cause Tableau dashboard analyzing shipping cost drivers across carriers, destination zones, fees, and package weight. The analysis found that parcel carriers bill 2.5x actual package weight, creating a $922K annual excess billing impact, while Zone 6 costs 65% more per lb than Zone 2. The dashboard also includes carrier cost breakdowns and a fuel surcharge sensitivity model to estimate cost exposure from fuel increases up to 50%.
1
40
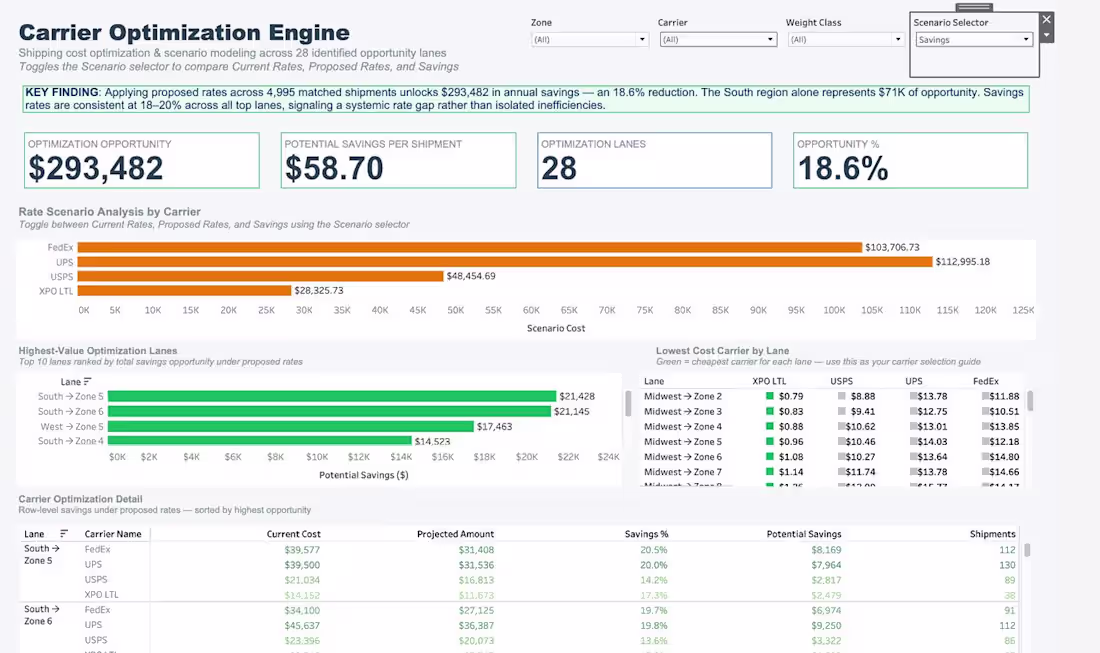
Carrier Optimization Engine, $293K Savings Model
Built a Tableau optimization engine modeling carrier rate scenarios across 28 shipping lanes to identify validated cost-saving opportunities. The analysis found $293,482 in annual savings, an 18.6% cost reduction, and $58.70 potential savings per shipment by comparing current rates, proposed rates, and savings by carrier. The dashboard also surfaced the highest-value optimization lanes, with the South region representing $71K in opportunity and lane-level savings ranging from 18–20% across multiple carriers.
1
41

Interactive Tableau dashboard for sales, revenue, and profitability insights.
Built an interactive Tableau dashboard analyzing sales, revenue, profitability, product performance, regions, and customer segments. The dashboard combines executive KPIs, filters, and drilldowns to highlight top products, underperforming segments, margin gaps, and growth opportunities.
1
52