Carrier Cost Optimization & Negotiation Dashboard
Jovanne Saldierna
Overview
I built a Tableau-based shipping cost intelligence dashboard to analyze $1.6M in shipping spend across carriers, destination zones, package weight classes, and monthly trends. The dashboard was designed to help logistics teams understand cost drivers, benchmark carrier efficiency, and identify negotiation opportunities.
What I Delivered
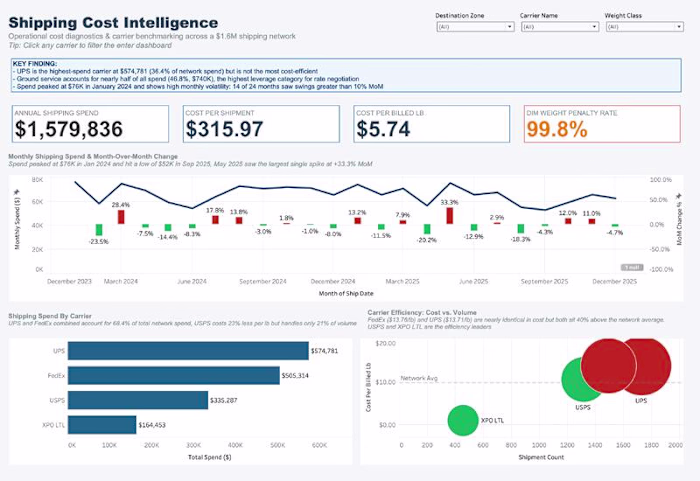
Executive KPI Dashboard
A high-level view of annual shipping spend, cost per shipment, cost per billed pound, and DIM weight penalty rate, giving leadership immediate visibility into shipping cost performance.
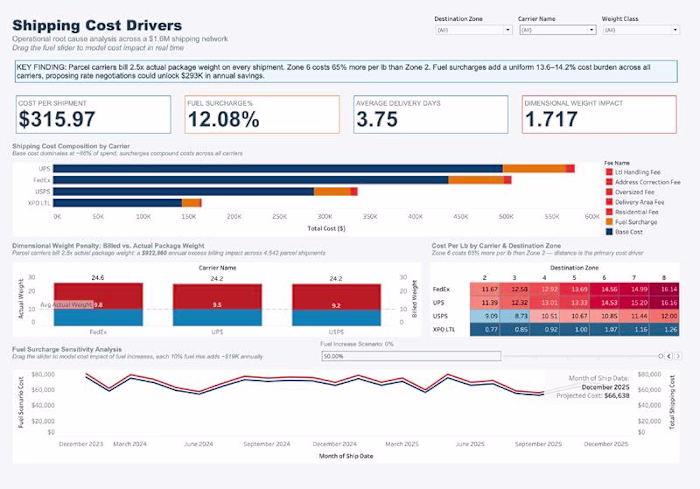
Root-Cause Cost Driver Analysis
Deep-dive breakdowns across carriers, destination zones, surcharges, and dimensional weight impact to pinpoint exactly where costs were inflating.
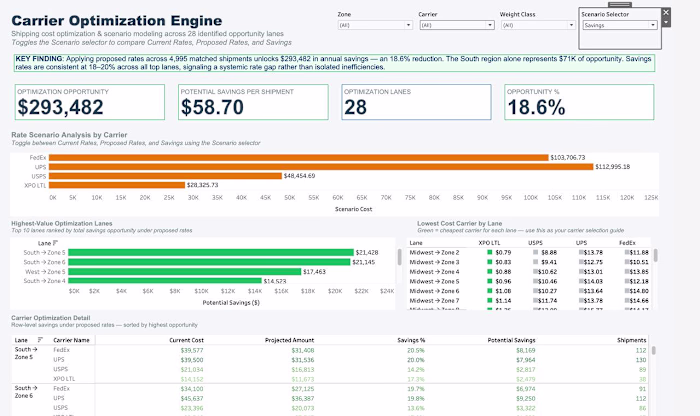
Carrier Optimization Engine
A comparison tool analyzing current rates vs. proposed rates and calculating potential savings by lane, enabling data-backed carrier negotiations.
Interactive Filters
Users can slice data by carrier, zone, weight class, and scenario selection to explore cost dynamics on their own terms.
Business Insights & Recommendations
Clear, actionable insights for cost reduction strategy and carrier negotiation positioning.
Outcome & Impact
$293,482 in annual savings opportunities identified
18.6% potential cost reduction
$58.70 in potential savings per shipment
Parcel carriers billed 2.5x actual package weight, creating a $922K annual excess billing impact
Zone 6 costs 65% more per lb than Zone 2
South region alone represented $71K in optimization opportunity
The dashboard gave the logistics team a clear, data-driven playbook for carrier negotiations and cost optimization, turning raw shipping data into strategic leverage.
Like this project
Posted May 31, 2026
Likes
0
Views
4