Freelance Data Analysts in New York
Sign Up
Post a job
Sign Up
Log In
Filters
2
Projects
People
Shekh Al Raihan
pro
New York, USA
Senior Product Designer with 8+ years of experience
1x
Hired
4.4
Rating
46
Followers
Follow
Message
Senior Product Designer with 8+ years of experience
0
Zephyr | A B2B Web3 Payments Platform
0
10
0
Carvex | Reimagined Logistics
0
18
0
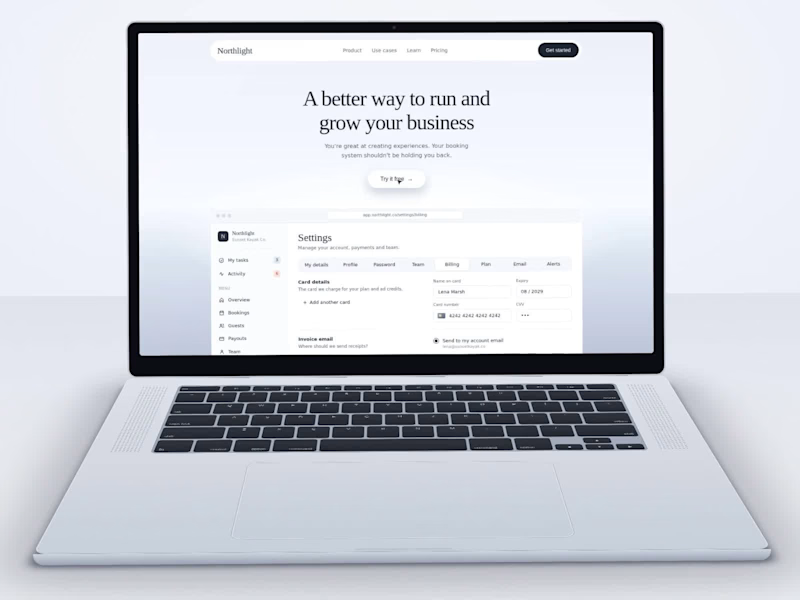
I designed and animated Northlight, a modern SaaS platform built to help businesses manage daily work and grow with ease. My focus was on creating a clean, intuitive website experience through thoughtful UI/UX design, clear typography, soft colors, and balanced layouts. To bring the design to life, I created smooth camera movements, realistic 3D laptop mockups, and seamless transitions to showcase the website, dashboard, integrations, and key features. The result is a polished SaaS presentation that combines purposeful product design with engaging motion to communicate the product's value.
0
33
12
Kestrel - SaaS Website Design & Animation:- I designed Kestrel, a modern SaaS website focused on clarity, simplicity, and a seamless user experience. I used elegant typography, soft colors, structured content sections, and interactive dashboard visuals to make complex product information easier to understand. I also brought the design to life with smooth camera movements, dynamic screen reveals, seamless transitions, and realistic 3D laptop presentations. My goal was to combine functional UI design with engaging motion to create a polished digital experience.
7
12
487
Data Analyst
(2)
Follow
Message
Aurelie Dussenne
New York, USA
Data visualization expert for actionable insights
$25k+
Earned
1x
Hired
29
Followers
Follow
Message
Data visualization expert for actionable insights
1
Custom Invoicing Solution with Microsoft Paginated Reports
1
73
2
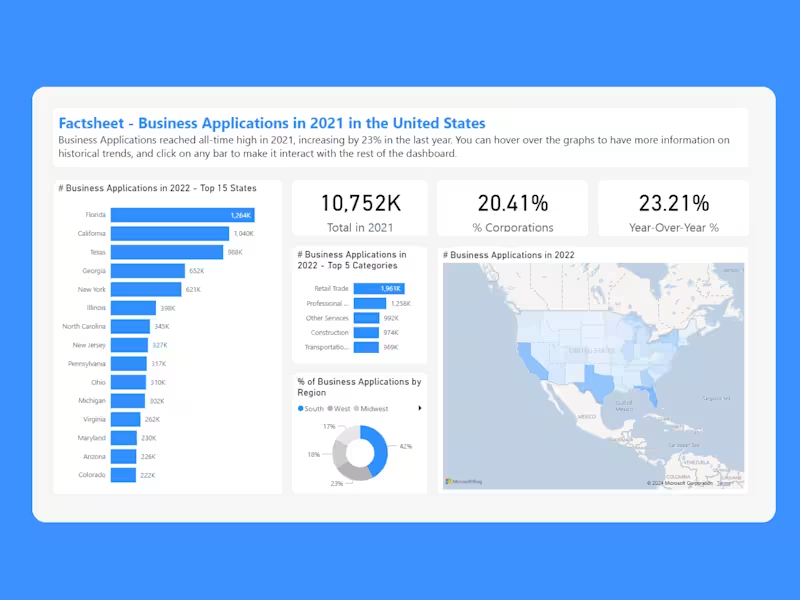
Transforming Complex Census Data into Actionable Insights
2
106
1
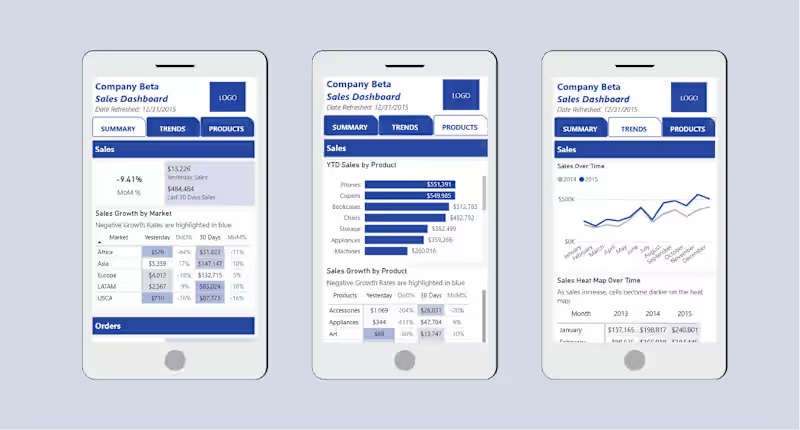
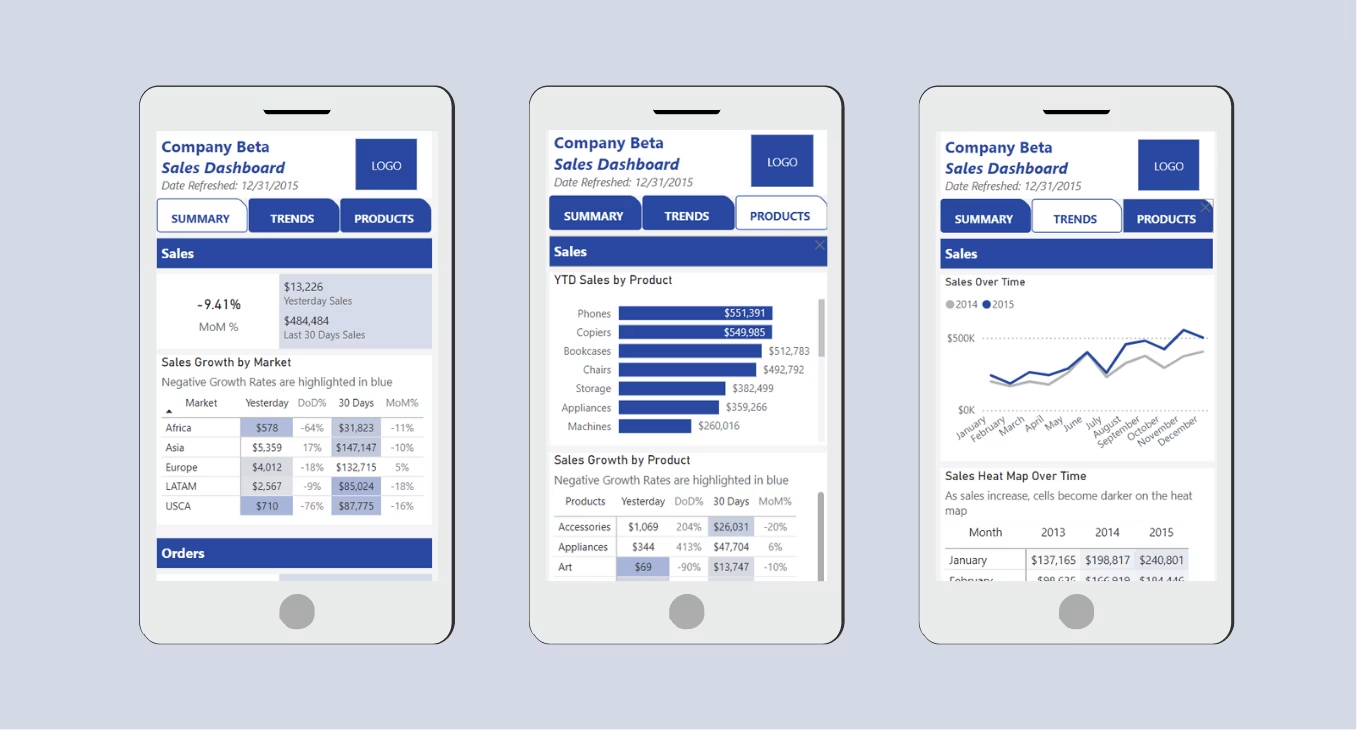
Wendy's - Power BI Mobile App
1
219
View more →
Data Analyst
(3)
Follow
Message
Moses NJUGUNA
New York, USA
Avid Software Engineer, Data Engineer and Technical Writer
New to Contra
Follow
Message
Avid Software Engineer, Data Engineer and Technical Writer
1
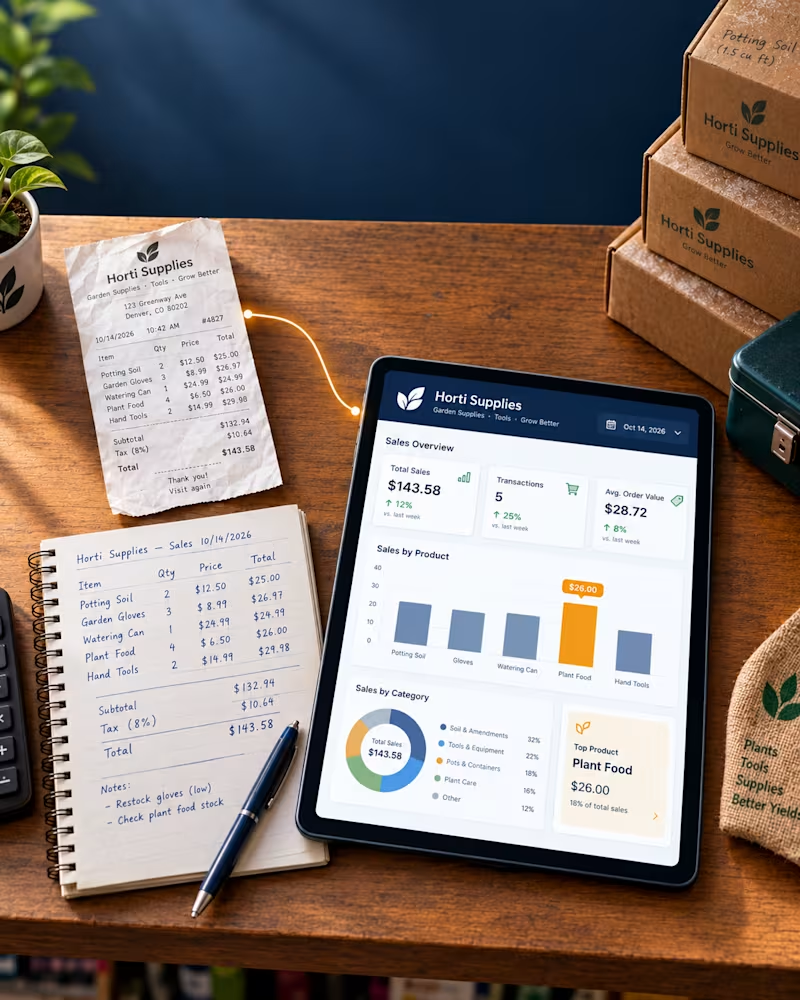
Data, AI, Software, Technical Writing 𝗬𝗢𝗨𝗥 𝗦𝗔𝗟𝗘𝗦 𝗗𝗔𝗧𝗔 𝗔𝗟𝗥𝗘𝗔𝗗𝗬 𝗞𝗡𝗢𝗪𝗦 𝗪𝗛𝗜𝗖𝗛 𝗖𝗨𝗦𝗧𝗢𝗠𝗘𝗥𝗦 𝗔𝗥𝗘 𝗔𝗕𝗢𝗨𝗧 𝗧𝗢 𝗟𝗘𝗔𝗩𝗘. Most owners check that money came in. Few ask what the numbers say about next month. I ran a 90-day Dead Stock Check on Horti Supplies data (about $14,500 in sales). In plain sight: 👤 𝟲 𝗼𝗳 𝘁𝗵𝗲 𝘁𝗼𝗽 𝟮𝟱 𝗰𝘂𝘀𝘁𝗼𝗺𝗲𝗿𝘀 𝗾𝘂𝗶𝗲𝘁𝗹𝘆 𝘀𝘁𝗼𝗽𝗽𝗲𝗱 𝗯𝘂𝘆𝗶𝗻𝗴: about $550 a month walking away. $𝟵𝟰𝟬 𝘀𝘁𝘂𝗰𝗸 𝗼𝗻 𝘁𝗵𝗲 𝘀𝗵𝗲𝗹𝗳 - 8 products unsold for 30 to 83 days made 2.4% of sales but held 22% of stock value. 📉 𝗧𝗵𝗲 𝟯𝗿𝗱 𝗯𝗲𝘀𝘁-𝘀𝗲𝗹𝗹𝗶𝗻𝗴 𝗽𝗿𝗼𝗱𝘂𝗰𝘁 𝗿𝗮𝗻𝗸𝗲𝗱 𝟮𝟭𝘀𝘁 𝗳𝗼𝗿 𝗽𝗿𝗼𝗳𝗶𝘁. 🕑 𝗧𝗵𝗿𝗲𝗲 𝘀𝗹𝗼𝘄 𝗮𝗳𝘁𝗲𝗿𝗻𝗼𝗼𝗻 𝗵𝗼𝘂𝗿𝘀 - brought in 7% of sales; rent and staff costs didn’t drop. 𝗧𝗿𝘆 𝘁𝗵𝗶𝘀 𝘁𝗼𝗱𝗮𝘆 (𝟭𝟬 𝗺𝗶𝗻𝘂𝘁𝗲𝘀, 𝗻𝗼 𝘀𝗼𝗳𝘁𝘄𝗮𝗿𝗲): export last month’s sales, sort by profit, and circle anything that earned almost nothing but took up shelf space. 𝗧𝘄𝗼 𝘄𝗮𝘆𝘀 𝗜 𝗰𝗮𝗻 𝗵𝗲𝗹𝗽: 1️⃣ 𝗧𝗵𝗲 𝗗𝗲𝗮𝗱 𝗦𝘁𝗼𝗰𝗸 𝗖𝗵𝗲𝗰𝗸: send one month of sales data (names removed is fine) and get a one-page report on where cash is stuck, which customers are drifting, and 3 actions for this week. 🎁 The first 10 get it free, in return for sharing the anonymised result as a case study. 2️⃣ 𝗖𝗼𝗺𝗶𝗻𝗴 𝘀𝗼𝗼𝗻, 𝗜𝗻𝘀𝗶𝗴𝗵𝘁𝗟𝗼𝗼𝗽: upload a CSV or SQL export and get a named diagnosis (Customer Churn, Dead Stock, Demand Forecast) plus a visual report. 𝗖𝗼𝗺𝗺𝗲𝗻𝘁 “𝗖𝗛𝗘𝗖𝗞” 𝗳𝗼𝗿 𝗮 𝗳𝗿𝗲𝗲 𝗗𝗲𝗮𝗱 𝗦𝘁𝗼𝗰𝗸 𝗖𝗵𝗲𝗰𝗸, 𝗼𝗿 “𝗟𝗢𝗢𝗣” 𝗳𝗼𝗿 𝘁𝗵𝗲 𝗜𝗻𝘀𝗶𝗴𝗵𝘁𝗟𝗼𝗼𝗽 𝘄𝗮𝗶𝘁𝗹𝗶𝘀𝘁. I’m Moses, a data engineer and founder of Closertune. Do you know an owner who says, “Sales are slow, but I don’t know why”?
1
100
0
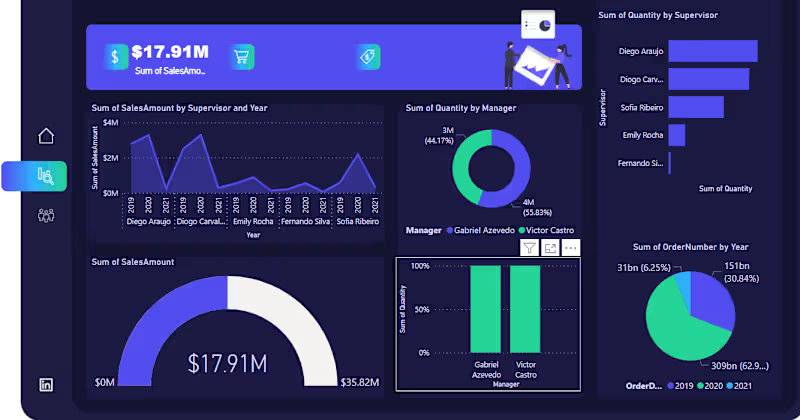
I recently built an interactive Power BI sales dashboard tracking $17.91M in total sales across supervisors, managers, and order years. I then designed the data model and DAX measures behind the KPI cards, gauge, and trend visuals, and built drill-down views: sales by supervisor and year, quantity split by manager, and order volume by year. I used combo visuals (donut, gauge, bar, and line charts) on one page so stakeholders can get the full picture without switching reports. I also focused on a clean, single-screen layout that non-technical stakeholders can read at a glance. #Microsoft Power BI #Daxko Operations #Data Visualization #Data Modeling #Business Intelligence
0
64
0
This is a web design project for an Institution.
0
66
1
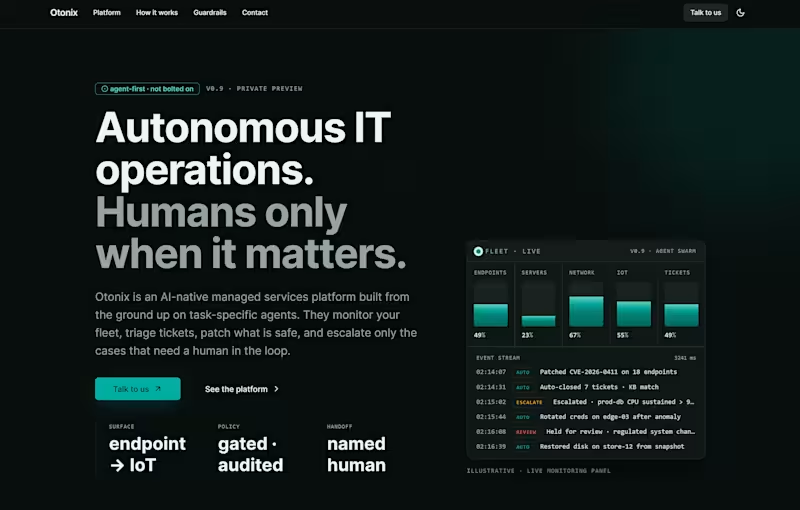
Building the technical foundation for Otonix, an AI-native IT Operations Platform I worked on the engineering side of Otonix, an autonomous IT operations platform built on agent-first, task-specific AI agents that monitor, triage, remediate, and escalate IT operations, instead of a chatbot bolted onto legacy RMM/PSA tooling. What the build involved: 🔹 Architecting the platform around four core agent capabilities: Monitor, Triage, Remediate, and Escalate. 🔹 Building the policy-guardrail layer that constrains automated actions and gates anything touching regulated systems or irreversible changes. 🔹 Implementing the audit trail: a signed, searchable, exportable log of every agent decision and action. 🔹 Working with a signal-ingestion pipeline (endpoints, servers, network, IoT) feeding into the triage/remediation flow. Python/FastAPI, Node.js, React, PostgreSQL, Docker, n8n, Kubernetes I build backend systems and full-stack platforms for technical products. Especially where reliability, auditability, and guardrails matter as much as the automation itself. If you're building something in a similar space, let's talk. 📩 mosesmorrisdev@gmail.com | github.com/Moses-Morris
1
97
Data Analyst
(3)
Follow
Message
Hadi Rajabbeigi
New York, USA
Data Analyst helping businesses turn data into insights
Follow
Message
Data Analyst helping businesses turn data into insights
0
Machine Learning for Social Scientists: A Practical Guide
0
4
1
Research Data Analysis and Visualization
1
5
0
Guide to Choosing Statistical Methods for Research
0
10
View more →
Data Analyst
(2)
Follow
Message
Sebastian Soran
New York, USA
Tableau & BI Design Expert: From Data to Decisions 📊
Follow
Message
Tableau & BI Design Expert: From Data to Decisions 📊
0
Business Intelligence Client Metrics Dashboard
0
20
0
Weekly Blood Glucose Tracker Dashboard
0
11
0
Dynamic Market Insights with Google Trends & Python
0
6
View more →
Data Analyst
(2)
Follow
Message
Anastasiya Kotelnikova
New York, USA
Data & Machine Learning Engineer | SQL, Python, AWS, NLP
Follow
Message
Data & Machine Learning Engineer | SQL, Python, AWS, NLP
0
House Price Regression with R
0
22
0
Equity Portfolio Optimization with R
0
7
1
GitHub - AnastasiyaKotelnikova/aws-movielens-mapreduce
1
30
0
COVID-19 Case Forecasting with Python
0
22
Data Analyst
(3)
Follow
Message
Jovanne Saldierna
New York, USA
Analytics consultant for dashboards, SQL, and insights.
New to Contra
Follow
Message
Analytics consultant for dashboards, SQL, and insights.
1
Most small businesses are making decisions off numbers they don't fully trust. Mismatched reports. Spreadsheets that take hours to update. Metrics that mean different things to different people. I spent 4 years fixing exactly this at HCA Healthcare across 186 facilities and at Dell across 100+ enterprise accounts. Reduced manual reporting by 60%. Standardized 30+ KPIs so every team was finally working from the same numbers. Now I bring that same rigor to smaller teams that need real analytics without hiring a full-time analyst. If your data is a mess or your reporting takes longer than it should, that's exactly what I do. Open to dashboard builds, SQL audits, and monthly reporting setups. DMs open. https://public.tableau.com/app/profile/jovanne.saldierna/viz/ShippingCostIntelligenceSystem/ShippingCostIntelligence
1
93
0
Sales Performance Analytics Dashboard
0
10
0
Carrier Cost Optimization & Negotiation Dashboard
0
13
1
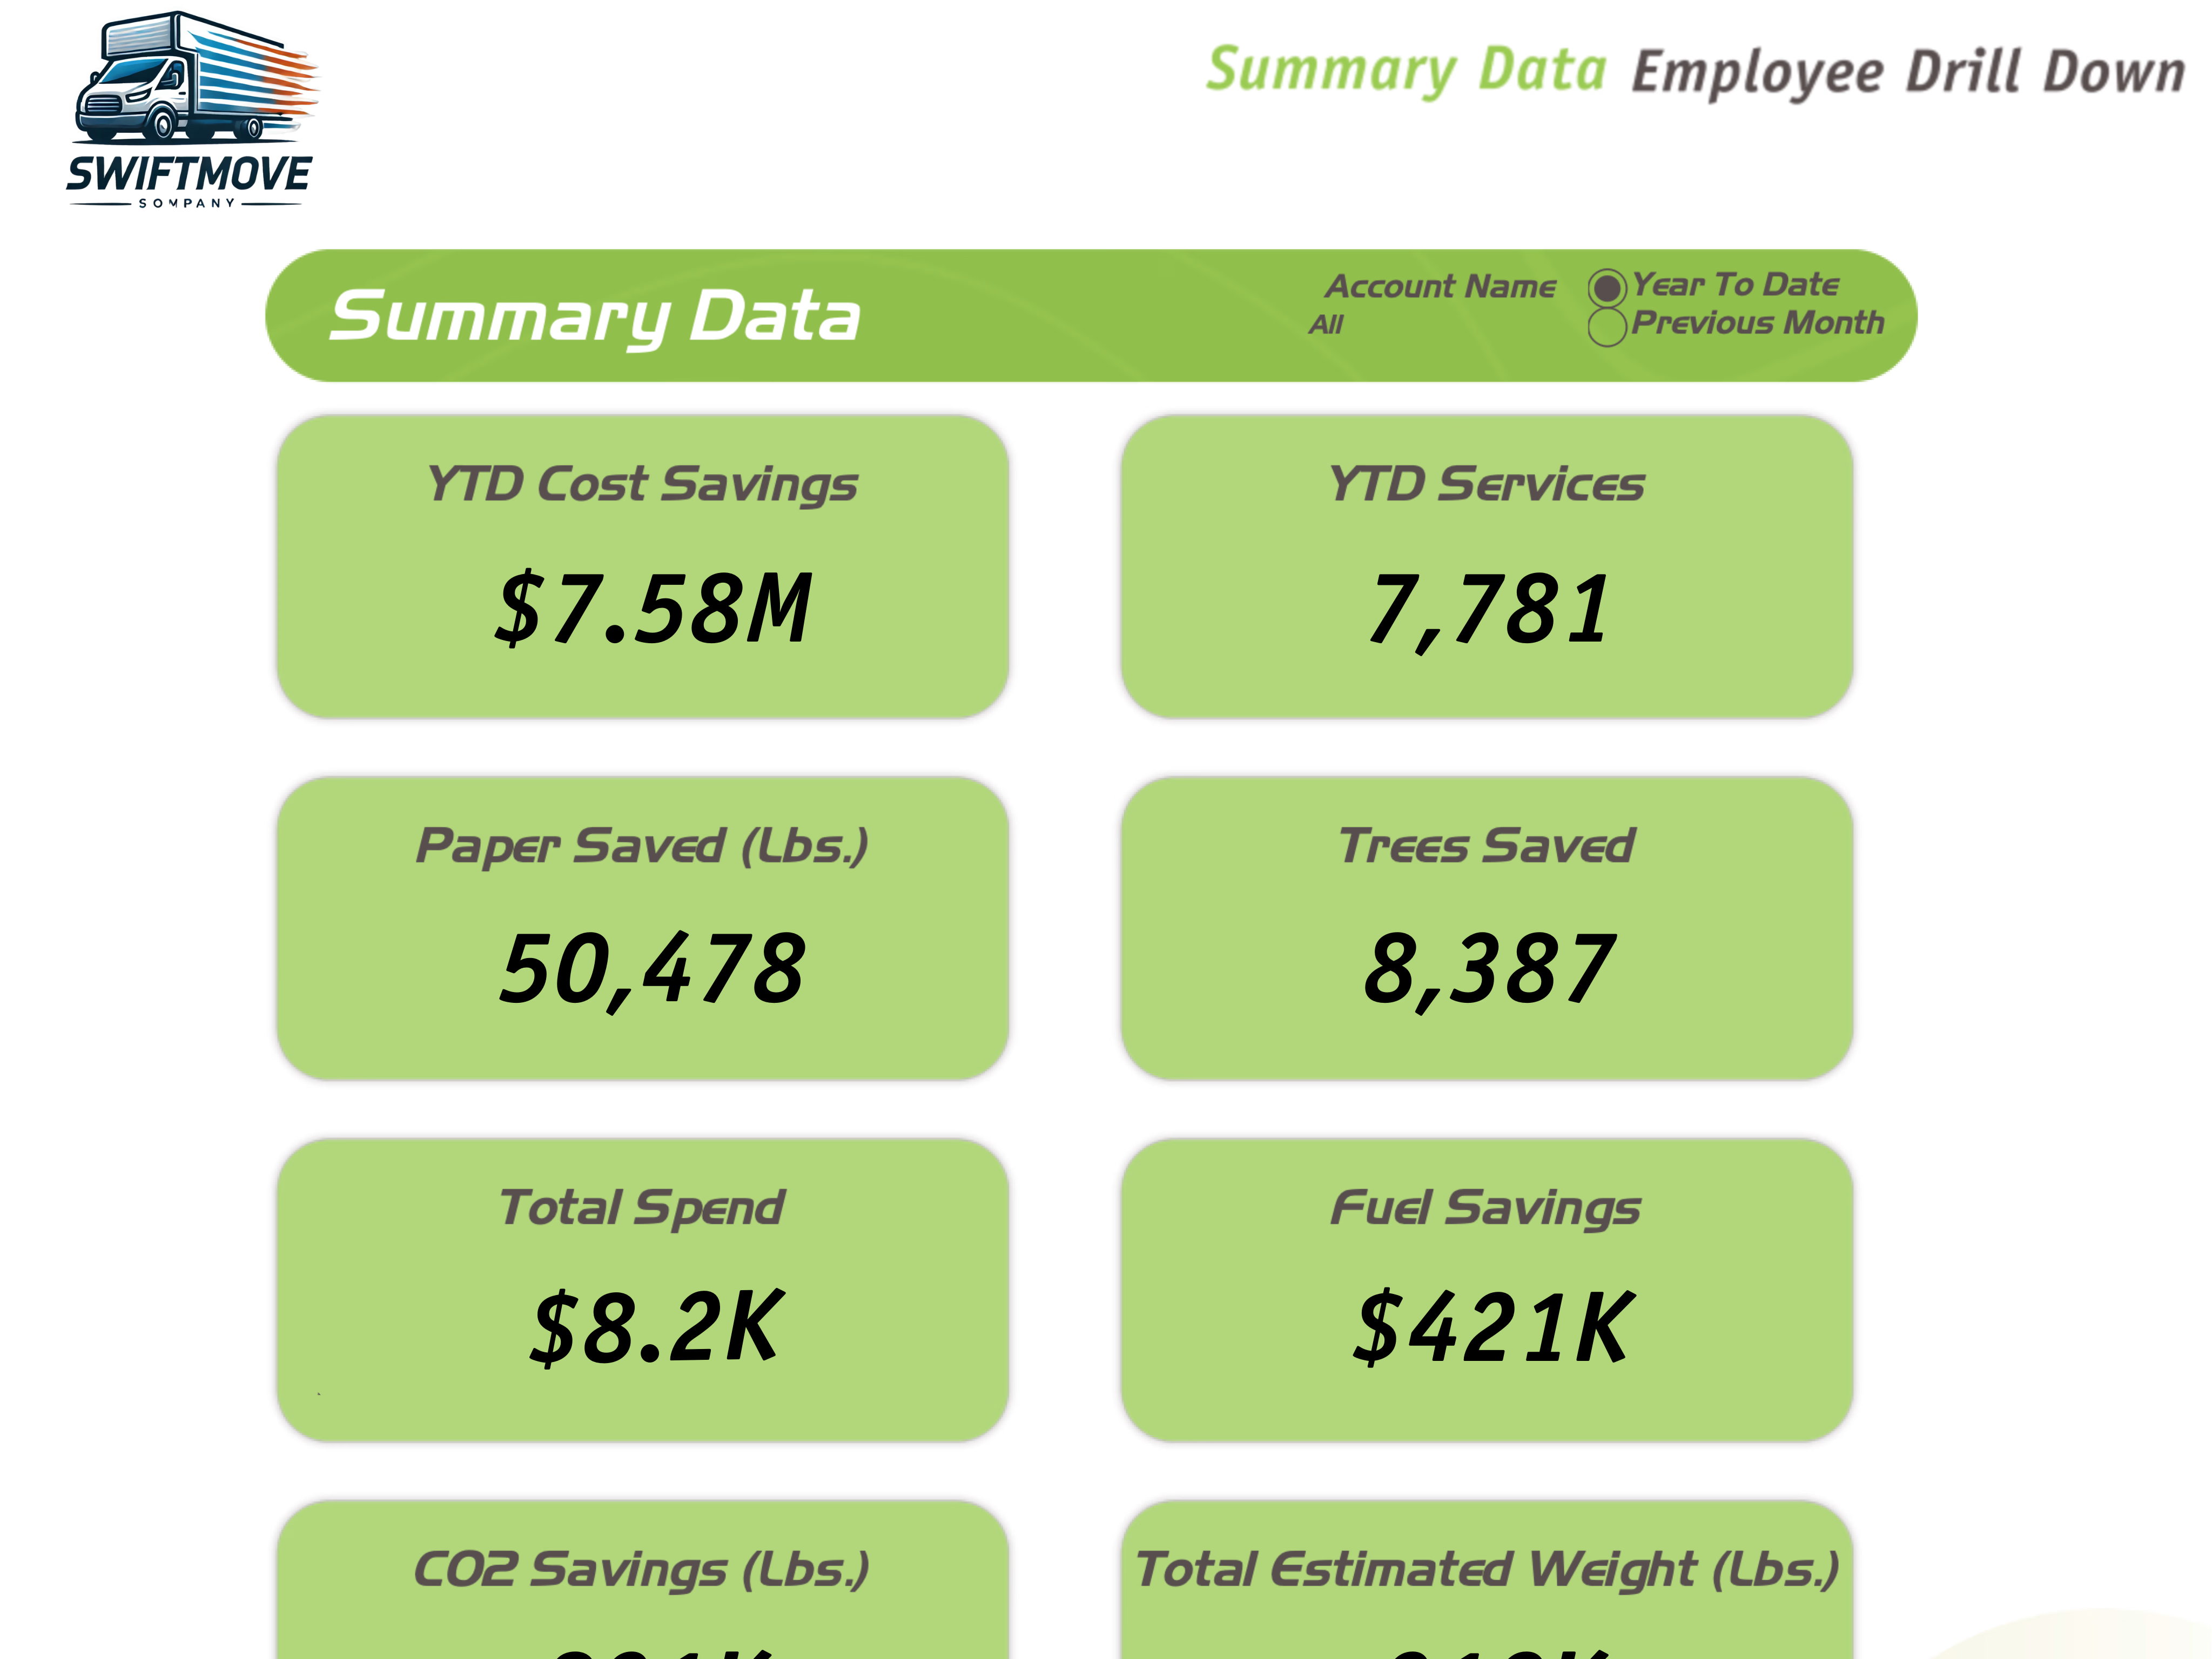
Carrier Optimization Engine, $293K Savings Model Built a Tableau optimization engine modeling carrier rate scenarios across 28 shipping lanes to identify validated cost-saving opportunities. The analysis found $293,482 in annual savings, an 18.6% cost reduction, and $58.70 potential savings per shipment by comparing current rates, proposed rates, and savings by carrier. The dashboard also surfaced the highest-value optimization lanes, with the South region representing $71K in opportunity and lane-level savings ranging from 18–20% across multiple carriers.
1
61
Data Analyst
(5)
Follow
Message
Mo Rahman
New York, USA
A/B Testing Statistician for SaaS & E-commerce Teams
12
Followers
Follow
Message
A/B Testing Statistician for SaaS & E-commerce Teams
0
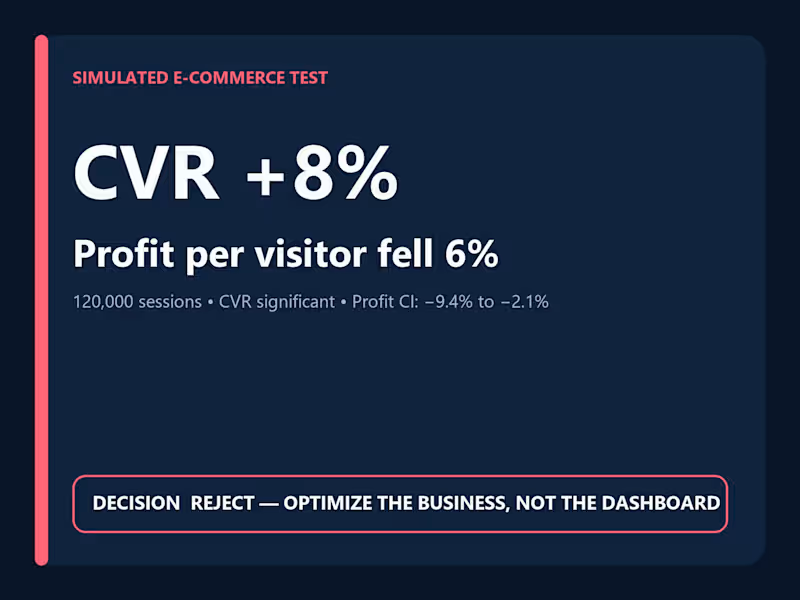
CVR Rose 8%, but Profit per Visitor Fell 6%
0
12
0
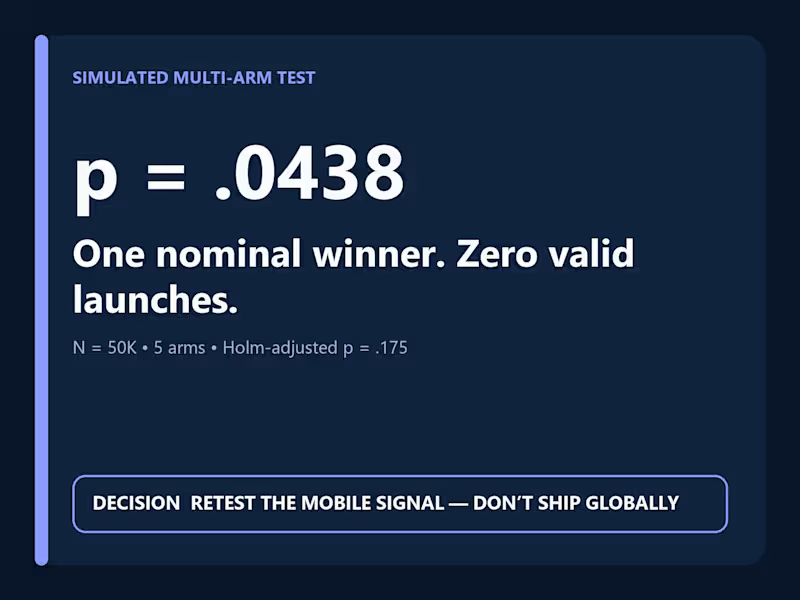
Five Arms, One Nominal Winner, Zero Valid Launches
0
8
0
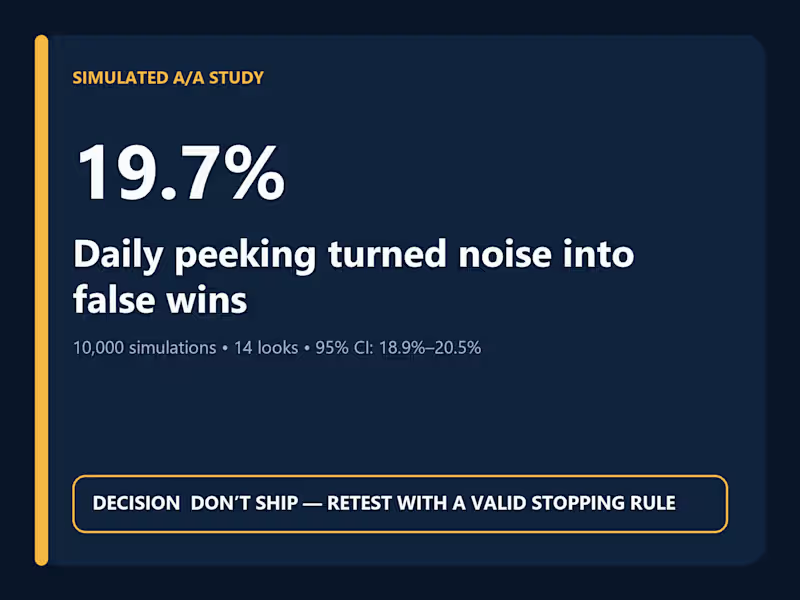
Daily Peeking Turned Noise Into a 19.7% False-Win Rate
0
13
0
Queens Price Prediction: Random Forest Cut RMSE by $6.5K
0
19
Data Analyst
(8)
Follow
Message
Explore people