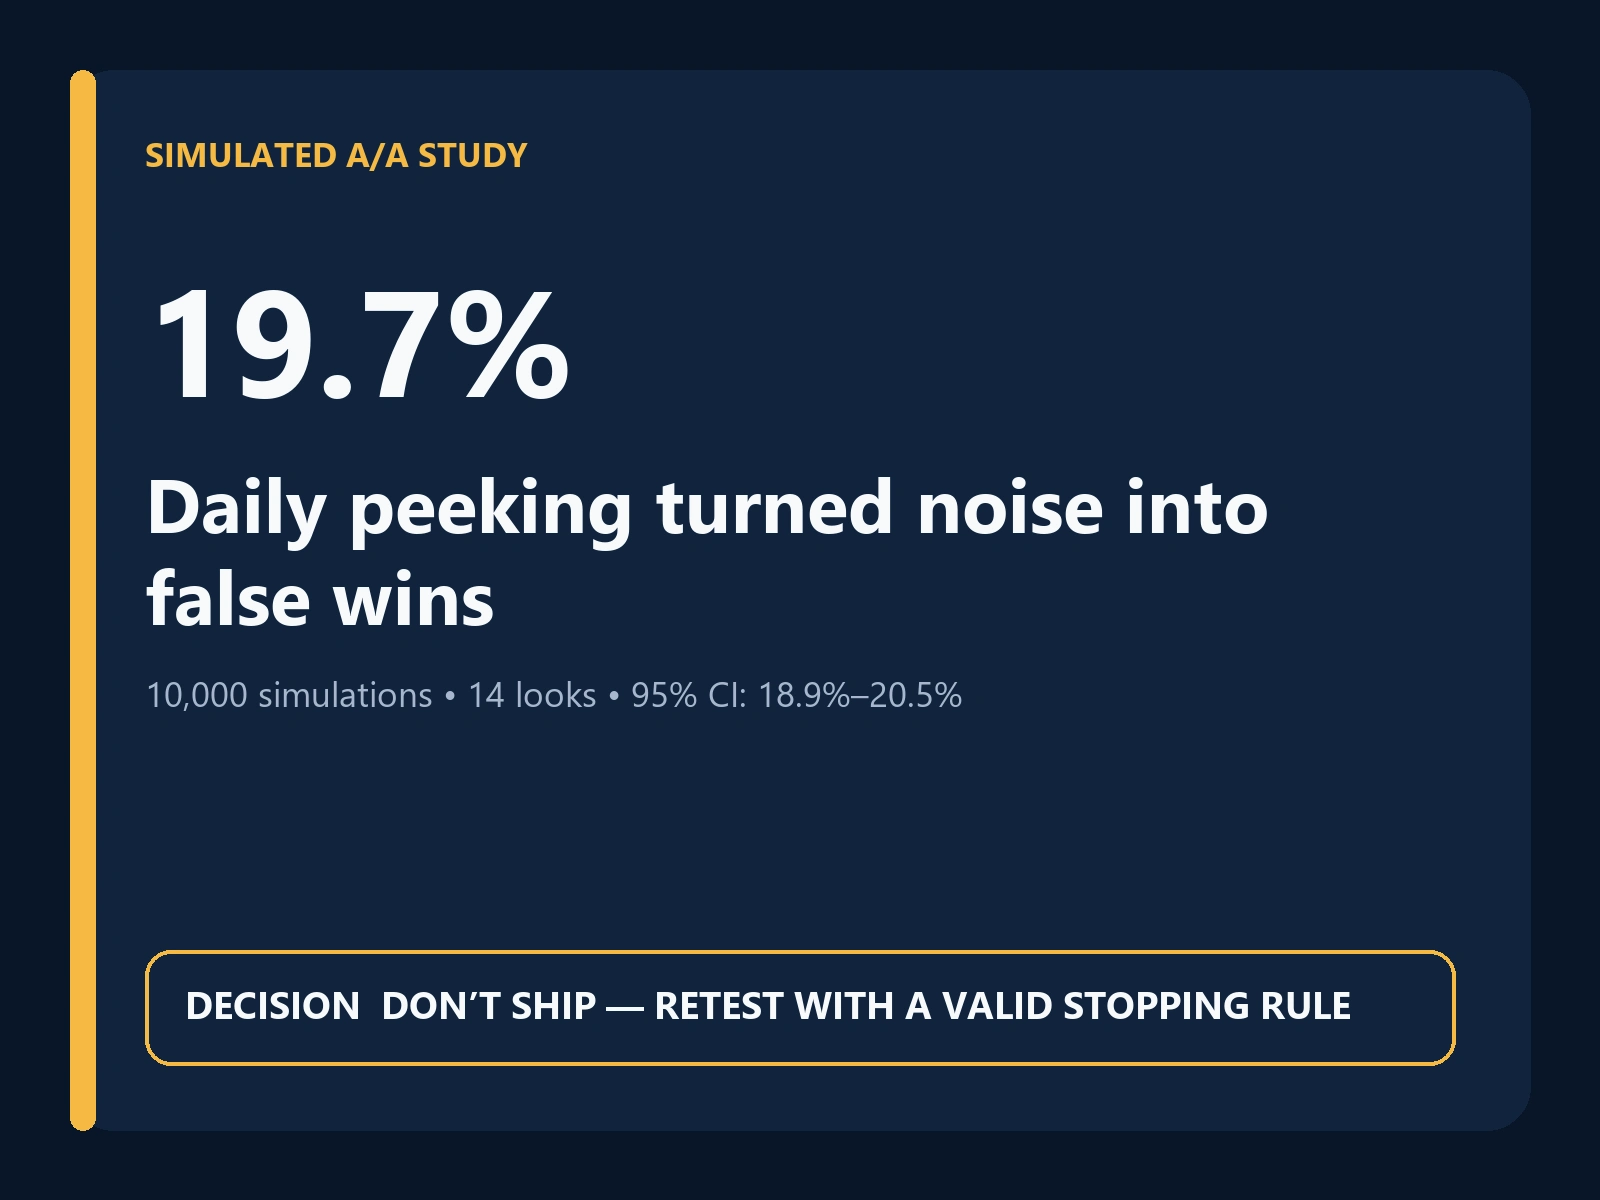
Daily Peeking Turned Noise Into a 19.7% False-Win Rate

Mo Rahman

SIMULATED / SAMPLE ANALYSIS — no client data
Hypothesis
When there is no true treatment effect, a correctly controlled test at α = 0.05 should declare a winner about 5% of the time.
Sample & method
I simulated 10,000 A/A experiments with a planned maximum of 20,000 users per experiment (10,000 per arm). Each experiment was checked once per day for 14 days and stopped as soon as p < .05. I also modeled an illustrative launch guardrail with 10,000 users per arm.
Evidence
• False-positive rate with daily peeking: 19.7%, versus the nominal 5.0%.
• Monte Carlo 95% Wilson interval: 18.9%–20.5%.
• Inflation versus the nominal error rate: 3.94×.
• Illustrative unsubscribe guardrail: 0.4% → 0.8%; absolute change +0.40 pp, 95% CI +0.19 to +0.61 pp.
Uncertainty
The Monte Carlo interval quantifies simulation error, not every possible testing workflow. The 19.7% result applies to this specific 14-look stopping rule and traffic model. The unsubscribe result is illustrative, not client data.
Business decision
DON’T SHIP. The apparent win is compatible with optional stopping, and the guardrail moves in the wrong direction. Retest with a fixed horizon or always-valid sequential method, predefine the primary metric and stopping rule, and keep unsubscribe rate as a launch blocker.
Like this project
Posted Aug 28, 2026
Simulated A/A study: 10,000 runs, 14 daily looks, 19.7% false wins (95% CI 18.9%–20.5%). Decision: don’t ship; retest correctly.
Likes
0
Views
12