Data visualization engineer, Data Analyst, BI Expert
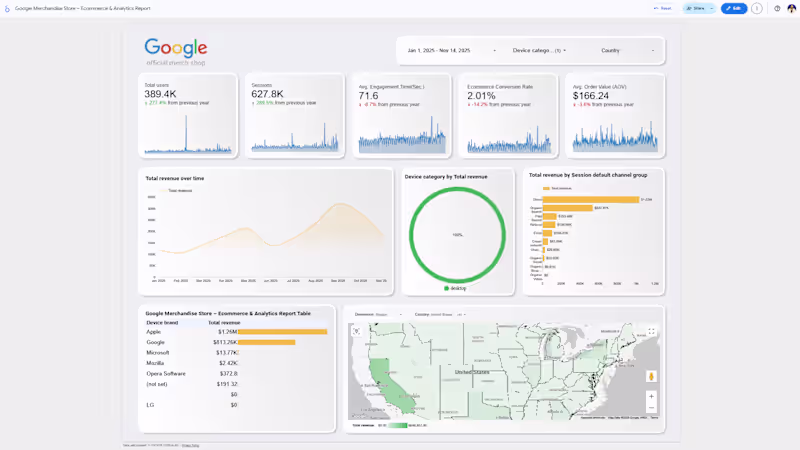
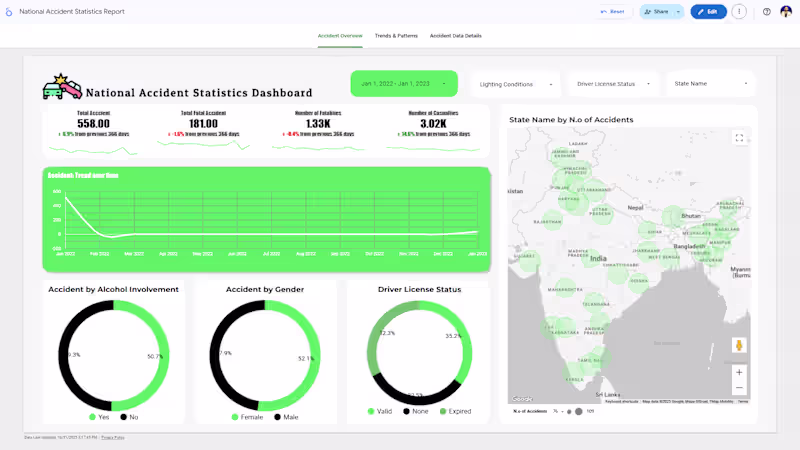
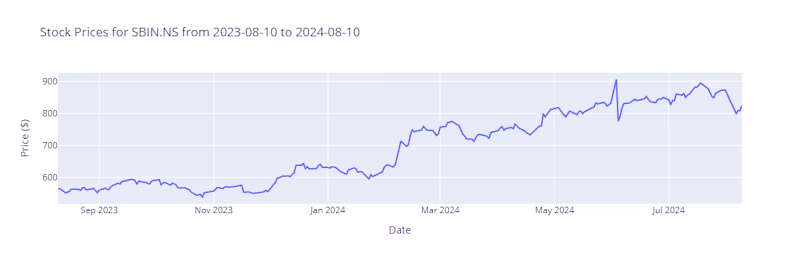
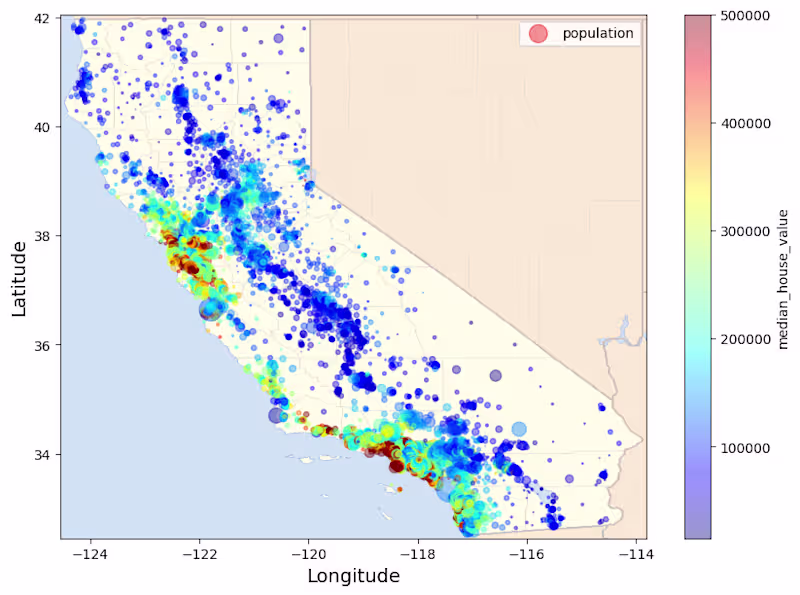
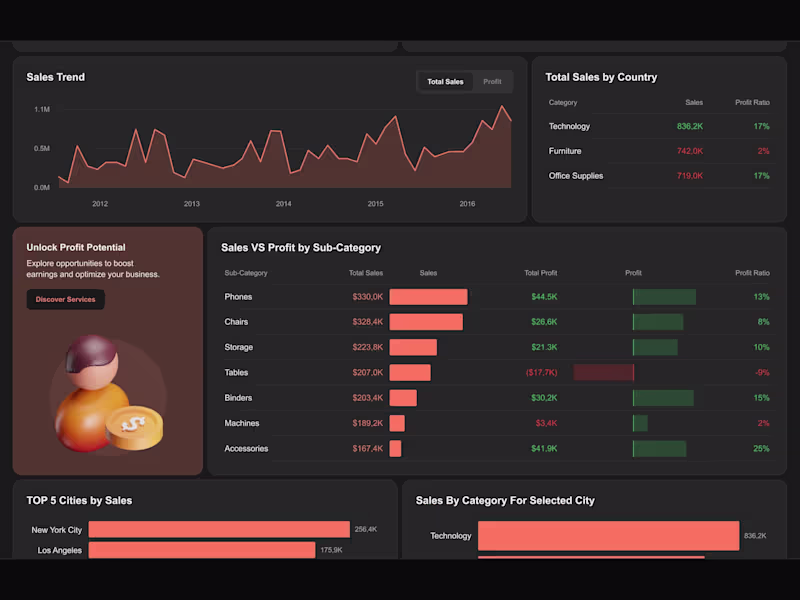
Expert Data Visualization with Tableau & Matplotlib
Expert Data Visualization with Tableau & Matplotlib

View more →
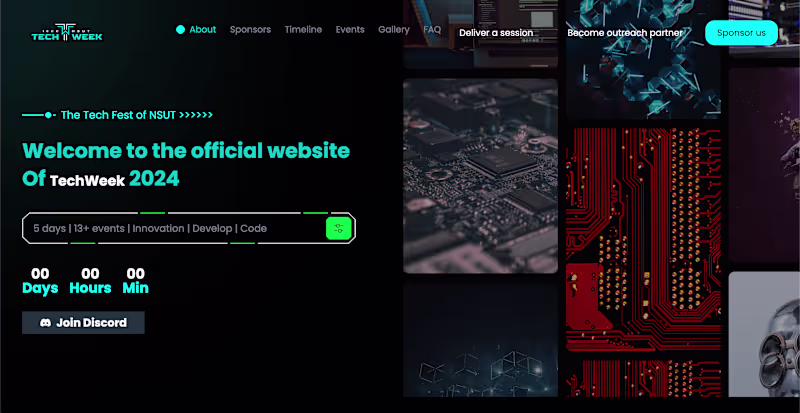
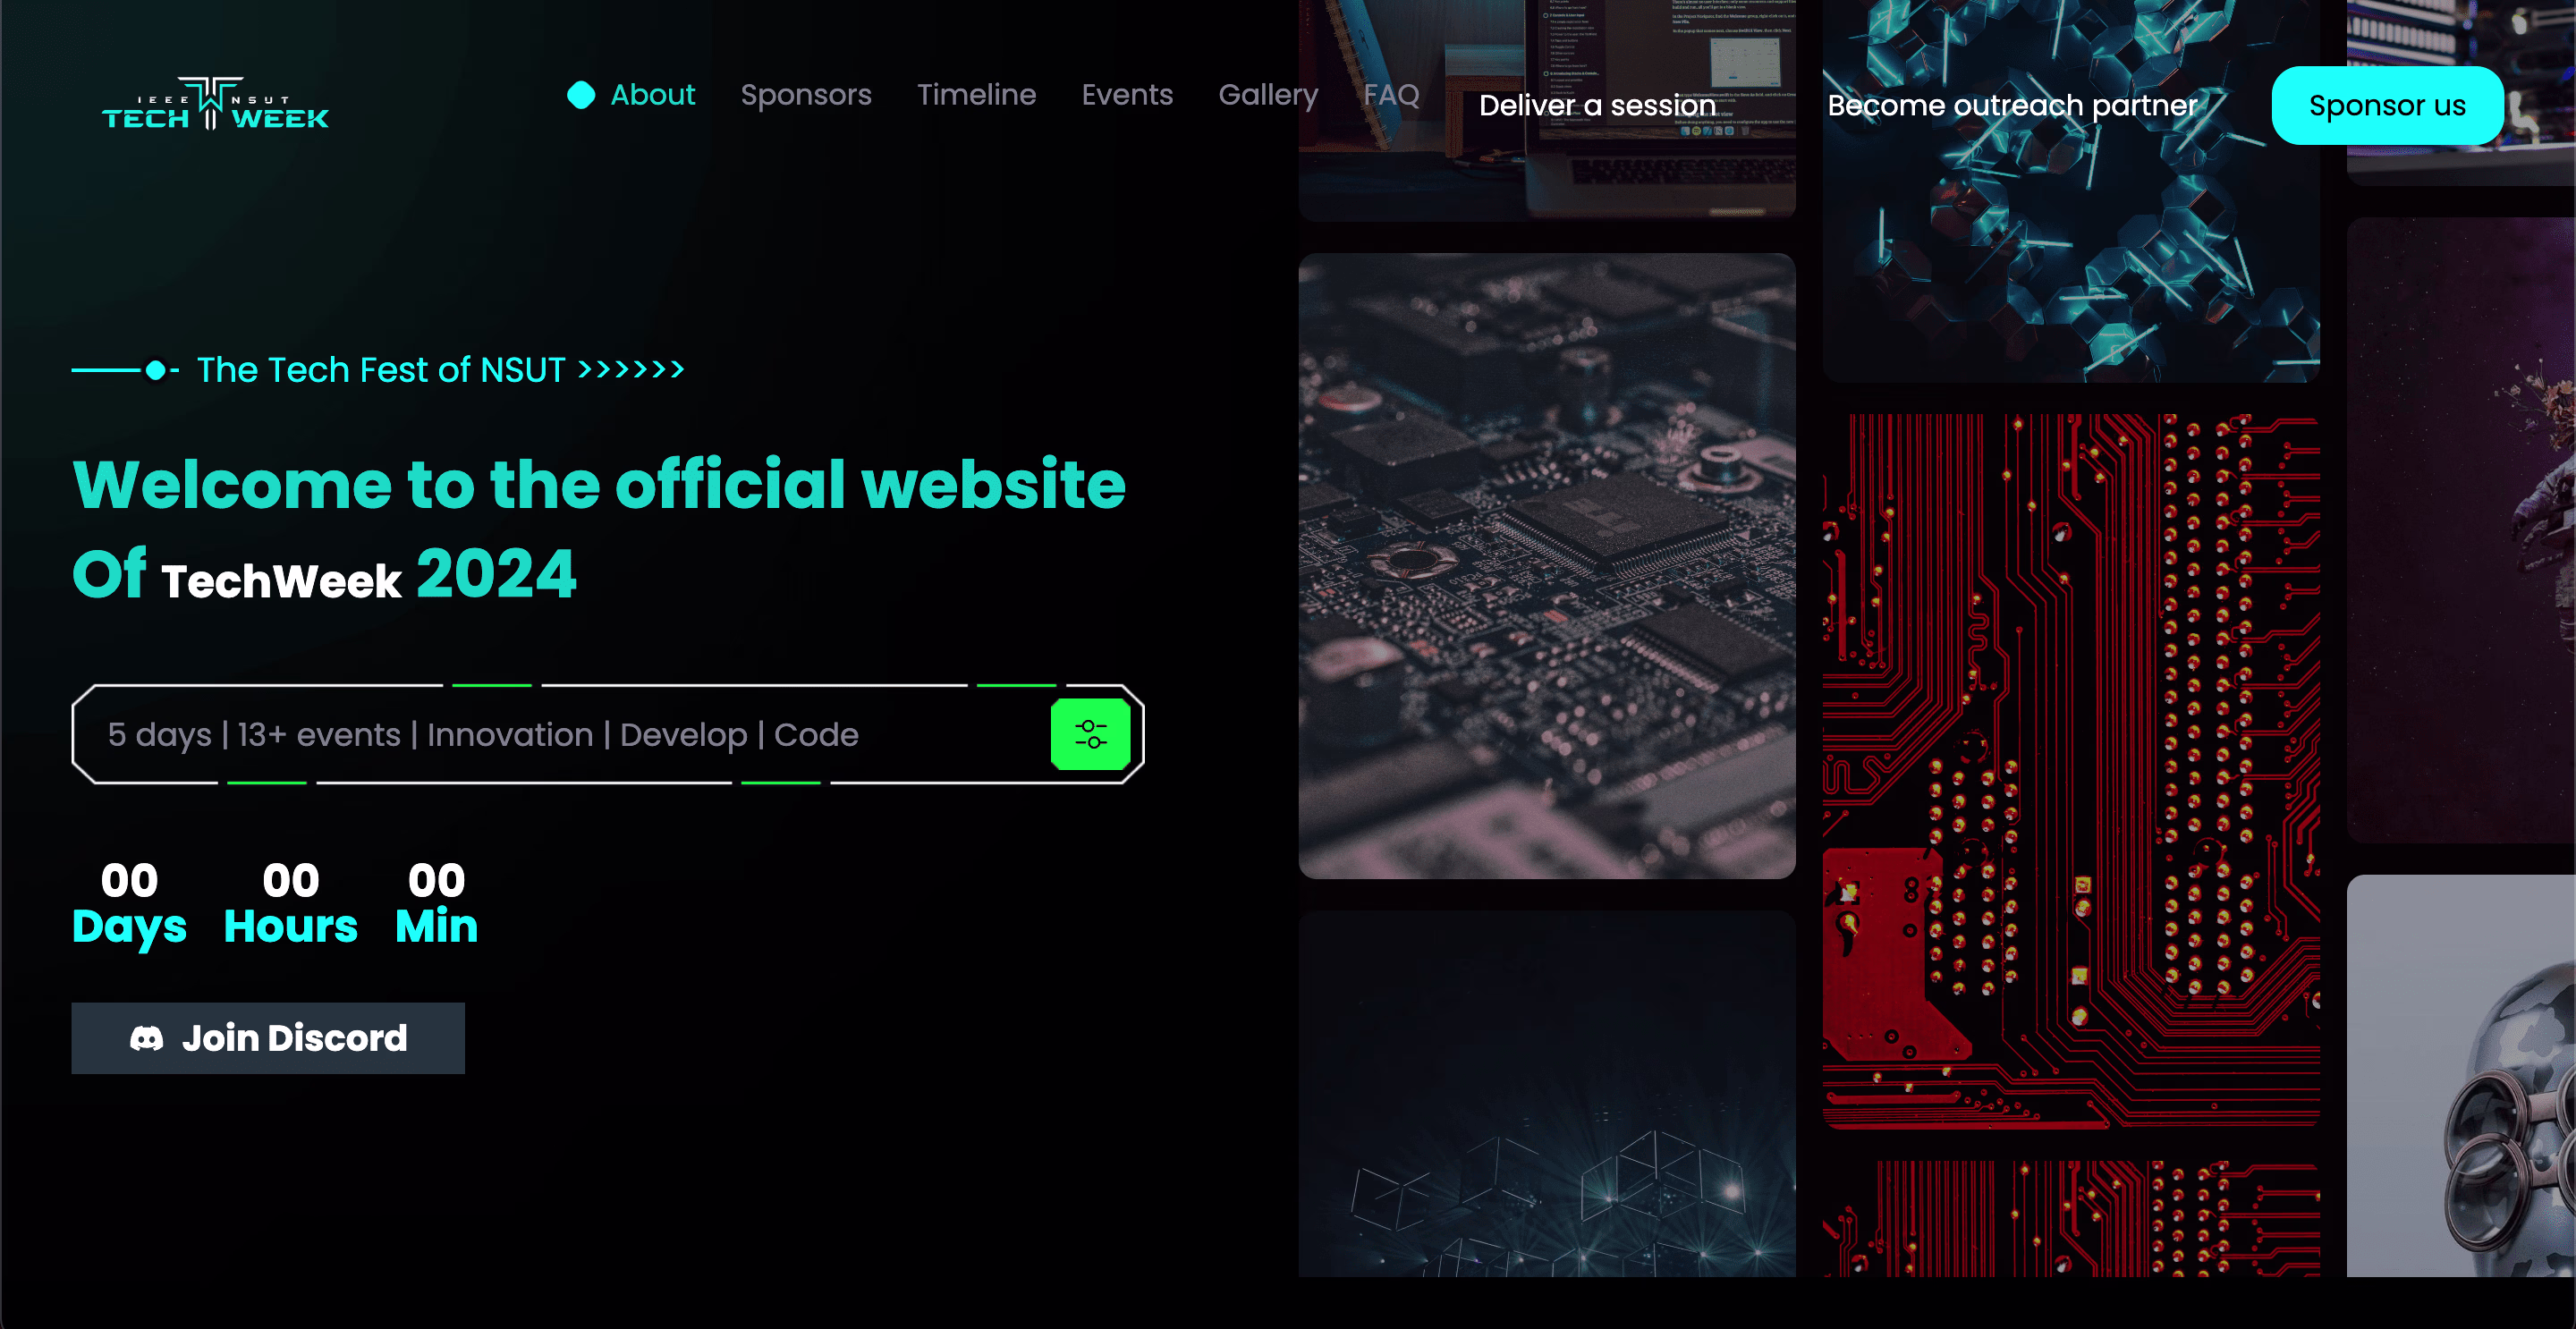
Web, Android & iOS Dev | UI/UX Expert
Web, Android & iOS Dev | UI/UX Expert

View more →
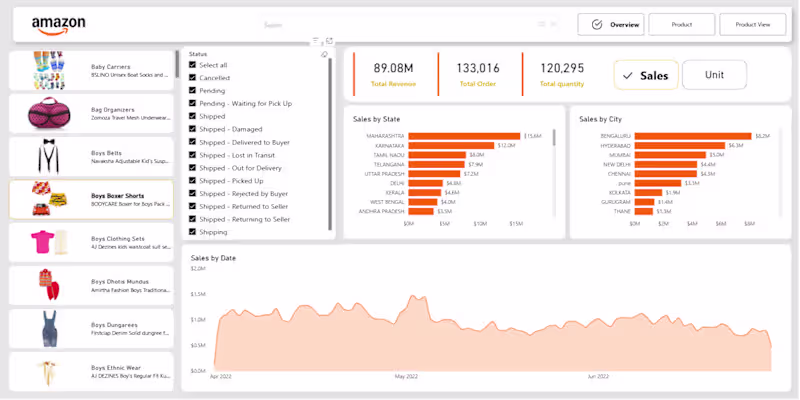
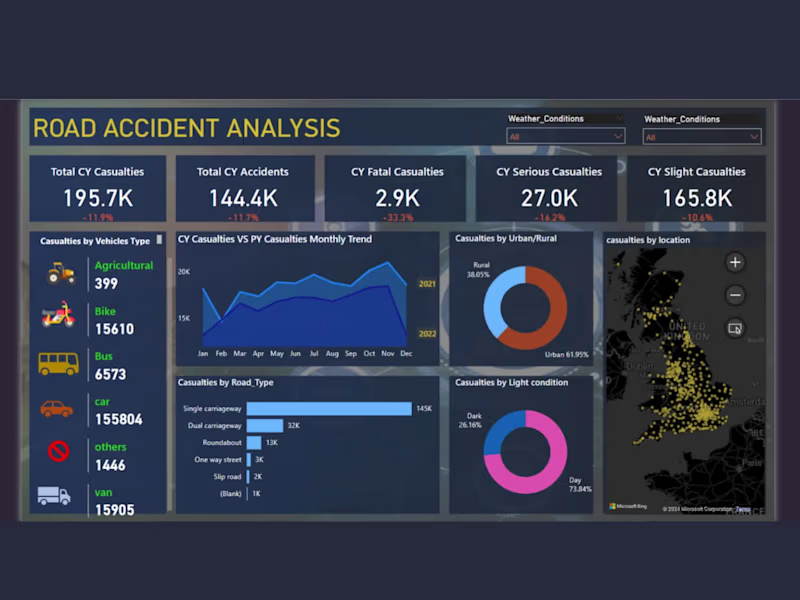
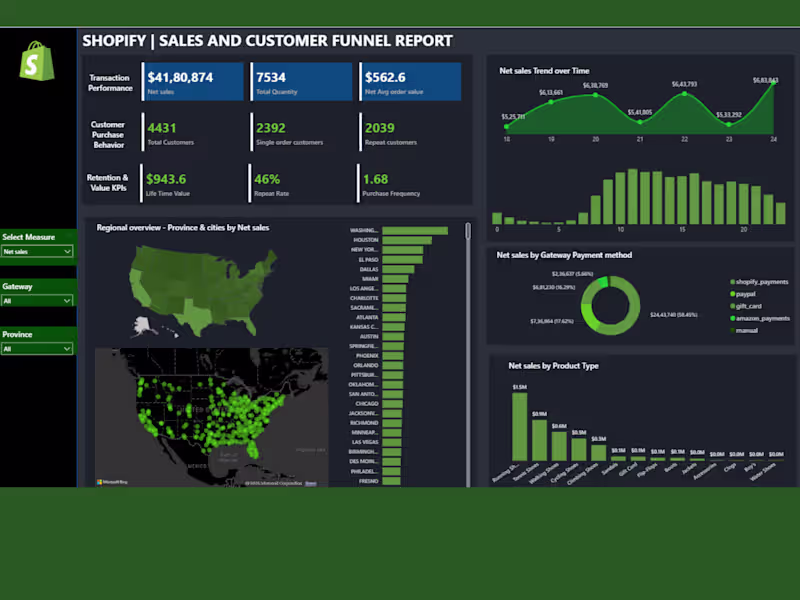
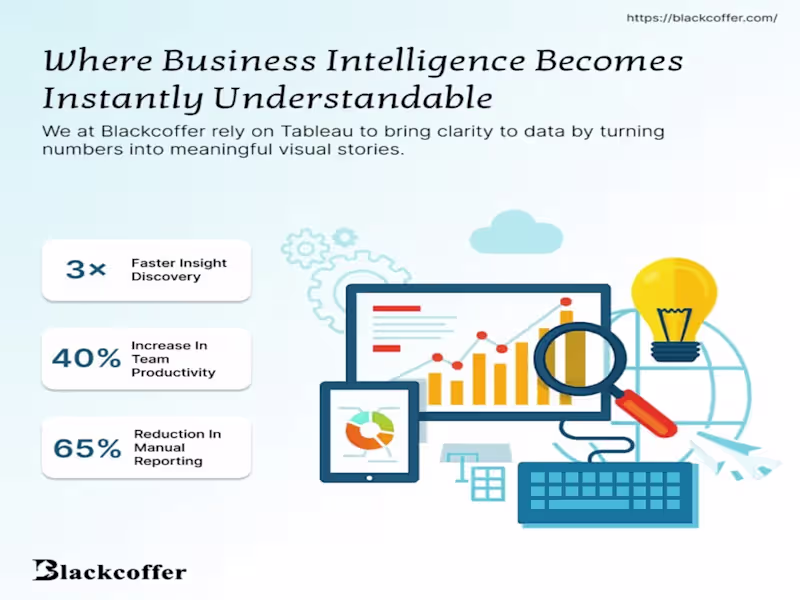
Business Intelligence Specialist | Power BI & Excel Expert
Business Intelligence Specialist | Power BI & Excel Expert

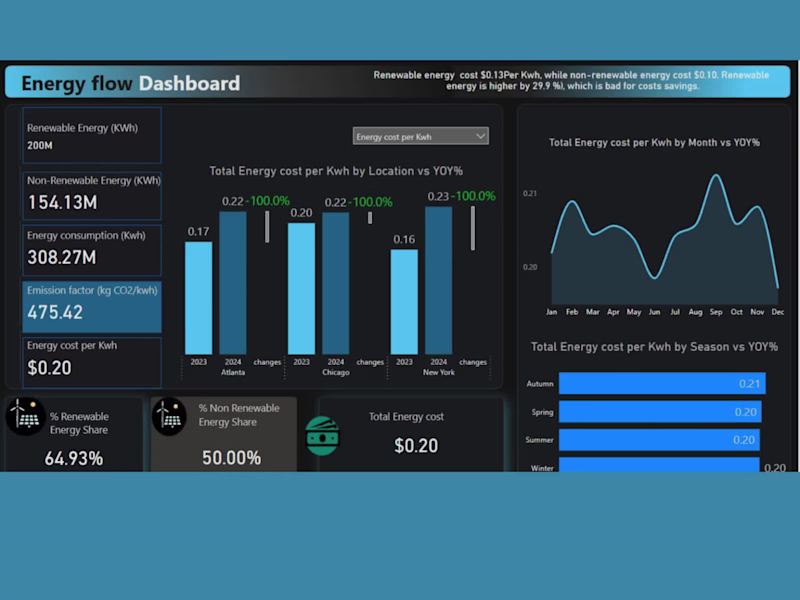
Data Analyst & Visualizer | Power BI, Excel, VBA
Data Analyst & Visualizer | Power BI, Excel, VBA

Chartered Accountant | IFRS, US GAAP | Data Analyst 📊
Chartered Accountant | IFRS, US GAAP | Data Analyst 📊


View more →
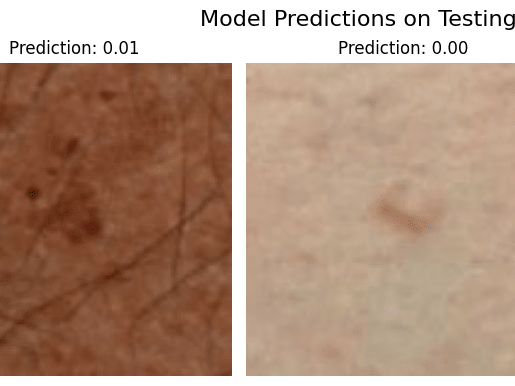
Build production-ready AI applications with Machine Learning
- 12
- Followers
Build production-ready AI applications with Machine Learning


Data Analyst | SQL & Power BI Specialist