Freelance AI Developers in Mumbai
Sign Up
Post a job
Sign Up
Log In
Filters
2
Projects
People
Shezaan Ansari
pro
Mumbai, India
AI Video Producer | Brand Designer
$10k+
Earned
18x
Hired
5.0
Rating
249
Followers
expert
Expert
+4
Follow
Message
AI Video Producer | Brand Designer
2
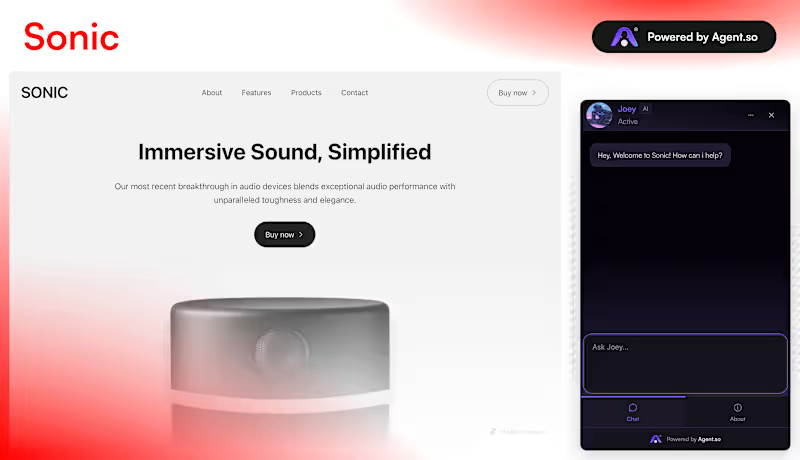
AI Assistant Development for Sonic
2
23
2
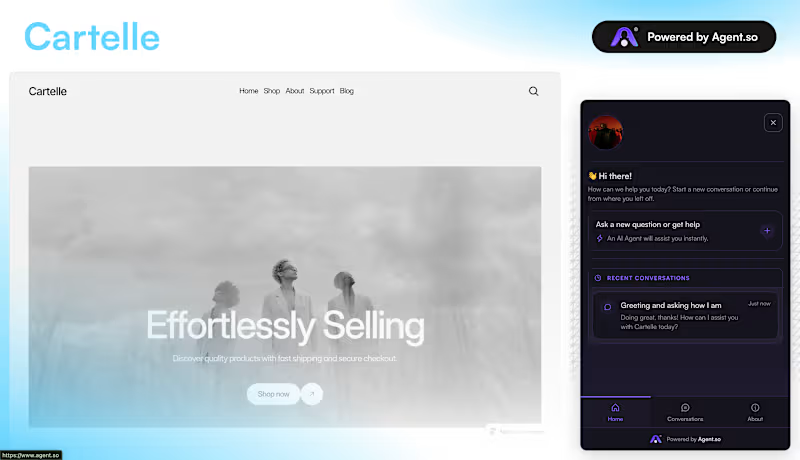
Support AI Agent for Cartelle
2
18
1
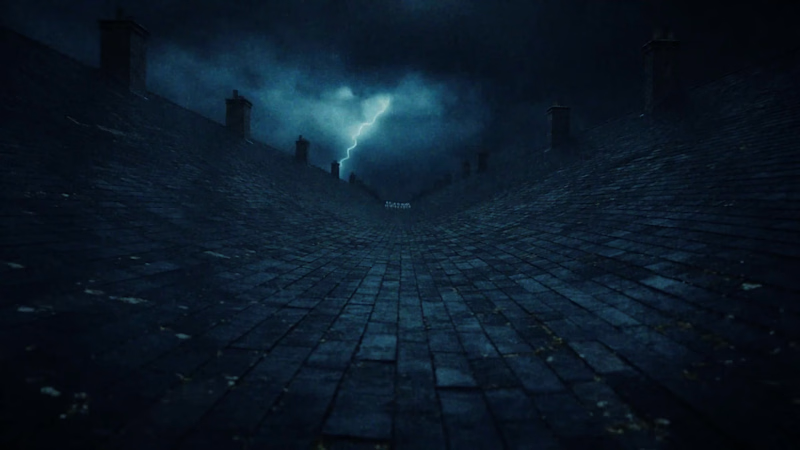
The Foundry — AXIOM ONE (15s spec spot) New spec drop: a cinematic launch film for a product I invented specifically to direct against — AXIOM ONE, a precision-milled titanium earbud. Process notes for anyone building in AI video: One 15s generation, but directed like a real spot: a locked global style prefix (cinematic / Kodak film emulation), a written product spec repeated verbatim, and three engineered cuts inside a single prompt. Continuity across the wider anthology comes from reference stills generated first, then fed into every video generation — the product never drifts. The "hyper-motion" feel is written as in-camera language: high-frame-rate capture, mixed shutter, engineered speed ramps — not "make it fast." This is Film II of four. Same product, four completely different stories, one visual DNA. Open for cinematic AI ad work — launch films, brand spots, product cinema.
1
32
4
MAHABHARATA — FROZEN MOMENTS. The epic's four turning points, suspended mid-instant in bronze: the dice throw, the unending sari, the charge at Kurukshetra, the bed of arrows. The reference format is frozen-time tableaux — 26 seconds, only 3 cuts, the world stopped at 2% speed while a single camera orbits through each moment with an ease-out. I reverse-engineered its grade before shooting anything: bronze-gold chiaroscuro, warm blacks, average frame brightness under 20% — one light source carving figures out of darkness. The build inverts normal production: • The keyframe is the film — each still sculpted in Nano Banana Pro until the frozen moment is perfect, suspension baked in (dice mid-air, shards mid-shatter, embers hanging) • Seedance 2.0 animates only the camera: one 360° orbit per 6-second shot, deceleration prompted in, landing on a named final frame • Four shots, soft dissolves, one continuous score — zero hard cuts • Reference screenshots fed as style conditioning so the cast-bronze material never drifts between shots Third entry in my Mahabharata series (after Suryaputra and The Bones). This is the pipeline I bring to launch and brand films — if you're building something that deserves mythology-grade imagery, Let's Talk!
4
262
AI Developer
(2)
Follow
Message
Anurag Nagare
Mumbai, India
I’m an AI & Machine Learning engineer with expertise in deve
Follow
Message
I’m an AI & Machine Learning engineer with expertise in deve
0
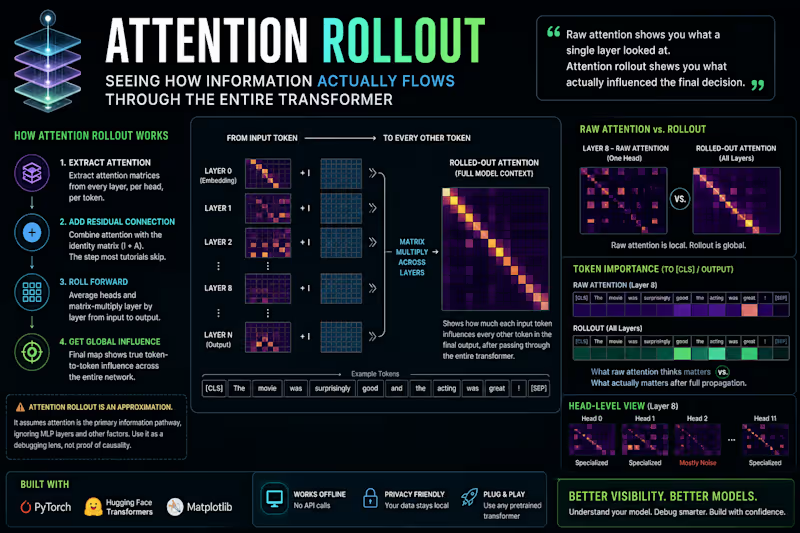
What your attention heatmap isn't telling you Everyone's staring at attention heatmaps and calling it "interpretability." Almost nobody's asking whether a single attention map actually tells you what the model used to make its decision. It doesn't. Not on its own. A raw attention map from layer 8 shows you what layer 8 attended to. It says nothing about how that signal got mixed, diluted, or overwritten by every layer before and after it. Attention rollout fixes this — and I built a walkthrough to show why it matters. Here's what makes it more than a "pretty heatmap" demo: Instead of visualizing one layer's attention, I traced how information actually flows through the full transformer stack. → Every layer's attention matrix is extracted, per head, per token → Multi-head attention is averaged, then combined with the residual connection (identity + attention) — this is the step most tutorials skip, and it's the one that actually matters → The combined matrices are matrix-multiplied layer by layer, rolling attention forward from input to output → The result: a single map showing genuine token-to-token influence across the entire network, not just one layer's snapshot The overlay shows you everything: → Per-layer attention vs. rolled-out attention, side by side → Token importance scores overlaid directly on the input text → A comparison view: which tokens raw attention says "matter" vs. which ones rollout says actually matter → Head-level breakdown so you can see which heads specialize vs. which are noise No black box. No "trust me, the model looked here." Just linear algebra, applied honestly across every layer instead of cherry-picking one. Built with PyTorch + HuggingFace Transformers + Matplotlib. Runs on any pretrained transformer, fully offline. ⚠️ Important: attention rollout is an approximation, not ground truth. It assumes attention is the primary information pathway, which ignores MLP layers and can still mislead for very deep models. Treat it as a debugging lens, not proof of causality.
0
30
1
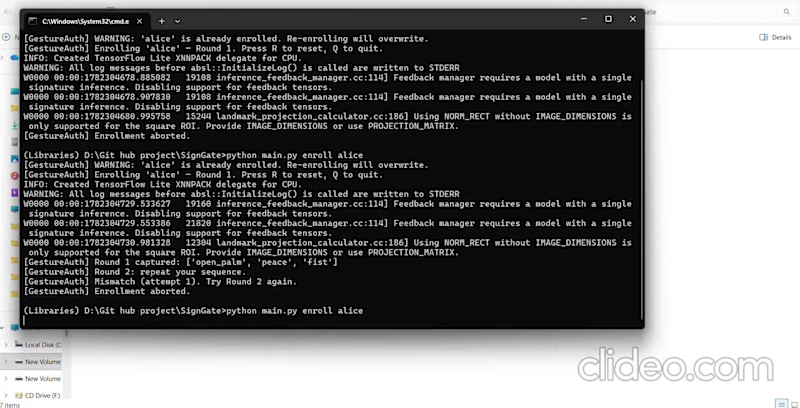
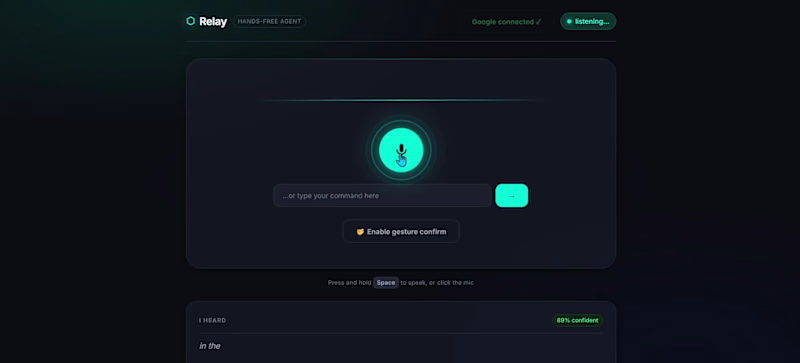
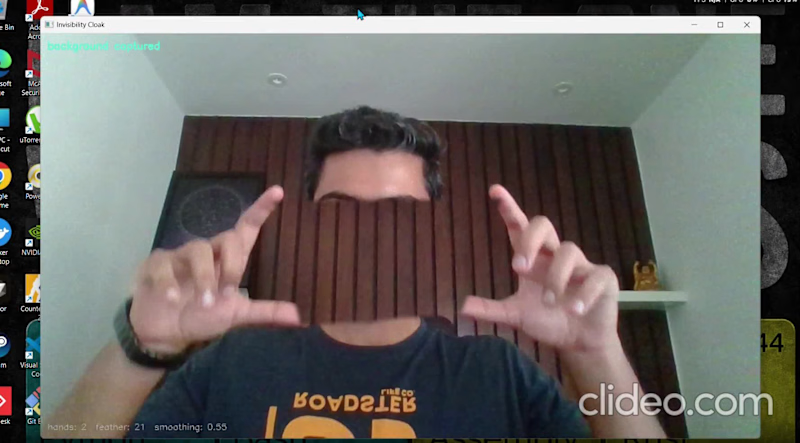
Everyone's racing to add biometrics to logins. Almost nobody's asking what happens when you can't — or shouldn't — touch the sensor. Shared kiosks, clinical settings, accessibility needs, hygiene-sensitive environments. Fingerprint readers and face unlock assume contact or a stored faceprint. Sometimes you want authentication that touches nothing and stores no biometric image of you at all. So I built GestureAuth — a contactless authentication system where your "password" is a sequence of hand gestures performed in front of a standard webcam.
1
28
0
Everyone's talking about AI in healthcare. Nobody's building low-cost tools for the people who actually need early answers. Neurologists are overbooked. Clinical tremor assessments require in-person visits, specialist equipment, and months of waiting. The 10 million people living with Parkinson's globally and the millions more who don't yet know have no accessible way to flag early symptoms from home. So I built TremorLens a real-time hand tremor detection tool that runs entirely on a standard webcam. Here's what makes it more than just a webcam project: Instead of simple motion detection, I built a full signal processing pipeline on top of computer vision. MediaPipe tracks 21 hand landmarks per frame. The index fingertip's x/y displacement is buffered across a 3-second rolling window. scipy FFT then decomposes that signal into its frequency components and flags dominant activity in the 4–6 Hz range clinically associated with Parkinson's resting tremors. The live overlay shows you everything: → Real-time FFT power spectrum with the tremor zone highlighted → Dominant frequency readout in Hz with a 10-frame rolling average for stability → Color-coded STABLE / TREMOR DETECTED indicator → Fingertip displacement graph and movement trail → Auto-saved CSV session log timestamp, frequency, amplitude, tremor flag every session
0
25
0
Everyone's talking about quantum computing. Nobody's using it to feed farmers. India loses 20–30% of its crop yield every year to diseases and pests. Not because farmers don't care — but because early detection is hard, expensive, and inaccessible to the people who need it most. The existing solutions? Either a basic image classifier trained on lab-perfect photos that fail in real field conditions, or an agronomist visit that costs time and money most small farmers don't have. So I built QuantumEdge AgriGuard — a hybrid Quantum Neural Network app where a farmer can photograph a diseased leaf on their phone and get an instant diagnosis in under 5 seconds. Here's what makes it different from just another plant disease detector: Instead of a pure classical CNN, I built a hybrid architecture — a ResNet/EfficientNet backbone extracts visual features, then passes them into a Variational Quantum Circuit (VQC) for the final classification. The quantum layer uses angle embedding + StronglyEntanglingLayers, which gives it a measurable edge on small, noisy datasets — exactly the kind of data you get from Indian field conditions. The app doesn't just tell you what disease it is. It gives you: → Confidence score → Organic + chemical remedies (India-specific) → Yield impact estimate → A live classical vs quantum accuracy comparison so you can see the difference yourself I tested the quantum advantage claim honestly — ran both models on the same downsampled PlantVillage dataset and tracked accuracy, F1-score, and inference time side by side. The results are on the dashboard. No hand-waving. Built with PennyLane + PyTorch + Plotly Dash. Designed to run on simulators today and on QpiAI-Indus 25-qubit hardware tomorrow.
1
0
50
AI Developer
(8)
Follow
Message
Bhavya Shah
Mumbai, India
Tech solutions with a product-first approach.
Follow
Message
Tech solutions with a product-first approach.
0
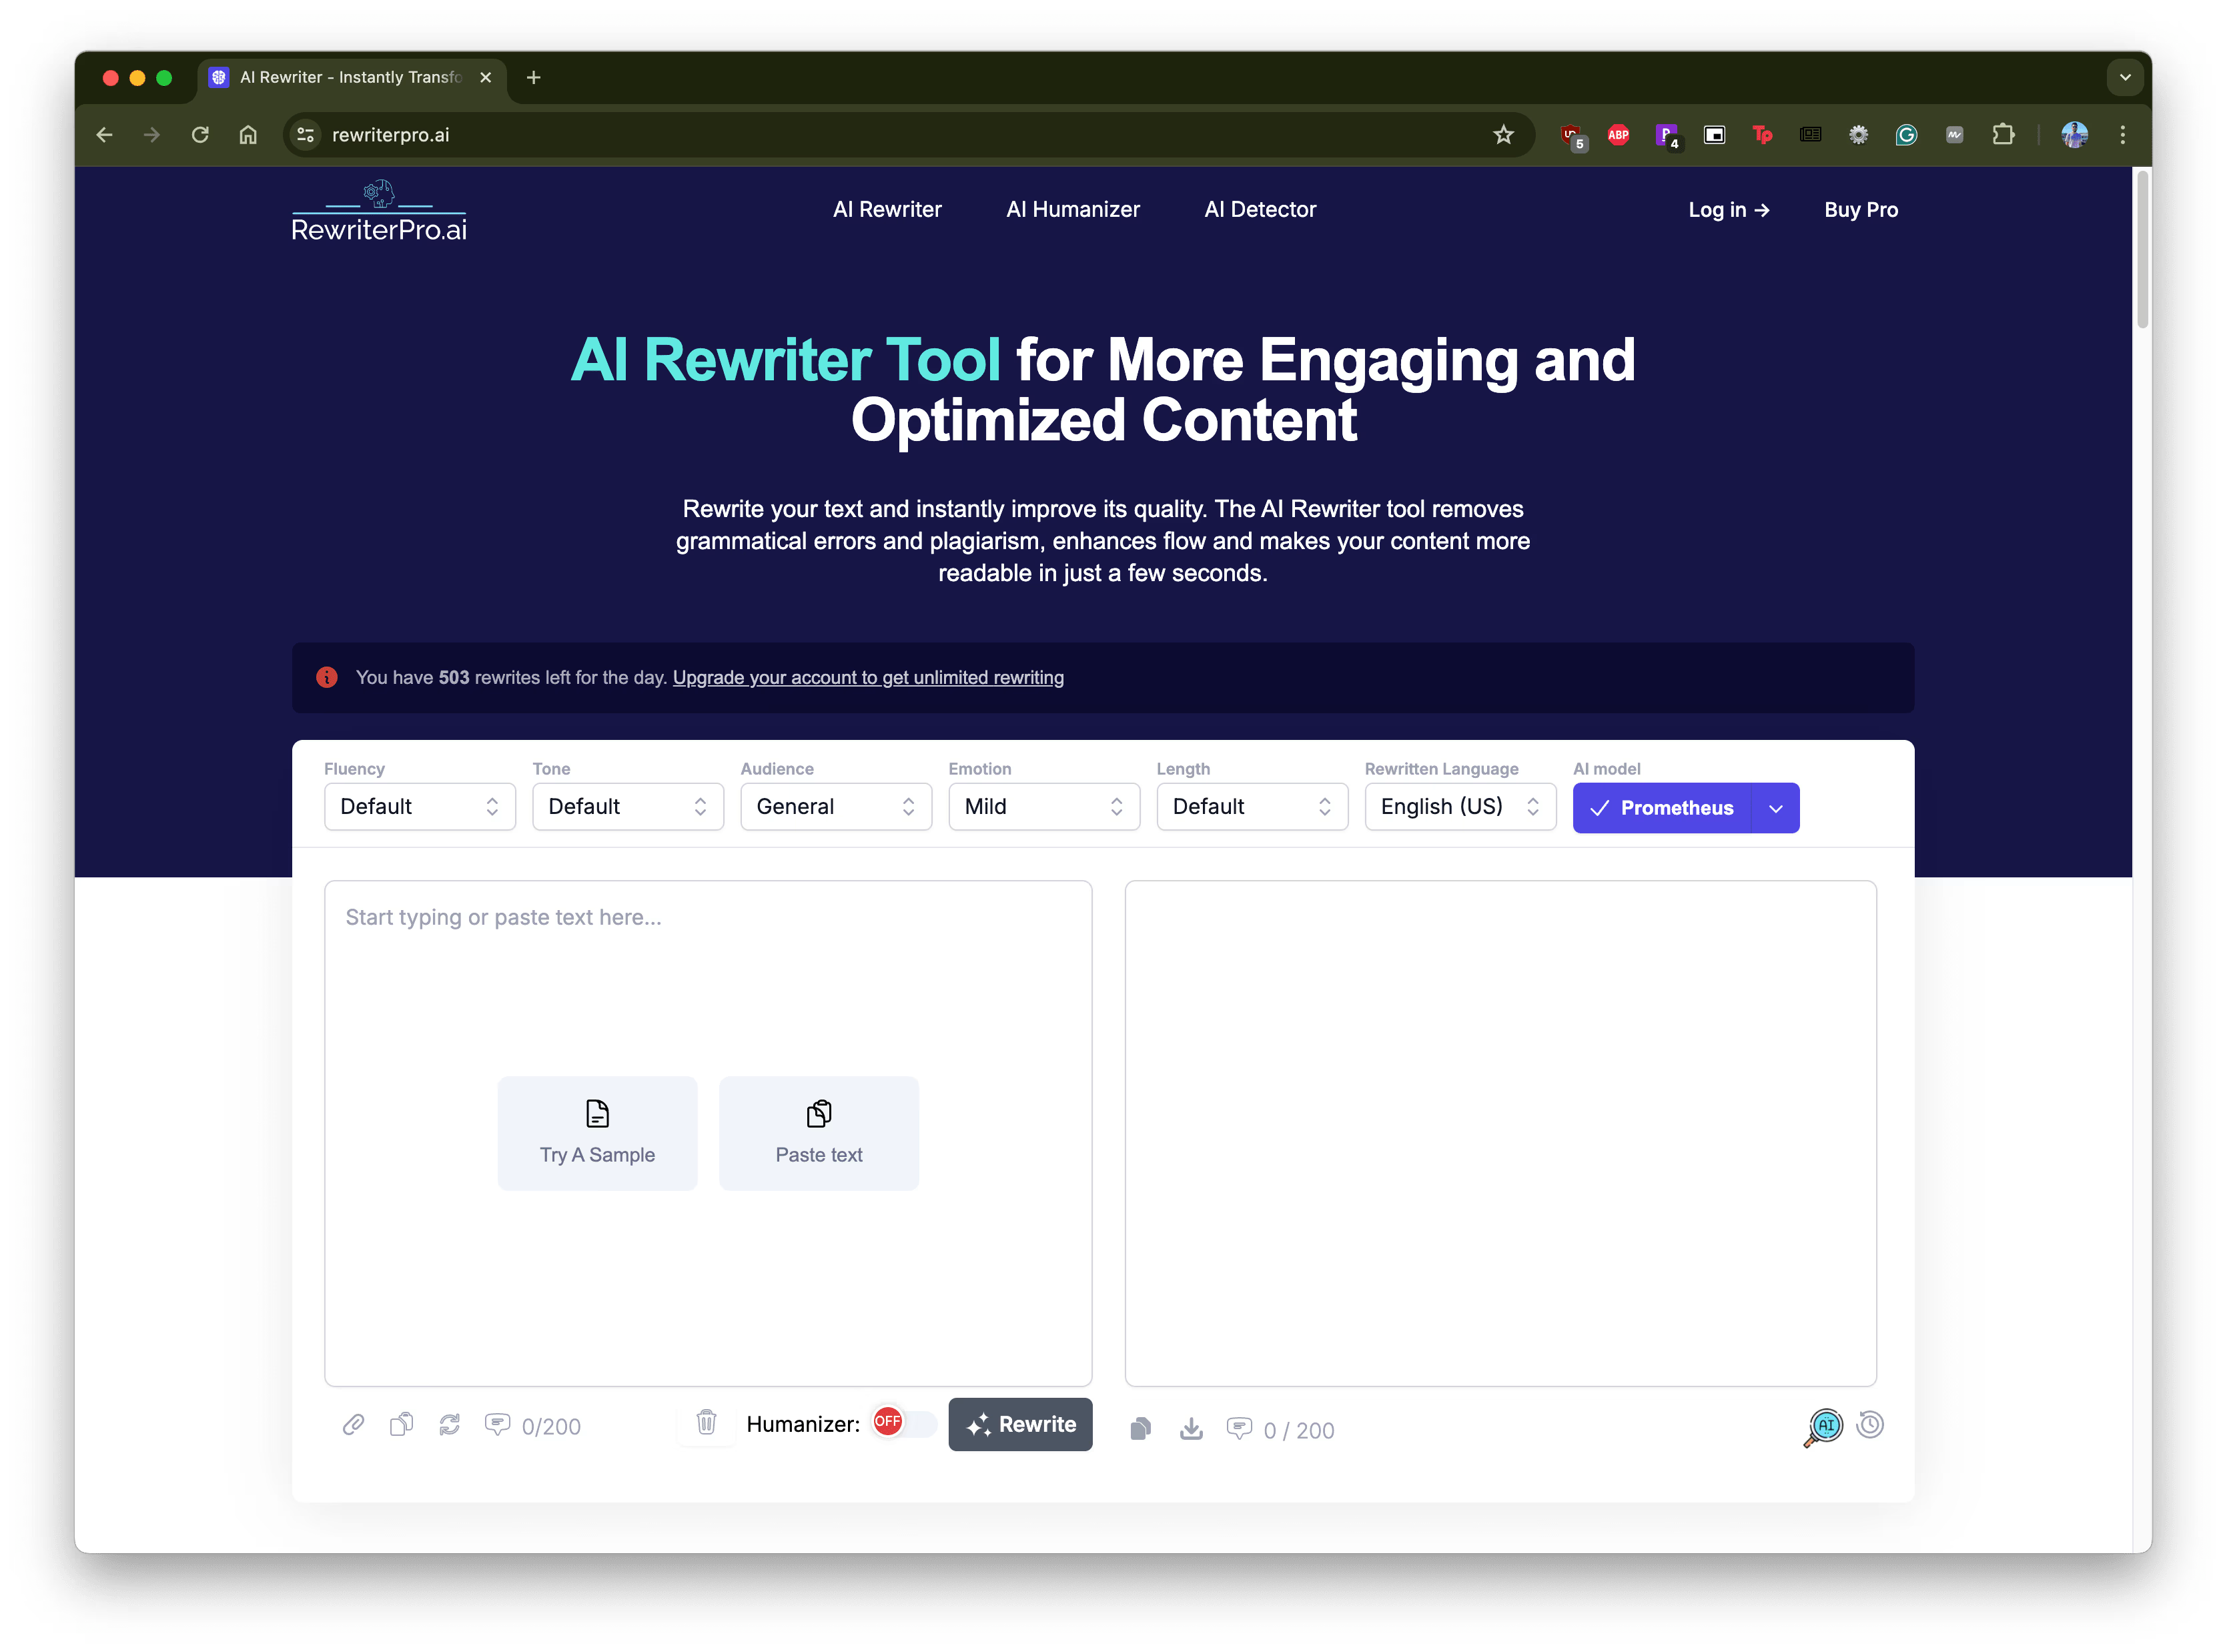
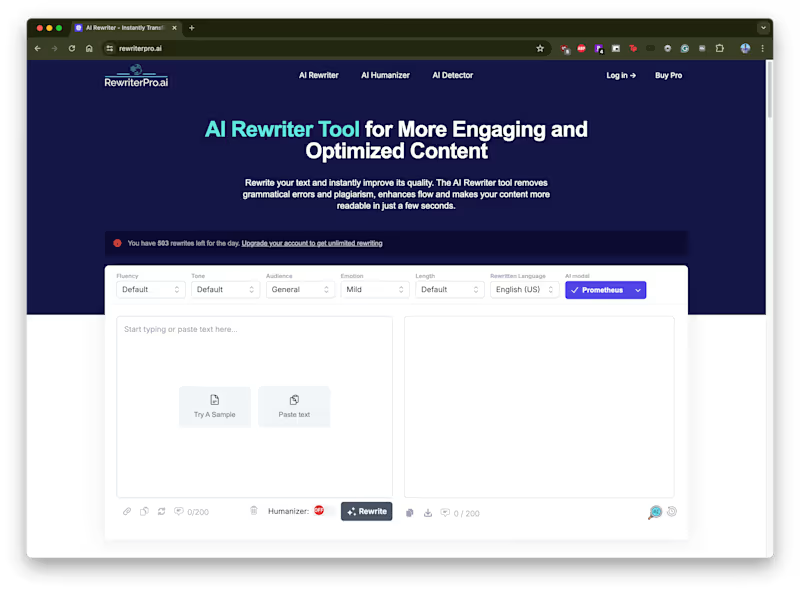
RewriterPro
0
33
0
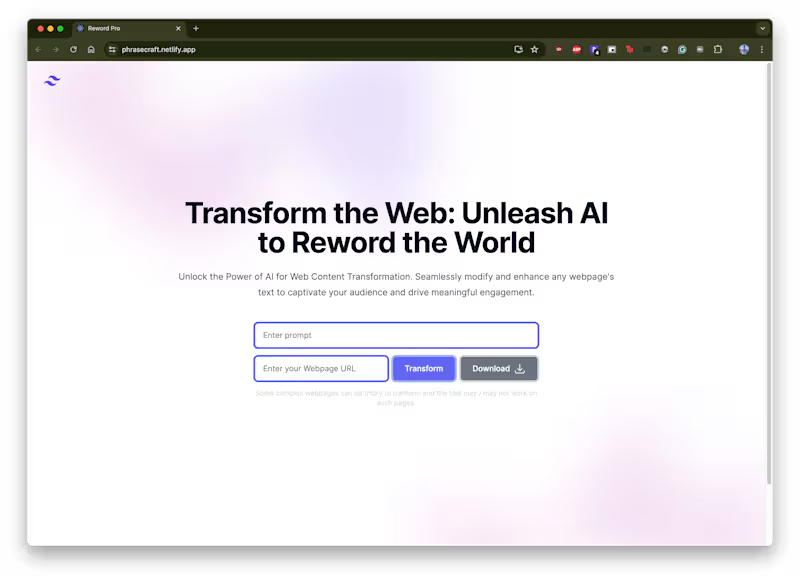
PhraseCraft: Revolutionize your web presence with AI-driven cont
0
22
0
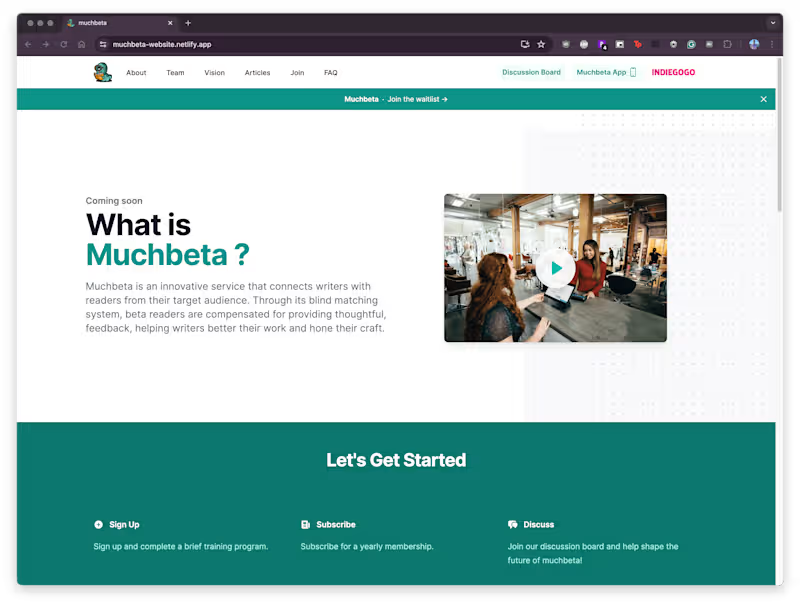
MuchBeta: Connecting writers with tailored beta readers
0
13
View more →
AI Developer
(2)
Follow
Message
Thewebheart S.
pro
Mumbai, India
Framer Official Expert & Top 1% Creator
$1k+
Earned
3x
Hired
5.0
Rating
126
Followers
expert
Expert
Follow
Message
Framer Official Expert & Top 1% Creator
1
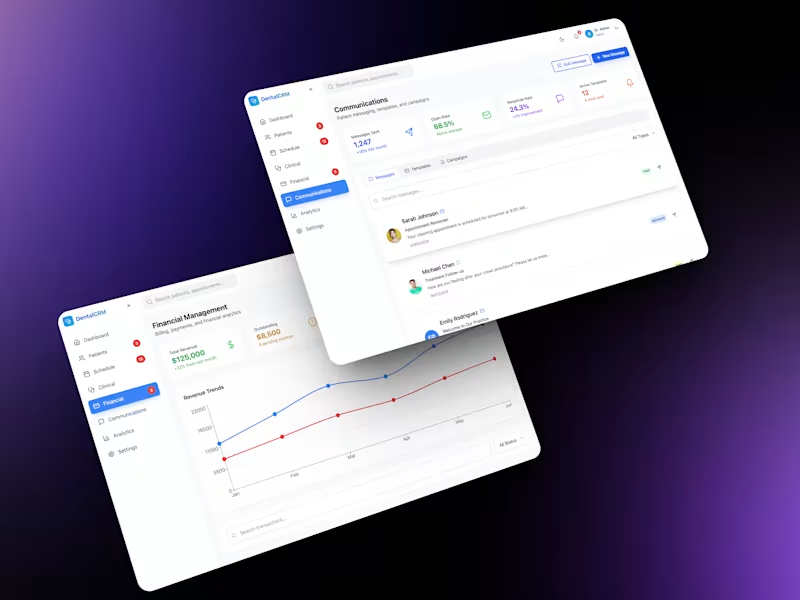
HealthTech CRM Application Prototype
1
4
3
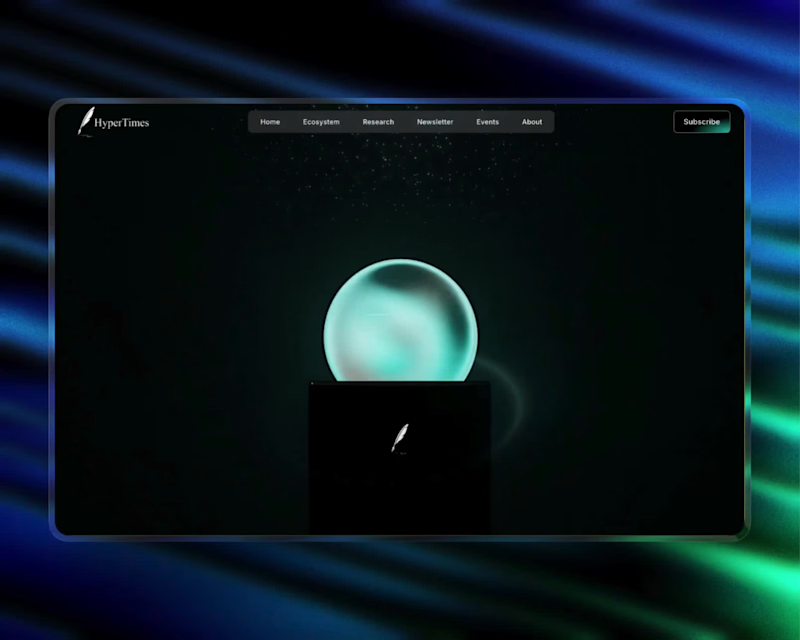
Didn't overthink this hero design... Clear message Classic visual direction Subtle motion that supports the story Built with @Unicorn Studio and a classic background that blends into the story through subtle shader effects.
2
3
345
3
For our client, the goal was simple: create a better web experience. A familiar visual style @Unicorn Studio entry animations Thoughtful Mouseover micro-interactions -- A story that unfolds as you scroll Simple idea - Thoughtful execution.
2
3
312
1
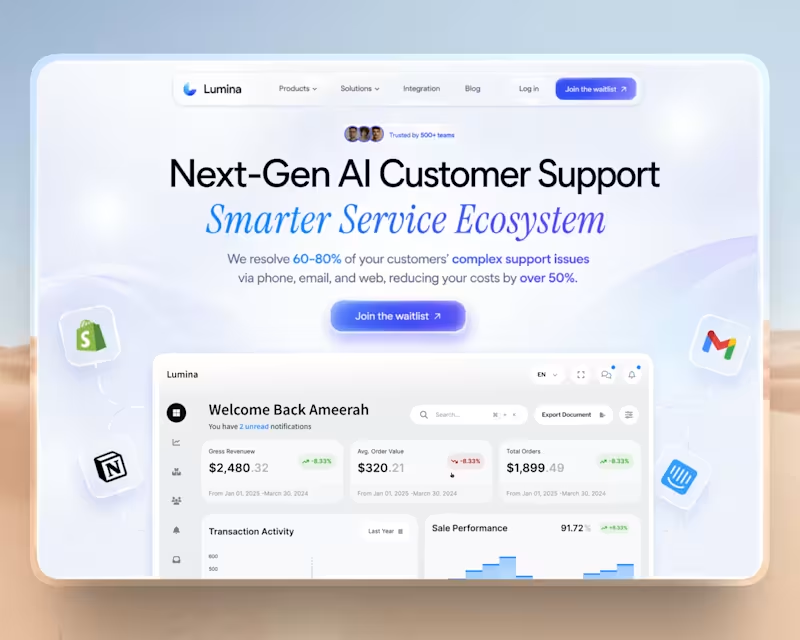
Where structured UI design meets intelligent motion.
1
779
AI Developer
(1)
Follow
Message
Nipun Roy
pro
Mumbai, India
The best in AI & Web Products, SaaS Platforms & Mobile Apps!
$5k+
Earned
5.0
Rating
4
Followers
Follow
Message
The best in AI & Web Products, SaaS Platforms & Mobile Apps!
1
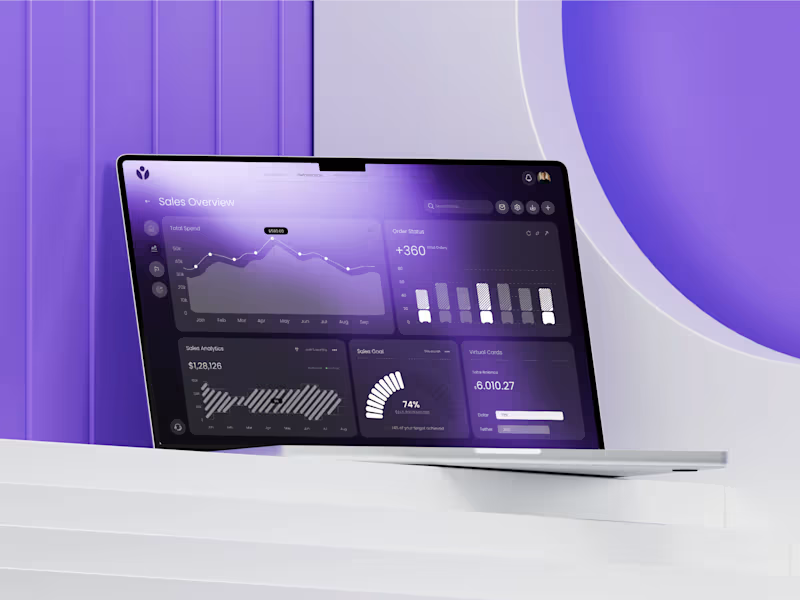
Market Pulse 📈 A modern sales and marketing dashboard built to give teams a clear view of performance without the clutter. The platform brings together campaign analytics, sales reporting, order management, customer growth, engagement metrics, conversion tracking, spending insights, and performance dashboards into a single workspace. Every screen is designed to make it easier to monitor KPIs, identify trends, and make data-driven decisions from one place. Loved exploring a bold visual direction with this one while keeping the experience clean, intuitive, and easy to navigate. #DashboardDesign #SaaS #UIDesign
2
1
73
0
ProjectFlow A project management platform we recently designed and built. It brings together project planning, task management, meeting scheduling, team collaboration, calendars, analytics, and progress tracking into one workspace. The goal was to create an interface that feels clean and intuitive while still providing everything teams need to manage projects efficiently. Really happy with how this one turned out.
0
42
1
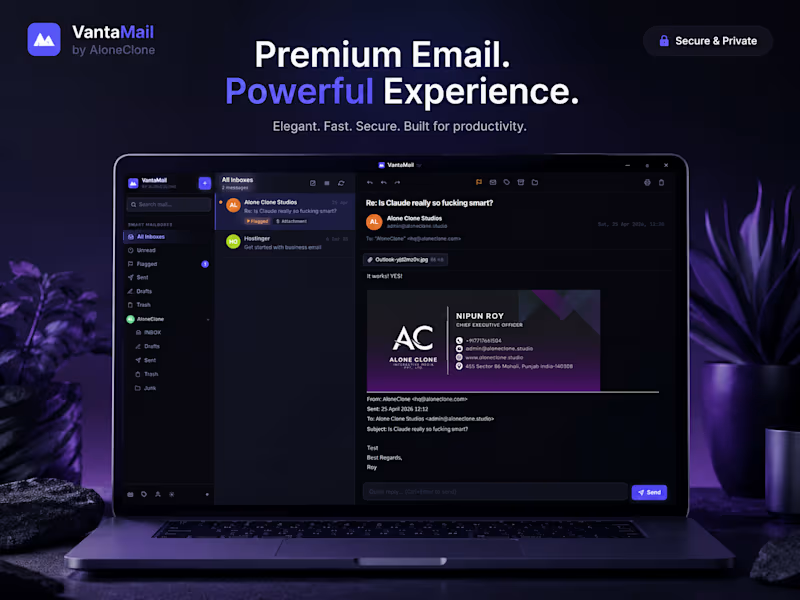
VantaMail - A desktop email client with a premium experience! Designed and developed as a modern multi-account email client focused on speed, privacy, and elegant workflows. Clean UI, seamless account management, and productivity-first design.
1
1
84
1
Almetry - Discover your inner landscape (https://www.almetry.ai/)A premium psychology assessment platform designed to transform self discovery into an elegant digital experience. Through reflective assessments, users uncover deep behavioral patterns, personality traits, and actionable insights that drive meaningful personal growth.
1
67
AI Developer
(6)
Follow
Message
Swift Struck
Mumbai, India
Tailor-made, Intelligent Tools in just 3 weeks
5.0
Rating
14
Followers
Follow
Message
Tailor-made, Intelligent Tools in just 3 weeks
1
I think I sent that to you on WhatsApp... or was it an email?" If you’ve said that this week, you’re not alone. But that’s usually where growth stalls. When files are in one place, deadlines are in another, and your "status updates" are buried in a group chat, chaos wins. We built The Portal because we were tired of playing detective. 🔍 It’s one home for your projects where: ✅ A deadline is a real deadline. ✅ The files you need are right where the work happens. ✅ You finally know exactly what’s happening, without the "check-in" fatigue. Less time hunting for info, more time actually building things. 🚀
1
71
0
Levanta
0
10
2
We’re experimenting with Apple-style “glass” to make our Glide ( (https://www.linkedin.com/company/glideapps/)glideapps.com (http://glideapps.com)) (https://www.linkedin.com/company/glideapps/) calmer and easier to scan. Not trying to be fancy.. just clearer. What we’re learning about the glass look: It’s not pure transparency. It’s a soft blur + a hint of tint so content stays readable. Depth comes from three gentle layers: background blur, a thin highlight border, and a soft shadow. Contrast matters. Text should pass accessibility checks, or the “wow” quickly turns to “where?” How we’re doing it in Glide with a touch of custom CSS: Frosted cards/nav: light translucent backgrounds, small blur. Subtle borders: 1px, low-opacity, to define edges. Rounded corners and roomy spacing to reduce visual noise. Minimal motion so the content, not the chrome, gets attention. Tiny snippet that powers a lot of the feel: .glass { background: rgba(255,255,255,.08); backdrop-filter: blur(12px); border: 1px solid rgba(255,255,255,.18); border-radius: 16px; box-shadow: 0 8px 24px rgba(0,0,0,.2); }
1
2
87
1
We noticed something interesting: A lot of businesses know how to grow. But as they grow, chaos grows with them. More projects. More approvals. More follow-ups. More spreadsheets. More “who’s handling this?” moments. Growth wasn’t the problem. Managing growth was. So we built a custom app where teams can stay focused on scaling the business — while the operations run smoothly in one place. ✔ Open projects ✔ Approval stages ✔ Pending payments ✔ Ownership & accountability ✔ Real-time status updates ✔ Clear team visibility That’s the difference between growing with chaos and growing with clarity.
1
78
AI Developer
(2)
Follow
Message
Abu Aasif Ansari
Bhiwandi, India
I build AI-powered data apps and dashboards
11
Followers
Follow
Message
I build AI-powered data apps and dashboards
1
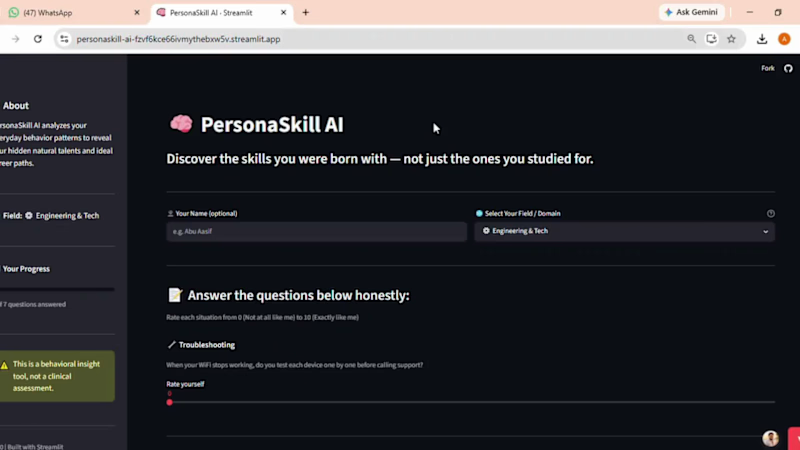
PersonaSkill AI — Career Assessment Tool
1
5
0
Retail Store Sales Analysis (SQL + Tableau) I built a sales analytics project for a fictional retail chain, OmegaEnterprise, to analyze revenue performance, customer behavior, and inventory trends using SQL and Tableau. Project Goals Identify top customers and best-selling products Analyze monthly sales trends and city-wise performance Monitor inventory levels to support stock decisions What I Did Joined Customers, Products, Sales, and Inventory tables using SQL Used aggregations, subqueries, and CTEs to generate insights Prepared datasets and created Tableau dashboards Key Insights Identified top revenue-contributing customers Highlighted high-demand products with inventory shortages Tools used: SQL, Tableau
0
61
1
Anomaly Review & Action Console (Retool + AI)
1
0
0
Superstore Sales Dashboard — 3-Page Power BI Report Built an interactive 3-page Power BI dashboard using the Superstore Sales dataset (9,994 orders across USA). Page 1 — Sales Overview: KPI cards, monthly trend, regional breakdown, category performance. Page 2 — Product Performance: Top products, category donut, profit analysis, sales vs profit scatter. Page 3 — Customer & Shipping: Segment breakdown, top 10 customers, monthly growth, ship mode distribution. Tools: Power BI, DAX, Superstore Dataset Theme: Dark professional with interactive year filter.
0
128
AI Developer
(1)
Follow
Message
Aditya Khaire
Navi Mumbai, India
PyPI Author | Python Dev | Building real-world tools| UI-UX|
Follow
Message
PyPI Author | Python Dev | Building real-world tools| UI-UX|
0
Development of TEMD Python Library for Error Explanation
0
0
0
TEMD: Transformative Error Message Decoder Launch
0
2
0
3D Product Rendering and Visualization
0
3
View more →
AI Developer
(1)
Follow
Message
Explore people