Power BI & SQL expert delivering actionable business insight
Power BI & SQL expert delivering actionable business insight
View more →
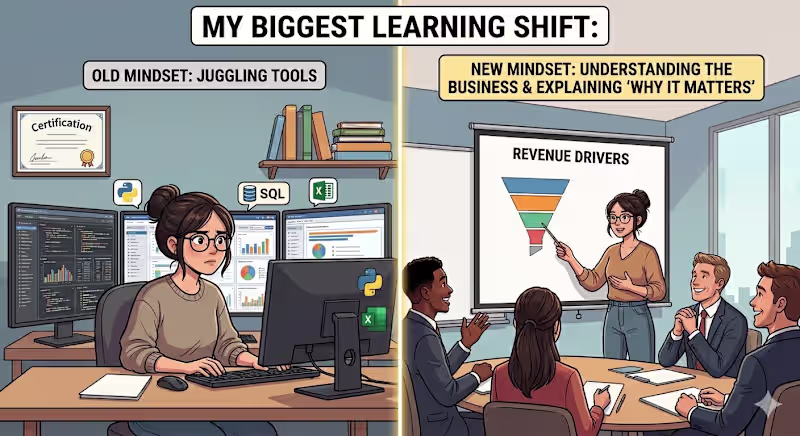
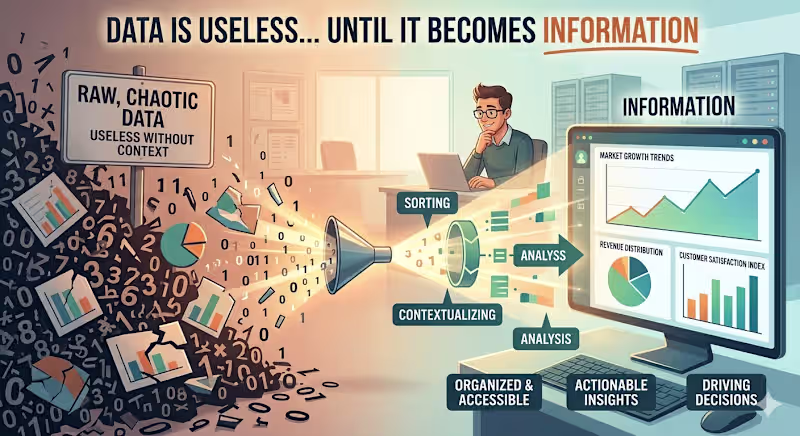
"From Data Chaos to Business Clarity."
"From Data Chaos to Business Clarity."
Transforming Brands through Web Design,Marketing & Analytics
- 1x
- Hired
- 5.0
- Rating
- 6
- Followers
Transforming Brands through Web Design,Marketing & Analytics


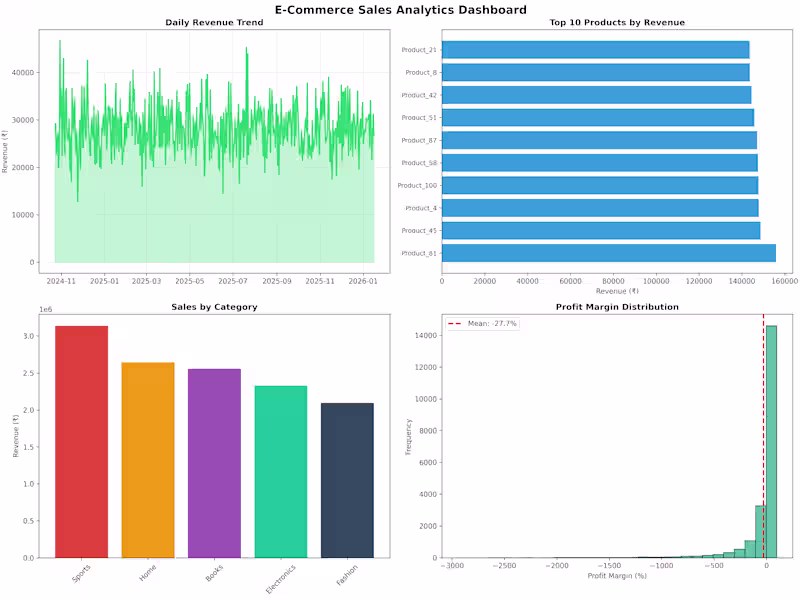
I build AI-powered data apps and dashboards
I build AI-powered data apps and dashboards
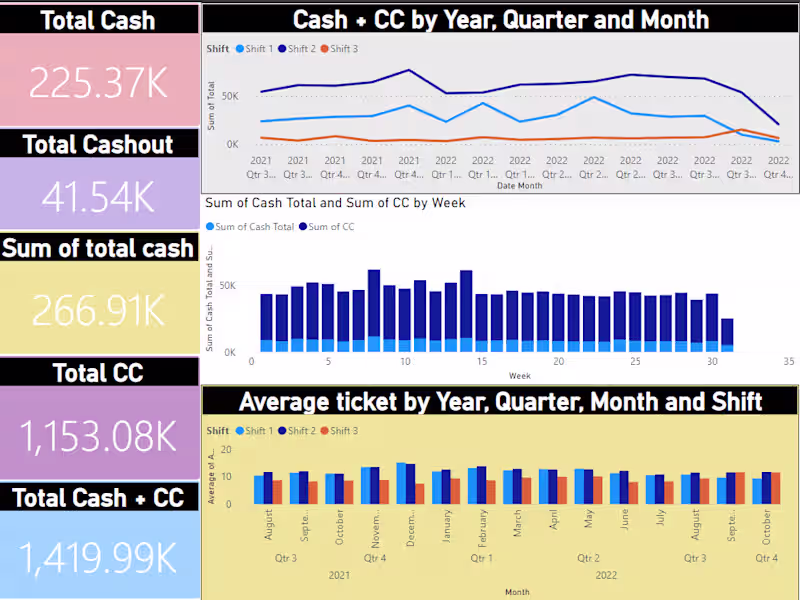
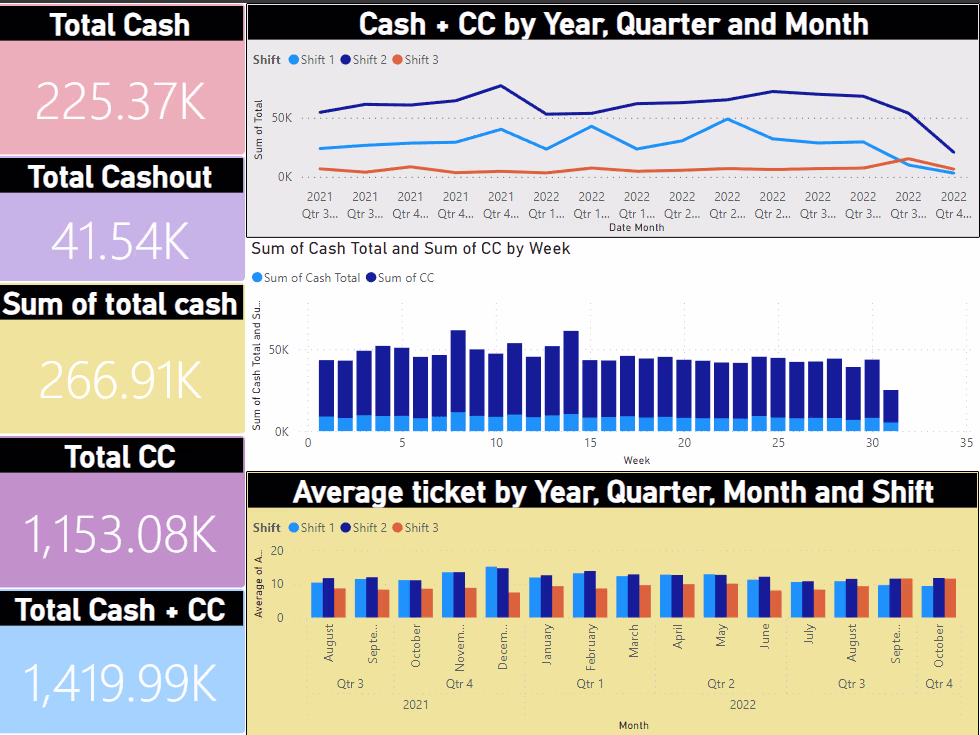
Power BI Data Analyst turning data into insights
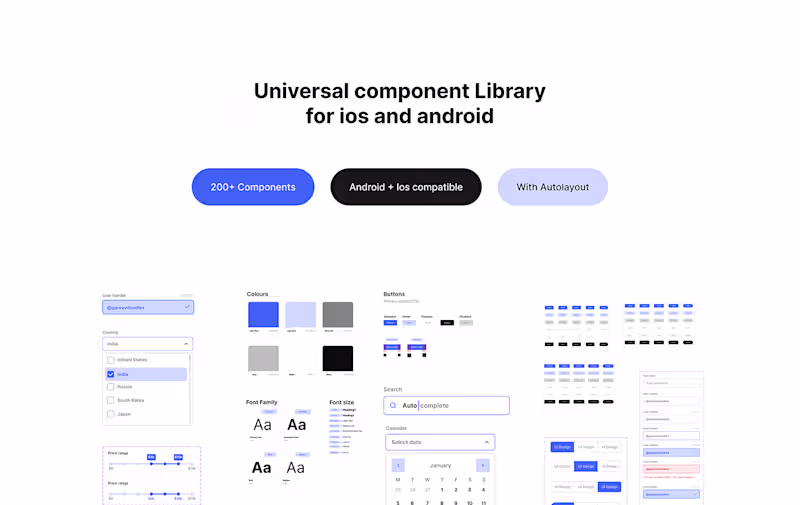
UI UX Designer | Trusted by global brands


View more →
An Excel Expert - Specializing in Data Analysis
An Excel Expert - Specializing in Data Analysis

View more →
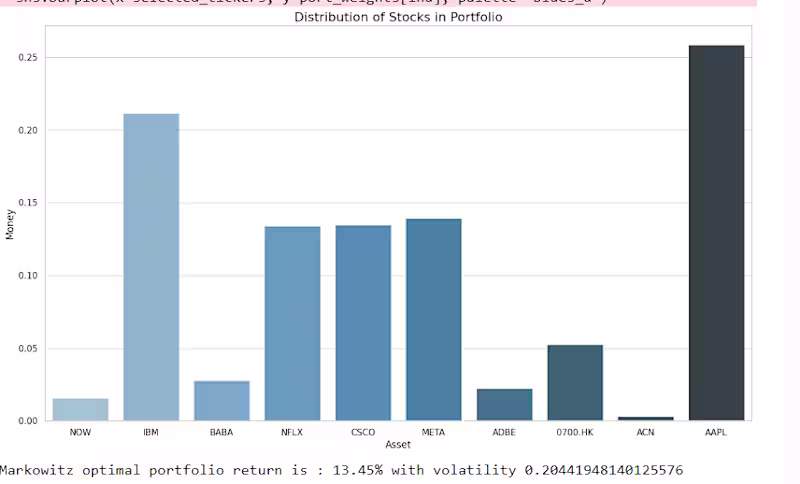
Data Analyst | ML Engineer | Fake News Detection | Dashboard
Data Analyst | ML Engineer | Fake News Detection | Dashboard