Data Analysis Projects in India
Data Analysis Projects in India
Sign Up
Post a job
Sign Up
Log In
Filters
2
Projects
People
Message
1
Denish Kukadiya
pro
GlideSUP | Shopify Plus | Conversion Rate Optmization | Redesign
1
23
Message
0
Nitin Upadhyay
pro
Meta Tracking Audit (Women's Health DTC, $20M+ Brand)
0
8
Message
4
Nagaraj M
Optimized WordPress Database (1.2GB → 300MB) – Fixed Critical Elementor Issues 🚨 Fixed a Critical WordPress Database Issue (1.2GB → 300MB) A client’s Elementor website suddenly started breaking — layouts collapsing, 502 errors, and database write failures. After investigation, I found the root cause: 👉 Database exceeded hosting limit (1GB+) 👉 postmeta table alone was ~957MB 👉 Over 800MB was unused orphan data 🔍 What I did: • Analyzed database using SQL (no blind cleanup) • Identified ~94K orphaned metadata entries • Safely removed unused postmeta records • Rebuilt the table to eliminate fragmentation • Optimized database structure ⚡ Results: • Database reduced from 1239MB → ~300MB • postmeta reduced from 957MB → 20MB • Eliminated 502 errors • Elementor saving issues fixed • Site performance significantly improved 💡 Key Insight: Most WordPress issues aren’t frontend problems — they’re database inefficiencies. 🛠️ Stack: WordPress • Elementor • MySQL • SiteGround If your site feels slow or unstable, the issue might be hidden in your database 👀
4
776
Message
2
Mehul Sethia | Senseibles
pro
DepX Pitch Deck
2
19
Message
0
Sparsh Gupta
pro
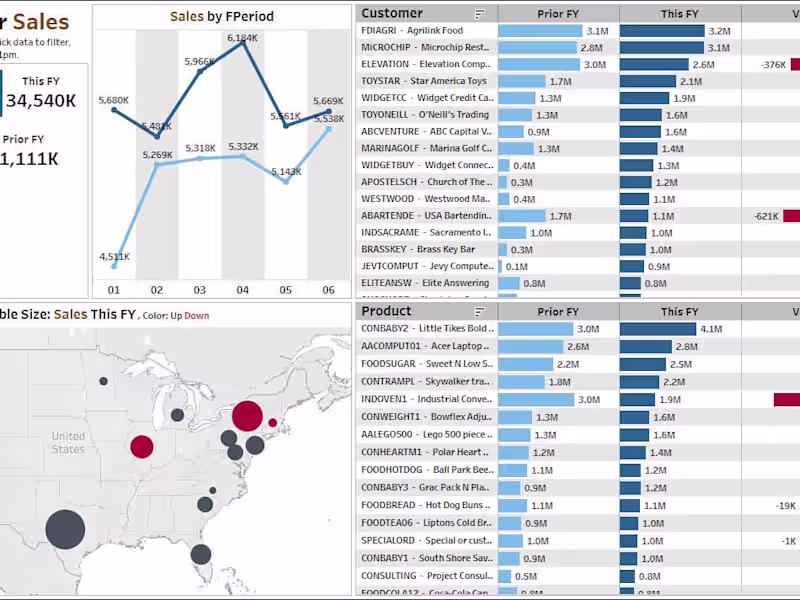
Tableau Pricing Tool for Sales Team
0
18
Message
2
Asif Farhan Khan
pro
Real Time Chart Data Extraction for Trading View
2
138
Message
4
Gopi UI/UX + AI
pro
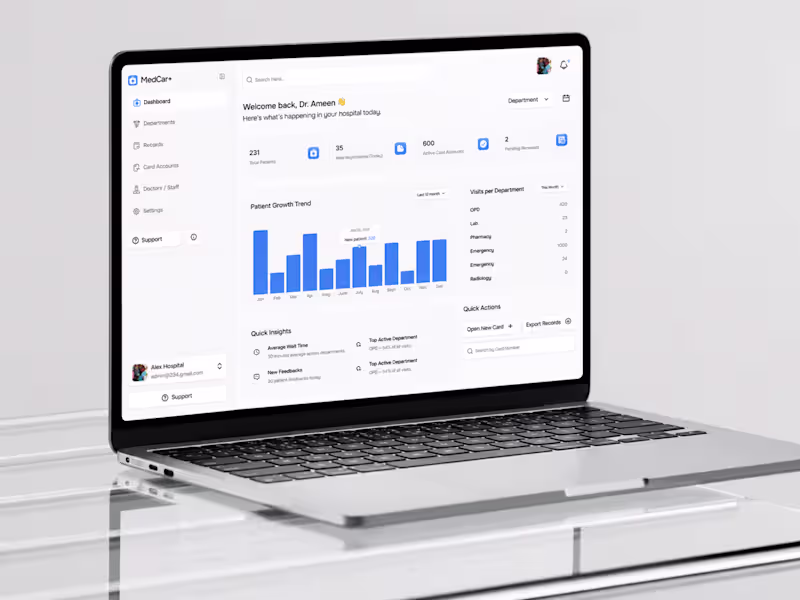
Healthcare Management Dashboard Design
4
14
Message
14
Abhiram Tinguria
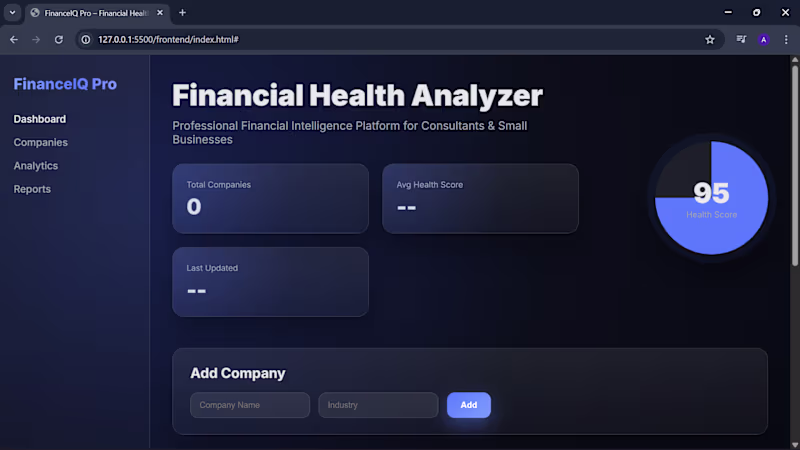
FinanceIQ Pro – Secure Flask REST API Backend
14
8
Message
1
Kaushal Gajjar
pro
Bwise: Empower Your Teaching with Course Creation Tools🎓
1
16
Message
0
Geethasree Naguboina
pro
Most small business owners I talk to have the same problem — their data is scattered across WhatsApp messages, paper notes, and half-filled Excel sheets. They know something is wrong. They just don't know where to start. Here's what I do in the first 30 minutes of any project: ✅ Understand what data you have and where it lives ✅ Identify what's missing, duplicate, or inconsistent ✅ Suggest the simplest structure that works for your business No complicated tools. No jargon. Just clean, organised data you can actually use. If your business data feels messy and overwhelming — let's fix that together. Message me and we'll start with a free 15-minute consultation. 📊
0
18
Message
2
Ravi chandu Edru
pro
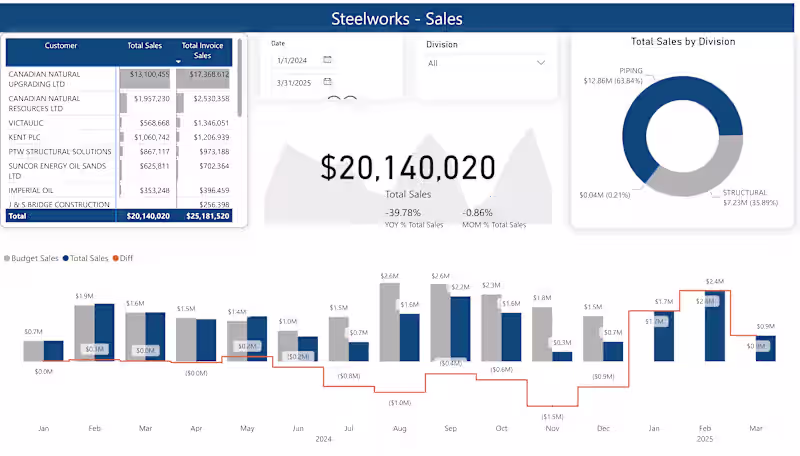
Power BI Dashboard
2
45
Message
0
Ansh Agrawal
pro
Analytics at CRED
0
25
Message
0
Sandip Ramani
pro
Lunamia Kids | Custom Shopify E-Commerce Development
0
2
Message
2
Ajay Bidyarthy- AI Full Stack Developer
pro
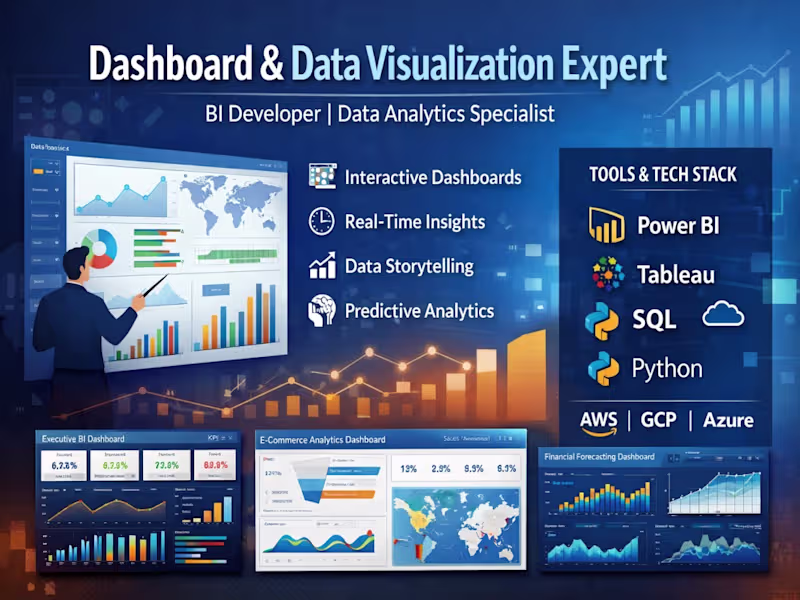
I specialize in transforming complex datasets into intuitive, visually compelling dashboards that drive strategic decision-making. With deep expertise in BI tools and data analytics, I design interactive, real-time reporting systems that help businesses uncover trends, monitor KPIs, and optimize performance. My approach combines data storytelling, clean UI/UX, and scalable architecture to deliver impactful insights. 🔹 My Project Portfolio: 📊 1. Executive Business Intelligence Dashboard Built a dynamic KPI dashboard for C-level executives Integrated multiple data sources (CRM, ERP, marketing platforms) Delivered real-time insights on revenue, growth, and performance Tools: Power BI, SQL, Azure 📈 2. E-commerce Analytics Dashboard Designed a dashboard tracking sales, customer behavior, and conversion rates Implemented cohort analysis and funnel visualization Improved marketing ROI tracking by 40% Tools: Tableau, Python, Google Analytics 📉 3. Financial Performance & Forecasting Dashboard Developed financial models and forecasting dashboards Visualized cash flow, P&L, and budget vs actuals Enabled data-driven financial planning Tools: Power BI, Excel, DAX 📍 4. Operations & Supply Chain Dashboard Created logistics tracking and inventory monitoring system Real-time alerts for stock levels and delays Reduced operational inefficiencies Tools: Looker Studio, BigQuery 📊 5. AI-Powered Analytics Dashboard Integrated machine learning predictions into dashboards Automated anomaly detection and trend analysis Delivered predictive insights for decision-making Tools: Python, TensorFlow, Streamlit
1
2
195
Message
1
Chinmay Singhal
SaaS Landing Page
1
225
Message
0
Paresh Pavani
Premium Accounting Sales Engine
0
140
Explore projects