The network for creativity
Join 1.25M professional creatives like you
Connect with clients, get discovered, and run your business 100% commission-free
Creatives on Contra have earned over $150M and we are just getting started
Back to feedPost


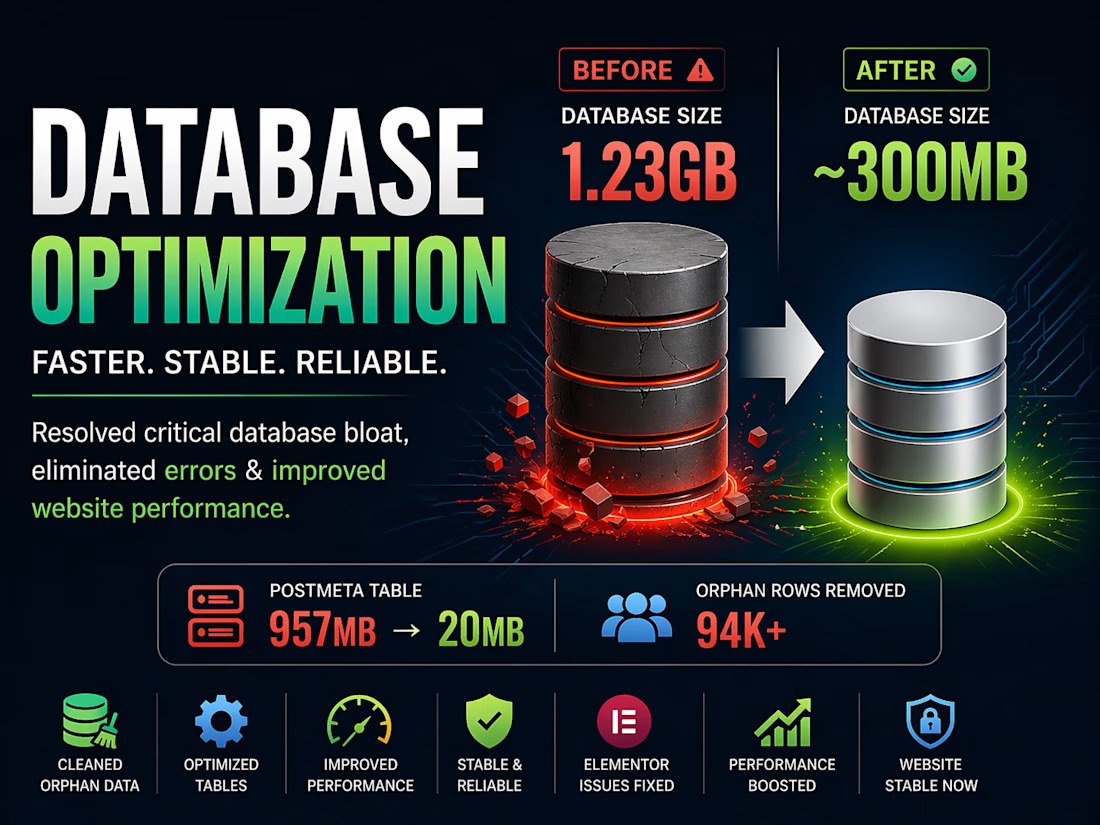
Optimized WordPress Database (1.2GB → 300MB) – Fixed Critical Elementor Issues
🚨 Fixed a Critical WordPress Database Issue (1.2GB → 300MB)
A client’s Elementor website suddenly started breaking — layouts collapsing, 502 errors, and database write failures.
After investigation, I found the root cause:
👉 Database exceeded hosting limit (1GB+)
👉 postmeta table alone was ~957MB
👉 Over 800MB was unused orphan data
🔍 What I did:
• Analyzed database using SQL (no blind cleanup)
• Identified ~94K orphaned metadata entries
• Safely removed unused postmeta records
• Rebuilt the table to eliminate fragmentation
• Optimized database structure
⚡ Results:
• Database reduced from 1239MB → ~300MB
• postmeta reduced from 957MB → 20MB
• Eliminated 502 errors
• Elementor saving issues fixed
• Site performance significantly improved
💡 Key Insight:
Most WordPress issues aren’t frontend problems — they’re database inefficiencies.
🛠️ Stack:
WordPress • Elementor • MySQL • SiteGround
If your site feels slow or unstable, the issue might be hidden in your database 👀
WordPress DevelopmentMySQLweboptimizationdatabaseElementorData AnalysisDatabase EngineeringSiteGround


The network for creativity
Join 1.25M professional creatives like you
Connect with clients, get discovered, and run your business 100% commission-free
Creatives on Contra have earned over $150M and we are just getting started





Related posts

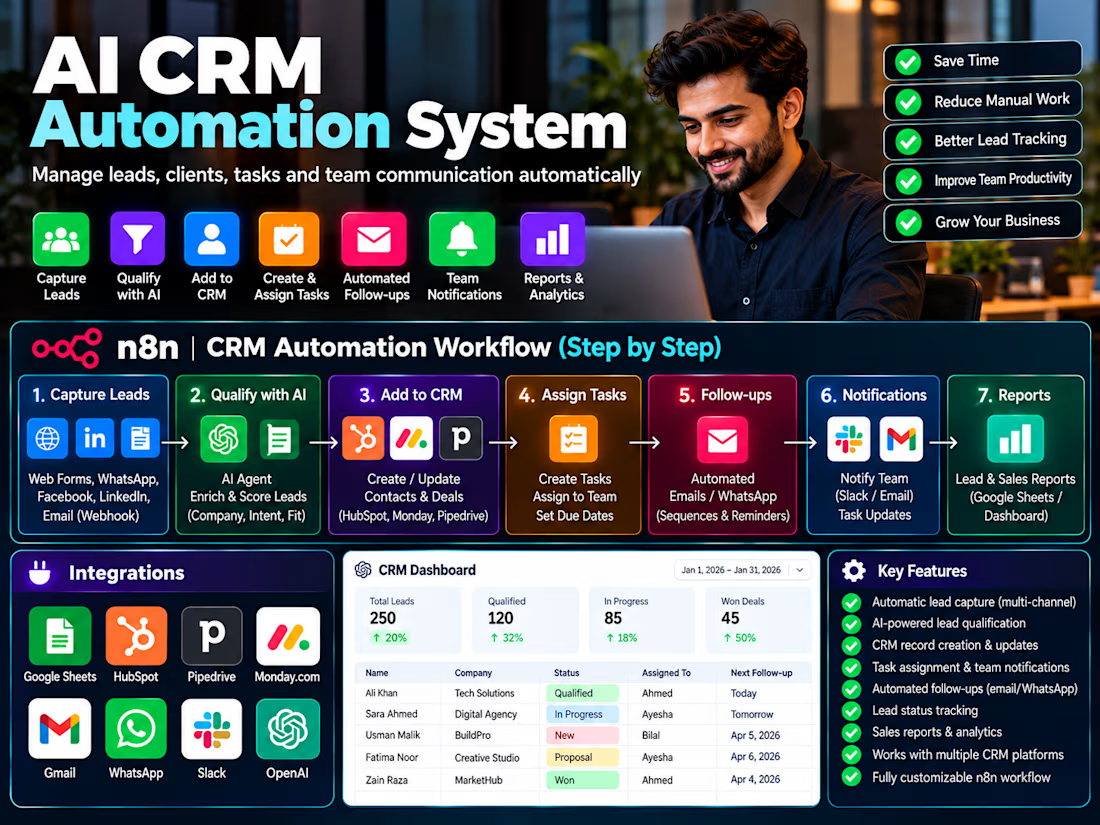
Built an n8n CRM automation system that captures leads, creates and updates CRM records, assigns tasks, sends team notifications, automates follow-ups and generates reports.



MatStore — High-Converting E-commerce Sales Page
Designed and developed a conversion-focused product sales page for MatStore, with a strong emphasis on visual storytelling, product presentation and a clear purchasing journey.

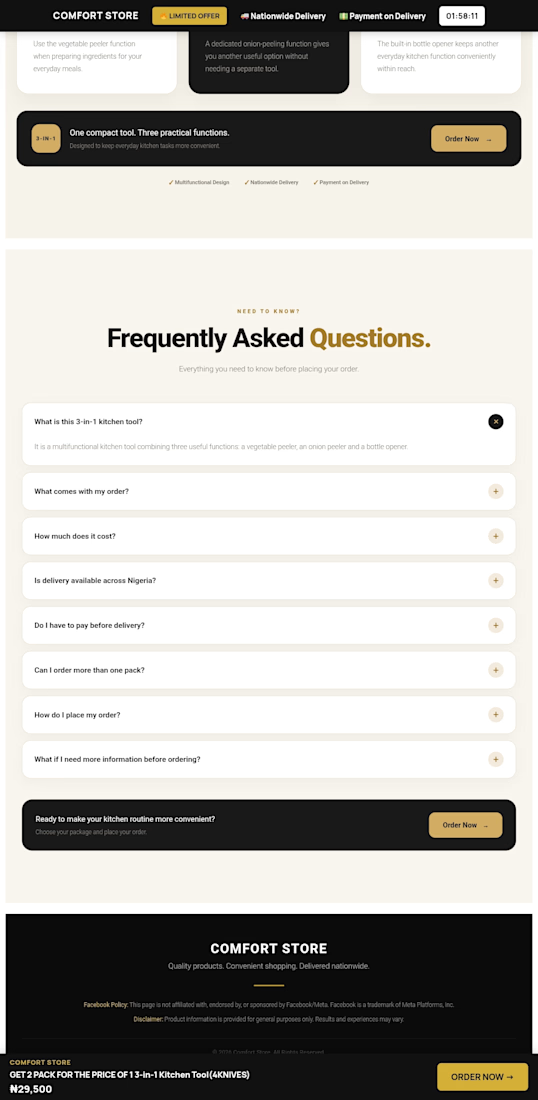
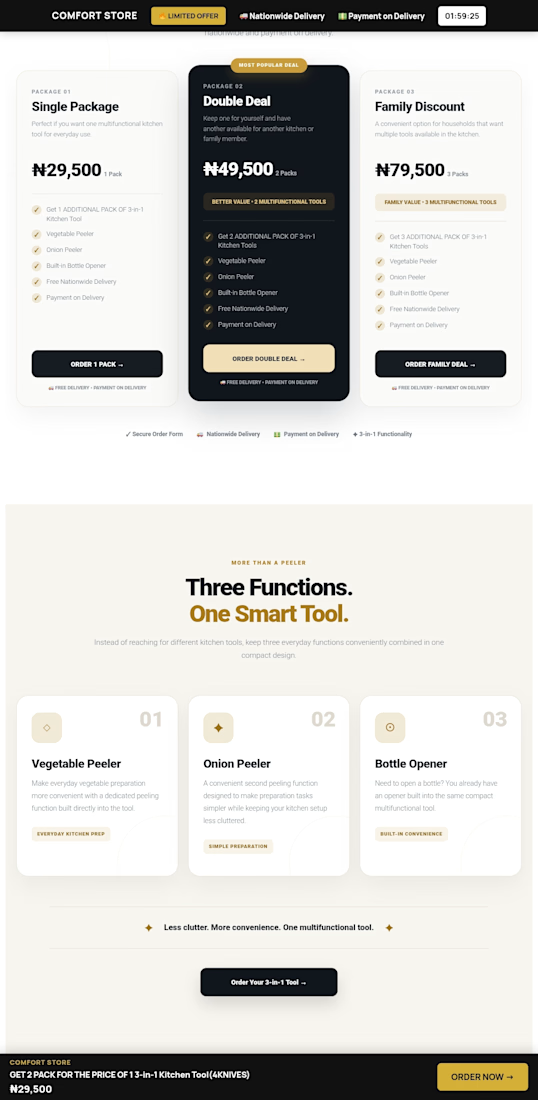
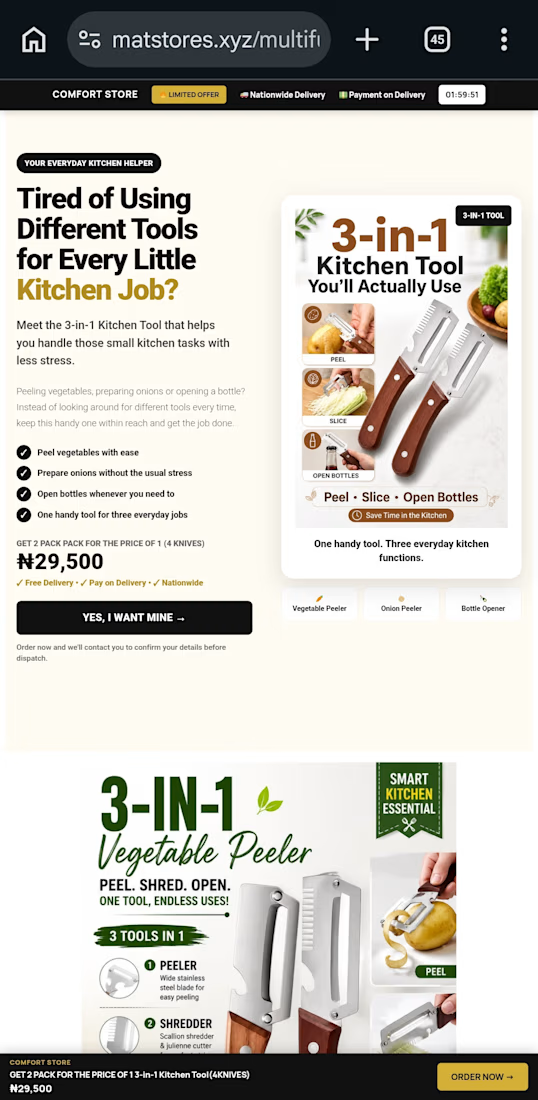
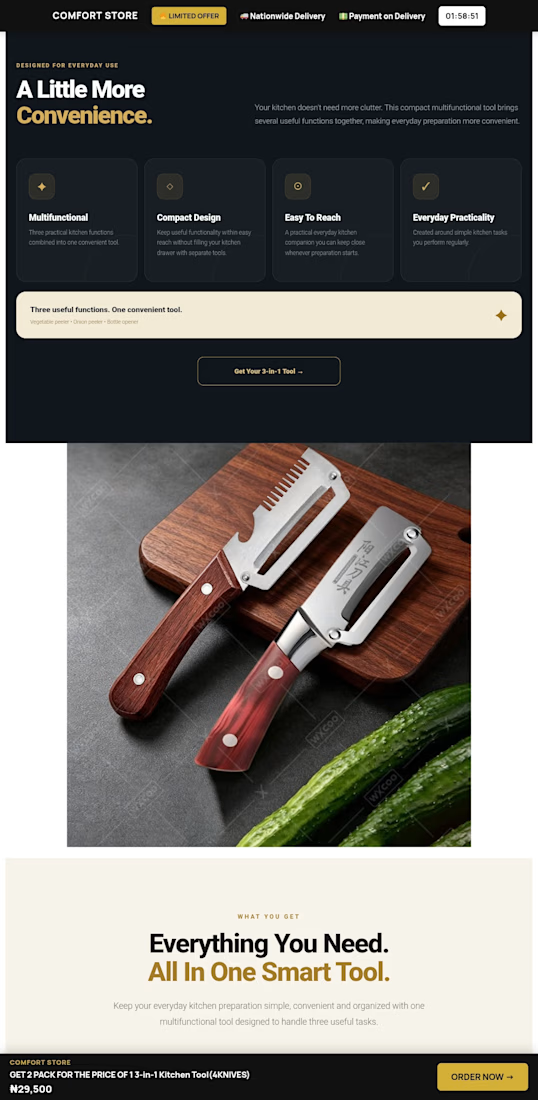

Clean approach. Strong product presentation and a clear buying journey can make a big difference.
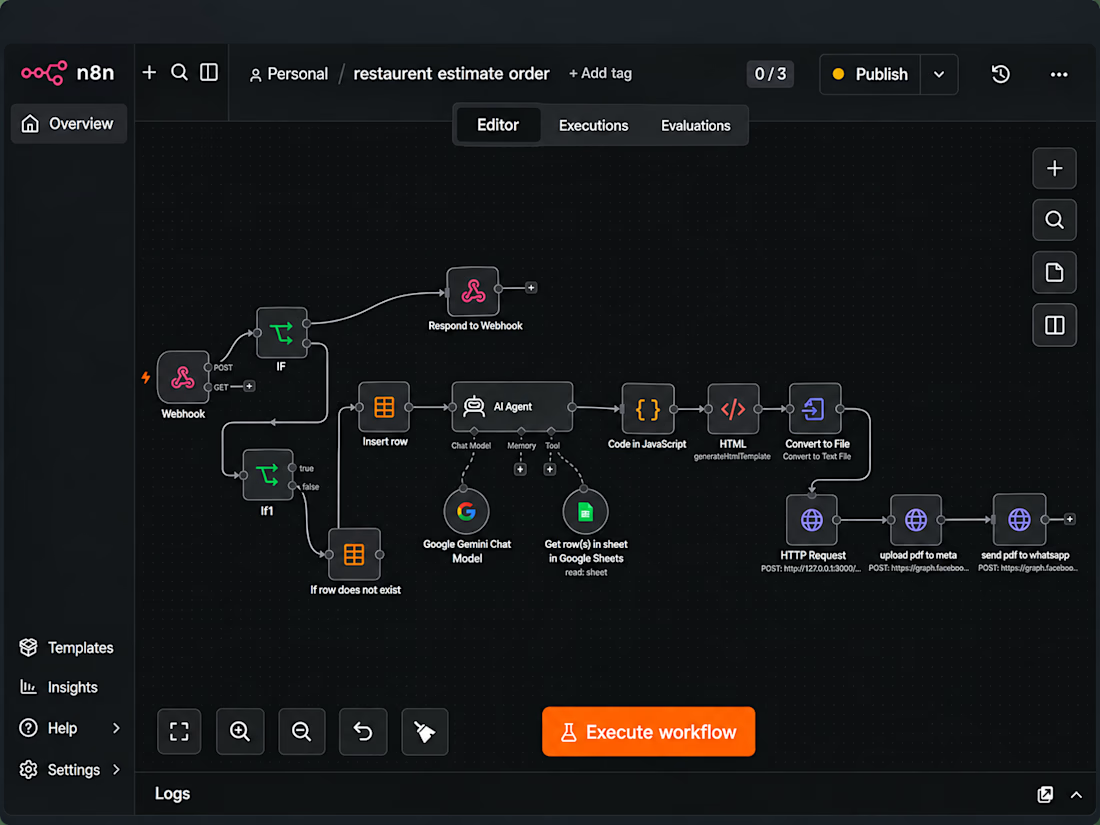
Restaurant Automation System. Automates WhatsApp orders, menu & pricing lookup, estimate generation, PDF invoices, and order processing using n8n, Google Sheets, Gemini AI and WhatsApp Cloud API.