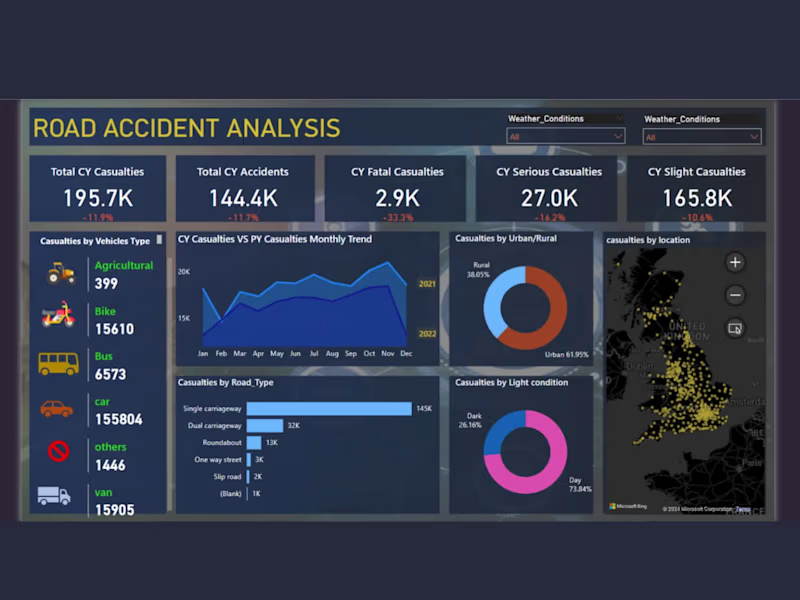
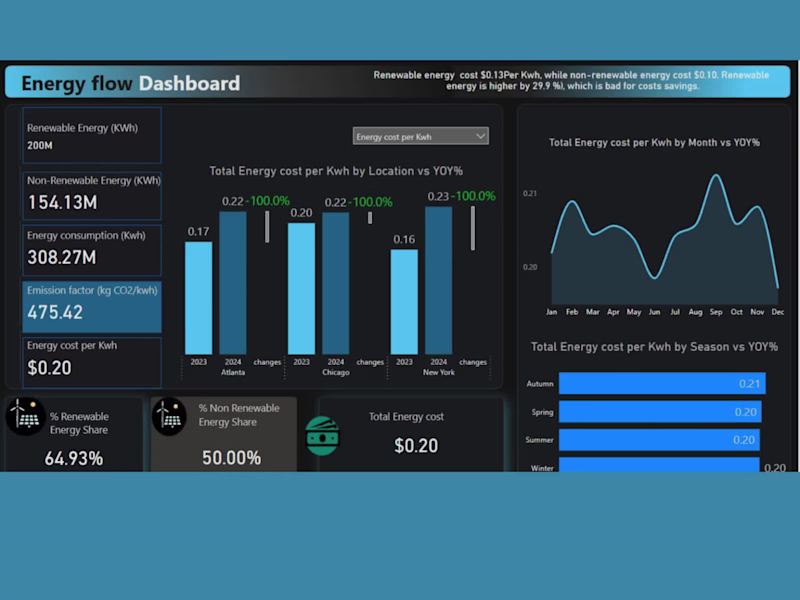
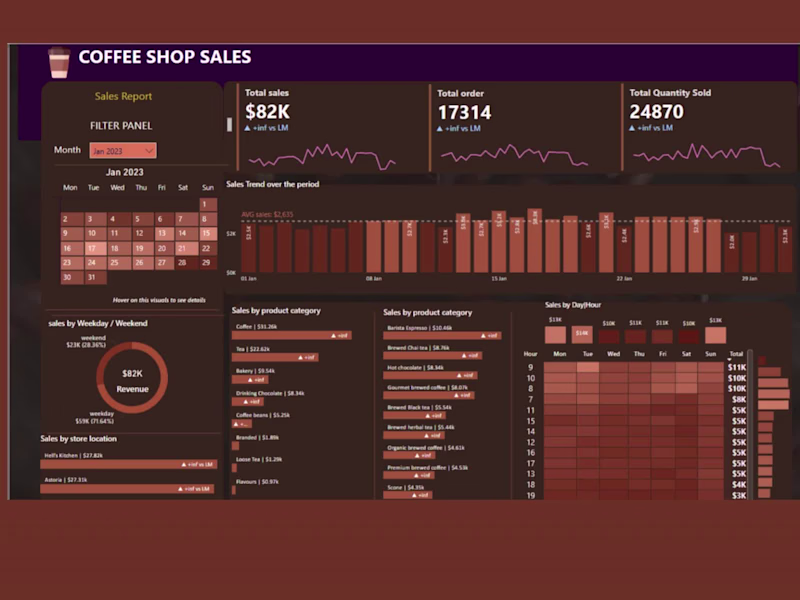
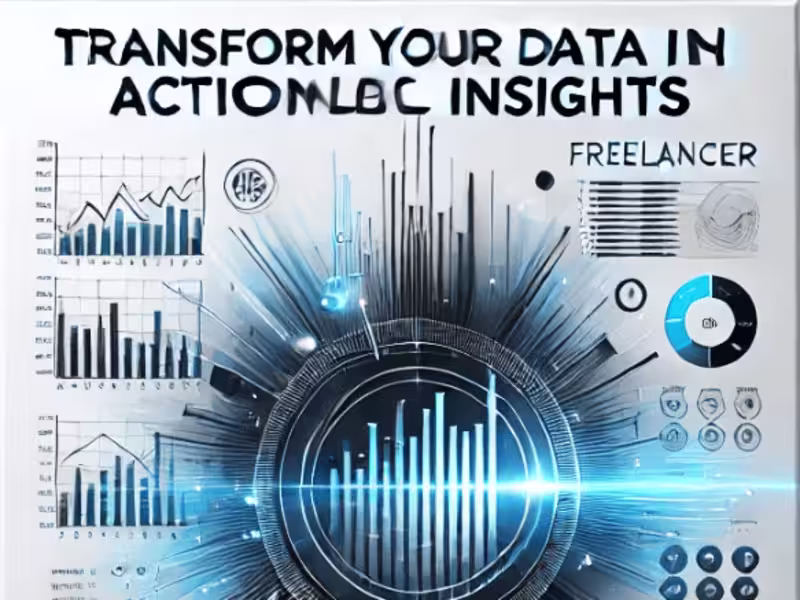
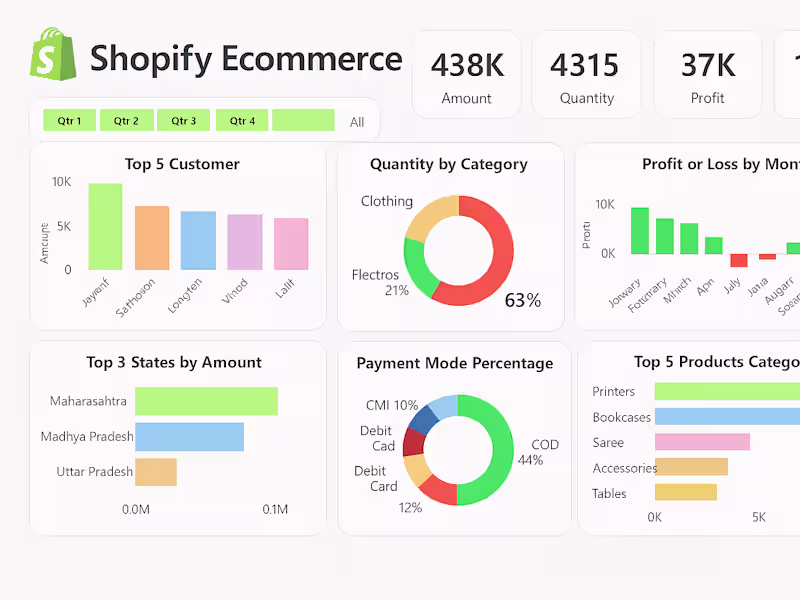
Data visualization engineer, Data Analyst, BI Expert
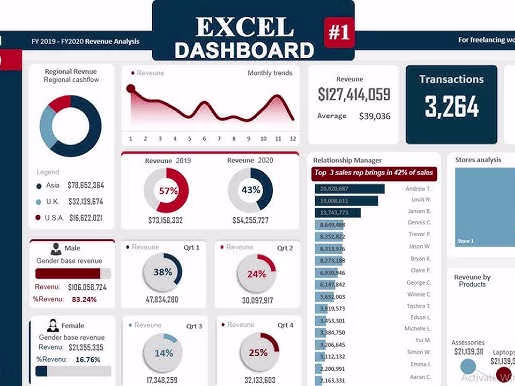
Business Intelligence Specialist | Power BI & Excel Expert
Business Intelligence Specialist | Power BI & Excel Expert

Researcher | Content Writer | Social Media Manager
Researcher | Content Writer | Social Media Manager


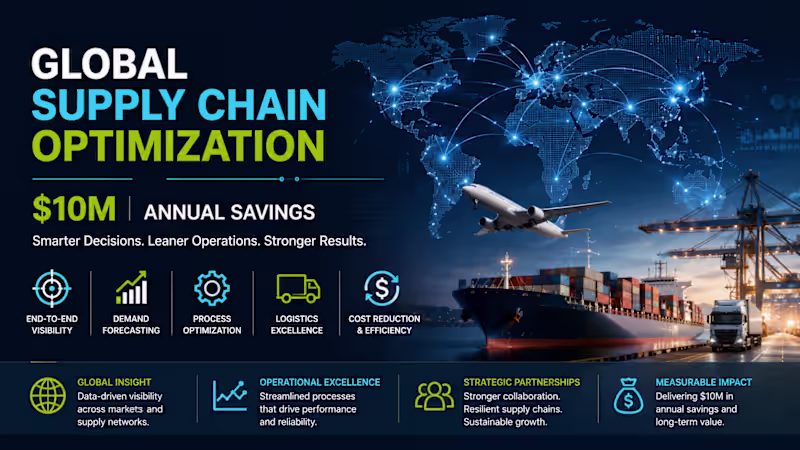
Turning Raw Data into Valuable Insights
Turning Raw Data into Valuable Insights

View more →
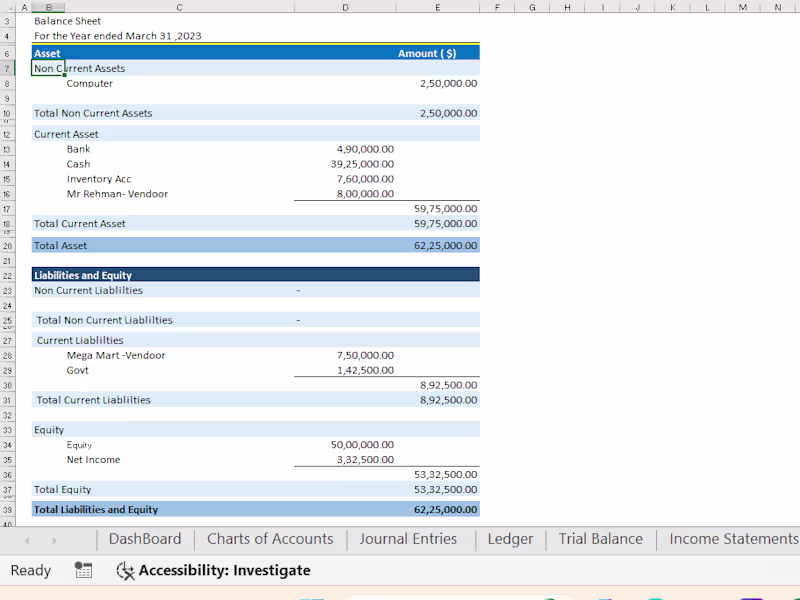
Global Accountant & Bookkeeper
Global Accountant & Bookkeeper

View more →
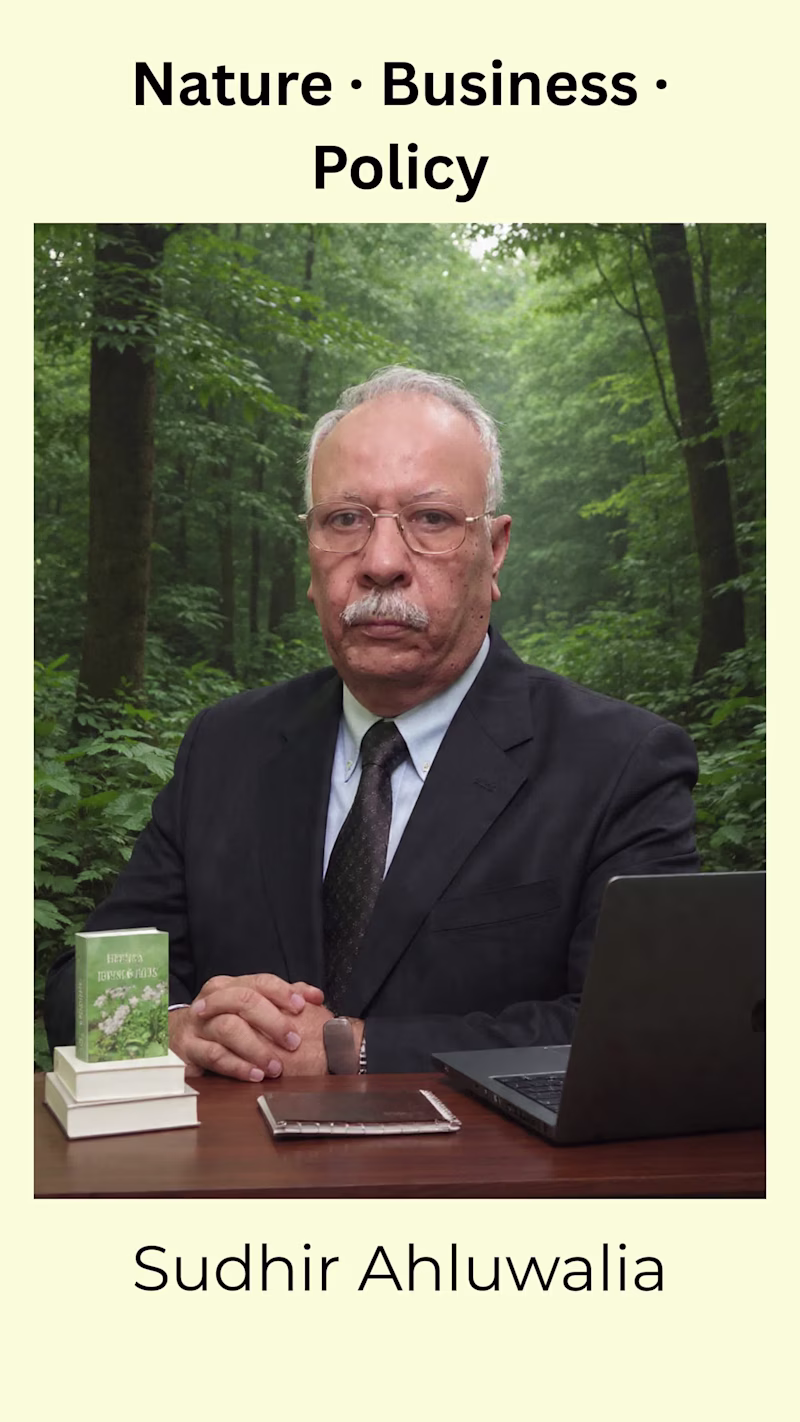
AI Knowledge Strategist | Researcher | Course Architect

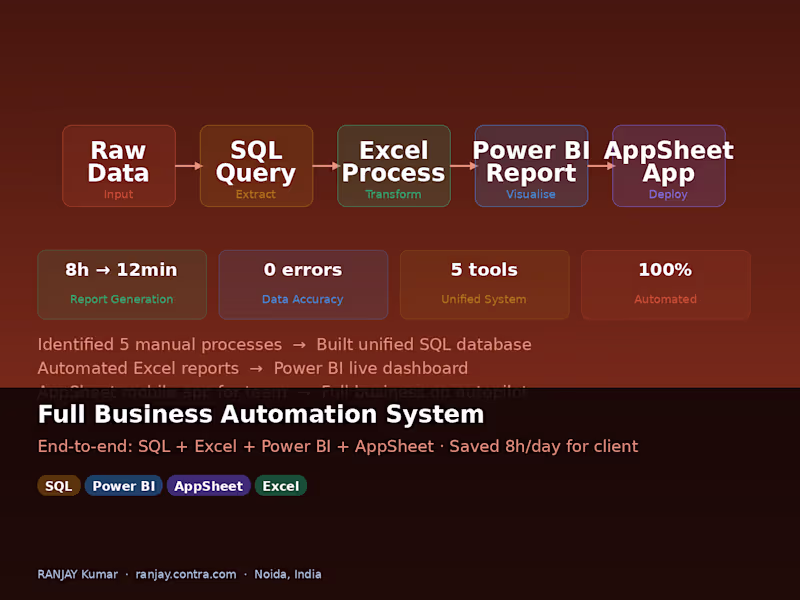
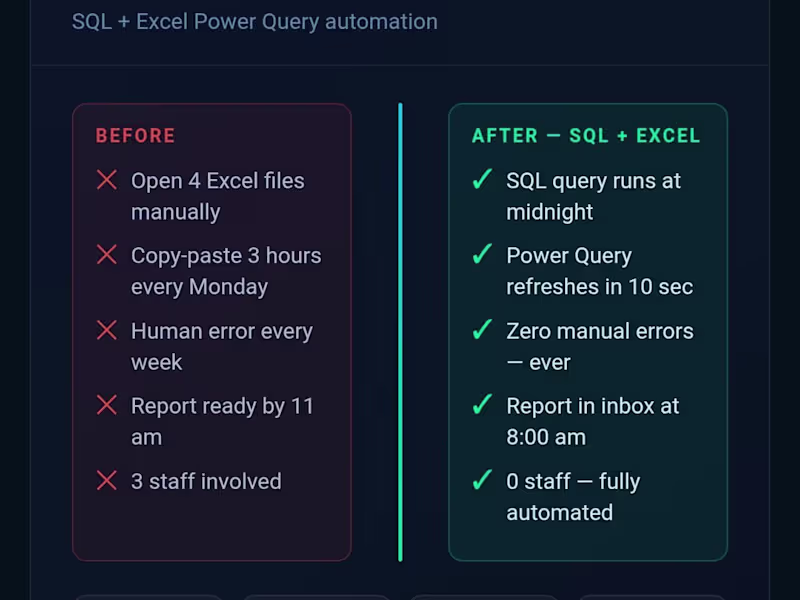
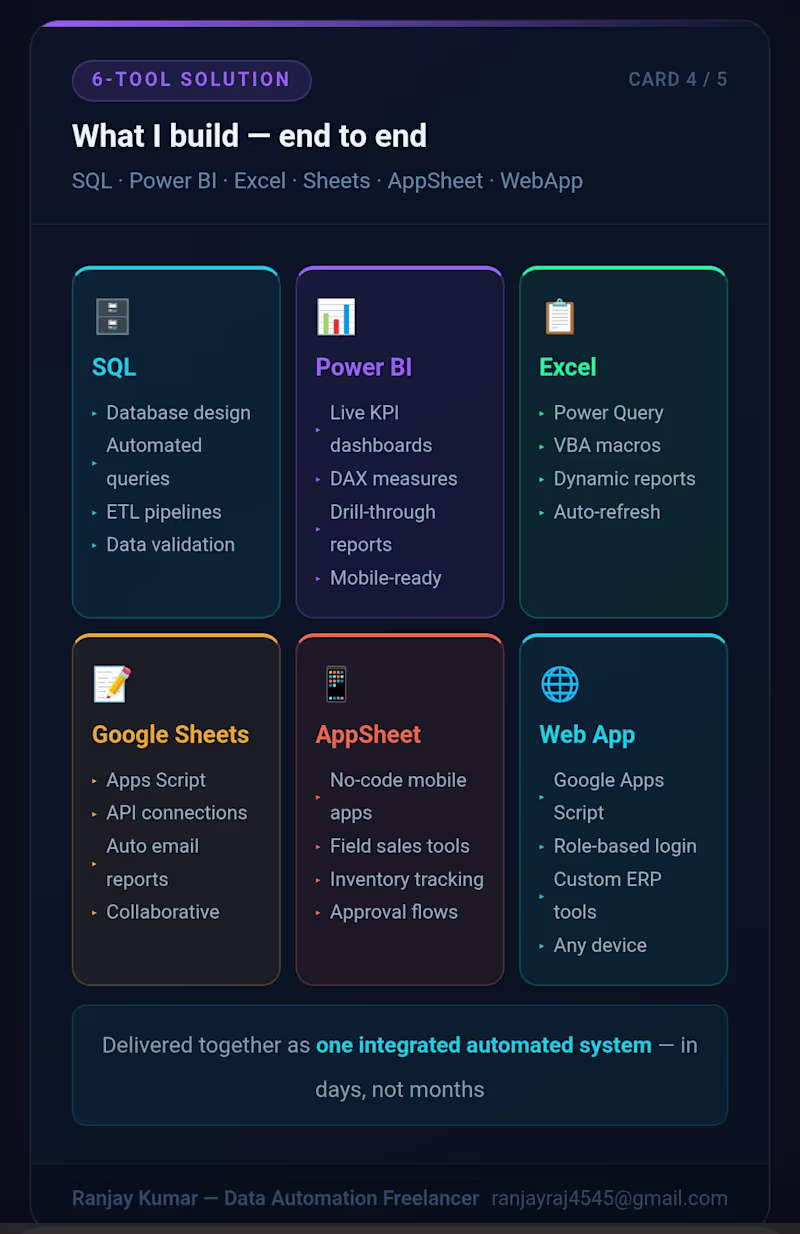
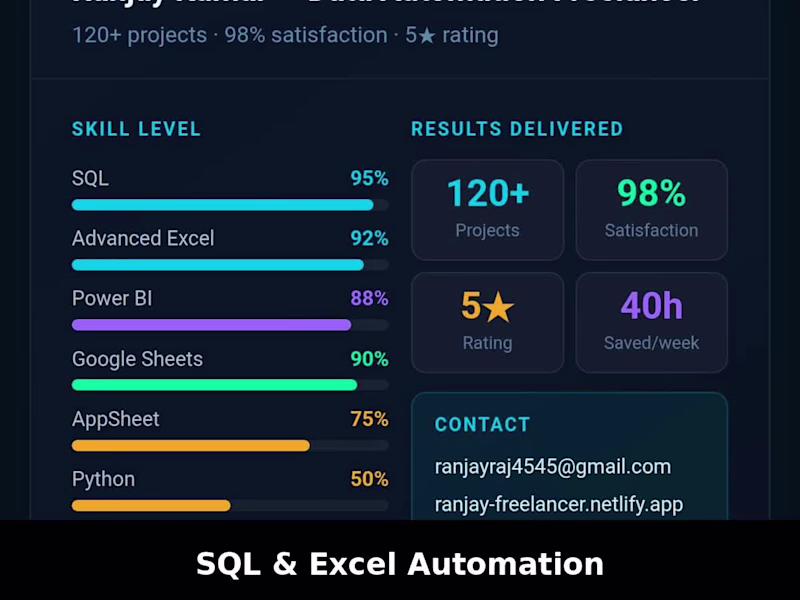
I automate processes and build dashboards that save time
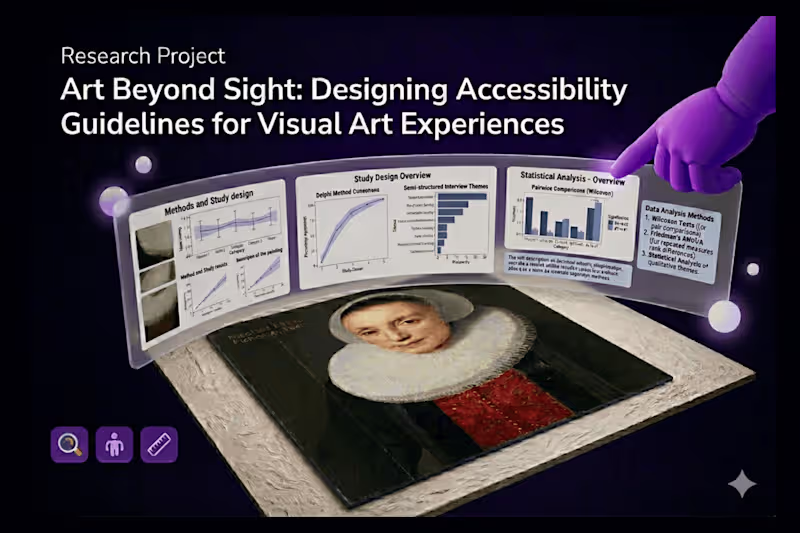
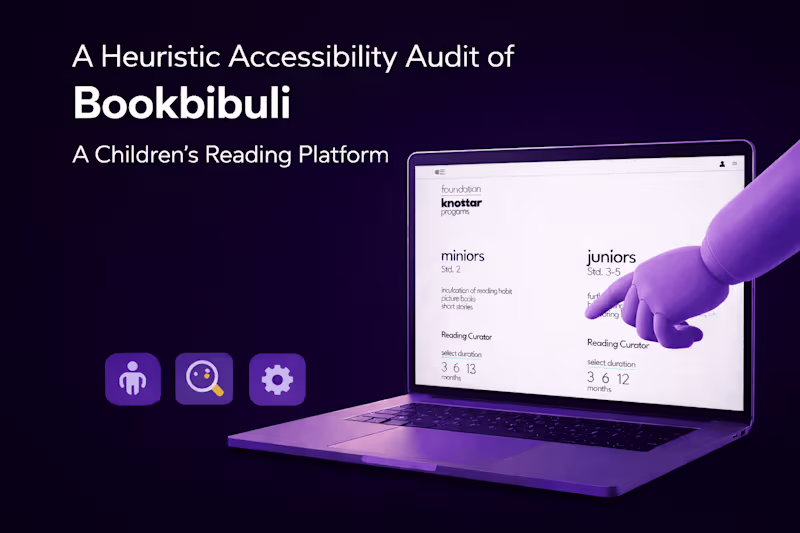
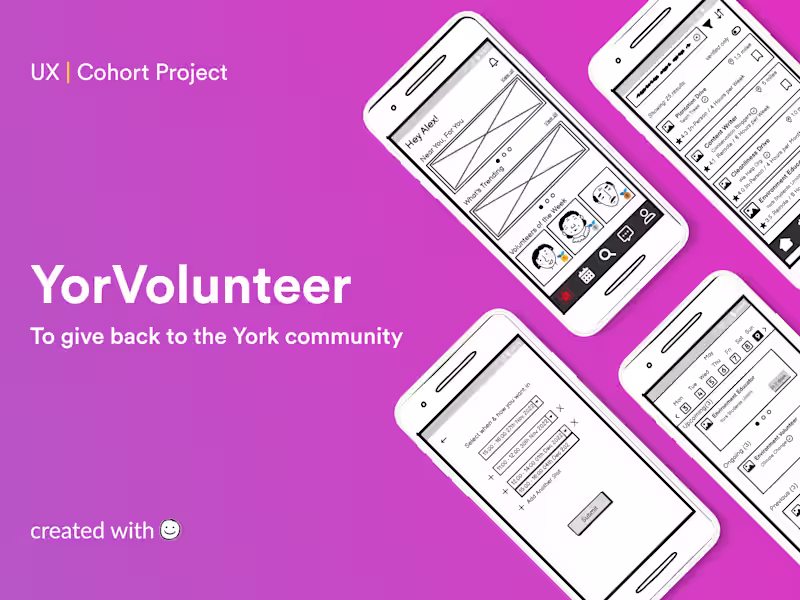
Accessibility UXD | WCAG 2.1 Audits | Inclusive Design UXR
- 5.0
- Rating
- 1
- Followers
Accessibility UXD | WCAG 2.1 Audits | Inclusive Design UXR