Data Visualization & Interactive Dashboards
Harsh Singhal
📊 Data Visualization & Interactive Dashboards
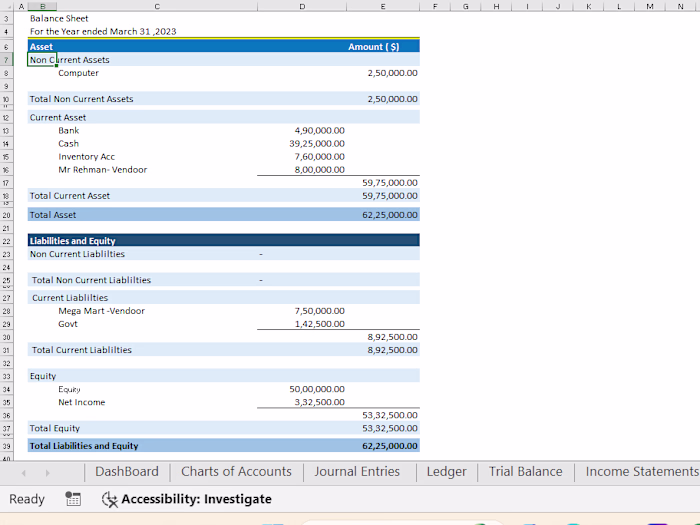
I will transform your raw financial and business data into clear, interactive dashboards that help you make smarter decisions. Using tools like Excel, Power BI, or Google Data Studio, I’ll design visuals tailored to your KPIs.
This service includes:
Clean and structured data models
Custom dashboards for sales, expenses, and performance tracking
Charts, graphs, and KPIs for easy decision-making
Automation for regular reporting
Export-ready visuals (PDF, PPT, or Excel)
Like this project
Posted Sep 20, 2025
Created interactive dashboards using Excel, Power BI, and Google Data Studio.
Likes
0
Views
4
Timeline
May 1, 2025 - Jun 30, 2025
Clients
Freelancer