Data Visualization & Reporting for Business Insights
Ashish Kumar
Project Description:
This project focuses on transforming raw data into meaningful insights through advanced data visualization techniques. I will clean, structure, and analyze the data to create dynamic reports that present trends, comparisons, and key metrics. The final deliverable will be an interactive dashboard or report, helping businesses to make better strategic decisions based on accurate, visually engaging data.
Skills Demonstrated:
Data cleaning and preparation using Excel formulas and tools
Visualizing data through charts, graphs, and tables
Creating actionable insights through data analysis
Designing intuitive and interactive dashboards for real-time business tracking
Use of advanced Excel functions like INDEX/MATCH, PivotTables, and Conditional Formatting
Tools Used:
Microsoft Excel
Power BI (optional for more advanced visualization if you want to expand beyond Excel)
Google Sheets (if applicable)
Project Deliverables:
Cleaned and formatted data set ready for analysis
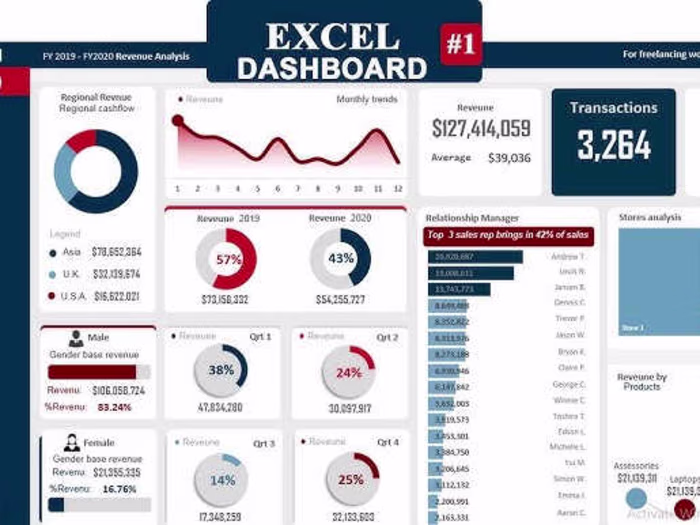
Interactive, easy-to-understand dashboard/report with visualizations like line graphs, pie charts, bar charts, and trend analysis
Executive summary with key insights and recommendations
Target Audience:
Small to medium businesses or freelancers looking to make data-driven decisions, monitor KPIs, and identify trends through clear visual reports.
Project Outcome:
Clients will receive a polished, interactive dashboard/report that clearly presents data insights, enabling them to quickly understand and act on business trends, sales data, or other key performance indicators.
Like this project
Posted Jan 30, 2025
Transform raw data into actionable insights with clean, structured data and interactive Excel dashboards, helping businesses make informed, data-driven decision