Advanced Data Cleaning & Interactive Excel Dashboard Creation
Ashish Kumar
Project Description:
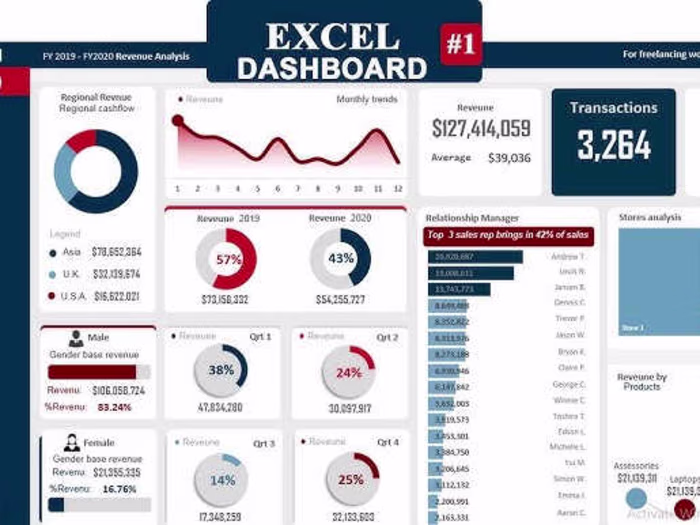
This project involves cleaning raw data and transforming it into a structured, insightful format. I’ll utilize advanced Excel functions to clean, manipulate, and analyze data, followed by creating an interactive dashboard to visually represent key metrics. The goal is to help businesses make data-driven decisions through visually appealing and easy-to-understand reports.
Skills Demonstrated:
Data cleaning using Excel functions like VLOOKUP, CONCATENATE, and TEXT functions
Pivot tables and data summarization
Interactive Excel dashboards with slicers and charts
Data visualization with graphs, heatmaps, and KPI indicators
Troubleshooting data inconsistencies and improving data quality
Tools Used:
Microsoft Excel
Power Query (if required for more complex data cleaning)
Project Deliverables:
Cleaned and structured data ready for analysis
Fully interactive Excel dashboard
Insights and visual representations of key metrics (e.g., sales trends, customer data, etc.)
Target Audience:
Businesses or individuals looking to make informed decisions through clean and visually represented data.
Project Outcome:
The client will receive a well-organized data set and an interactive, professional dashboard that showcases important trends and metrics.
Like this project
Posted Jan 30, 2025
This project involves cleaning raw data and transforming it into a structured, insightful format. I’ll utilize advanced Excel functions to clean, manipulate.