Data Science and Visualization Expert
Data visualization engineer, Data Analyst, BI Expert
Transforming data into insights that drive growth with AI
Transforming complexity into clarity through data.
Transforming complexity into clarity through data.


End-to-End Data Solutions
End-to-End Data Solutions


View more →
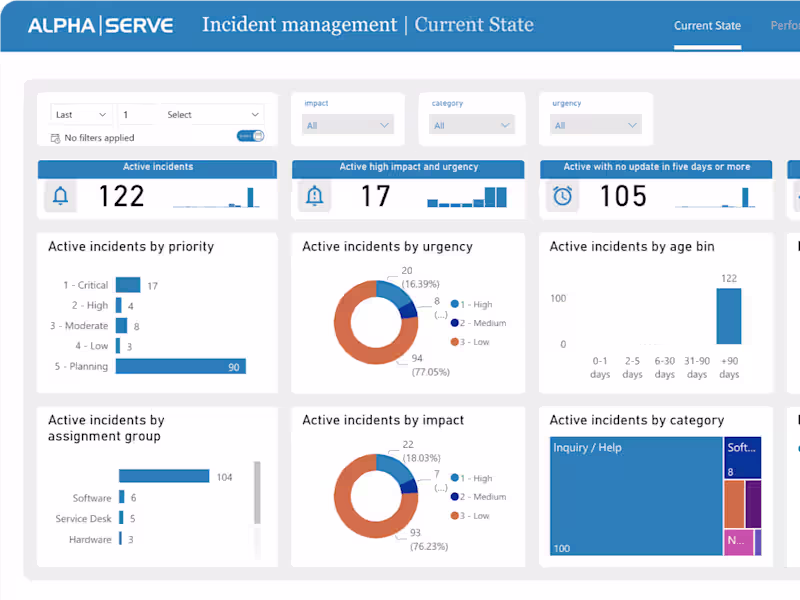
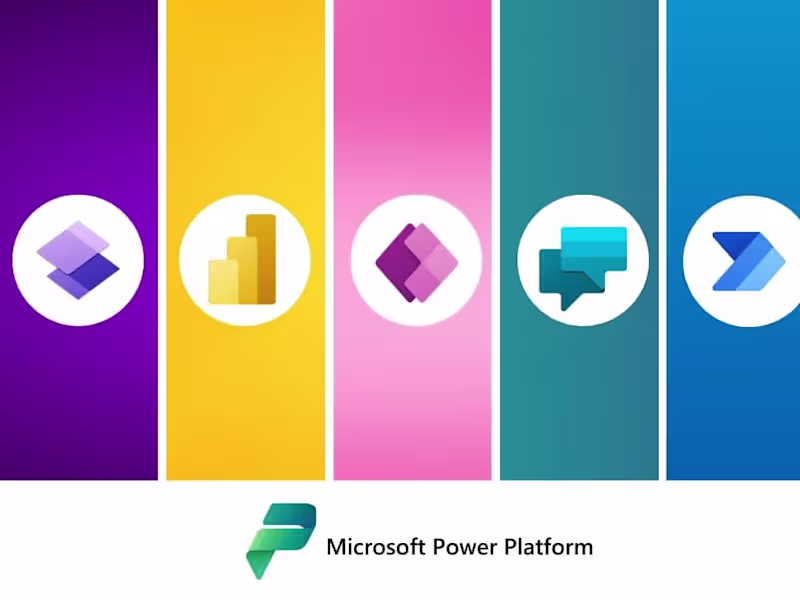
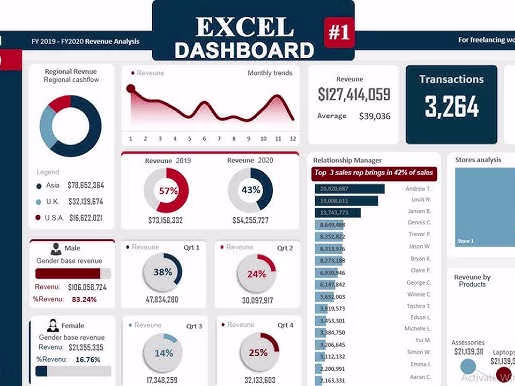
Data Analyst & Visualizer | Power BI, Excel, VBA
Data Analyst & Visualizer | Power BI, Excel, VBA


Expert Data Analyst & Bookkeeper Since 2017
Expert Data Analyst & Bookkeeper Since 2017
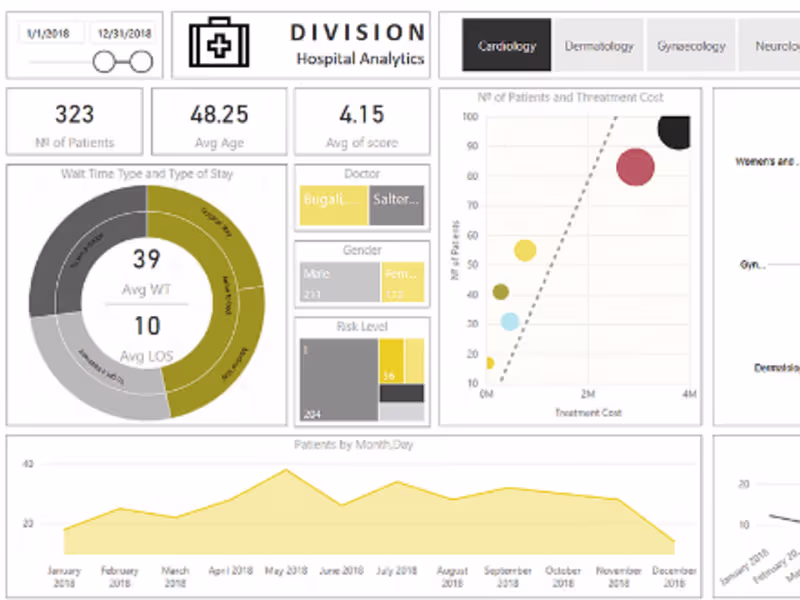
Turning Raw Data into Valuable Insights
Turning Raw Data into Valuable Insights

View more →