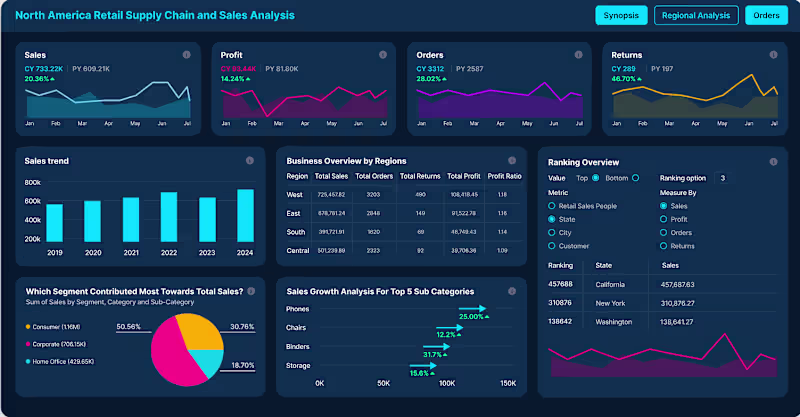
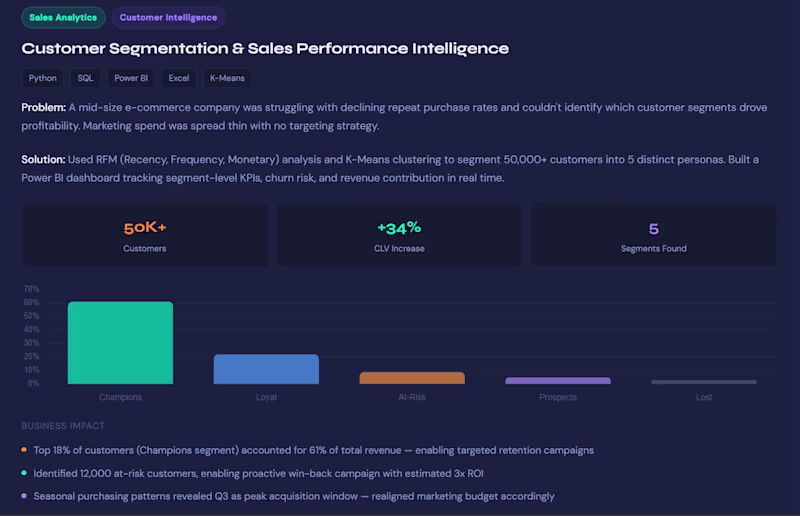
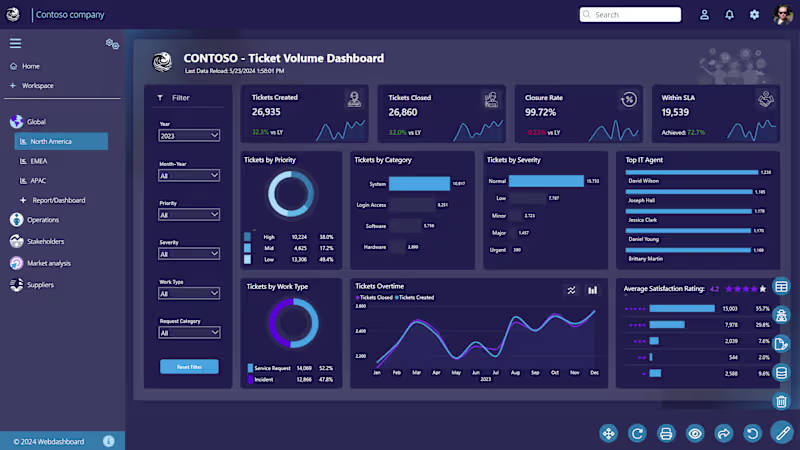
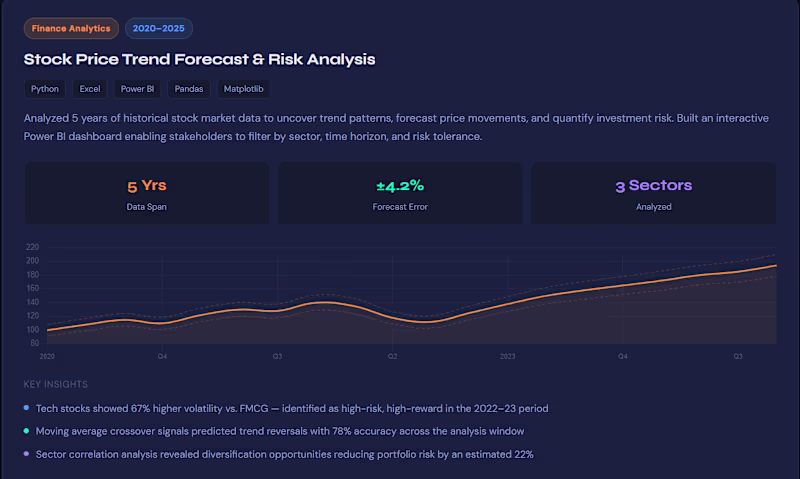
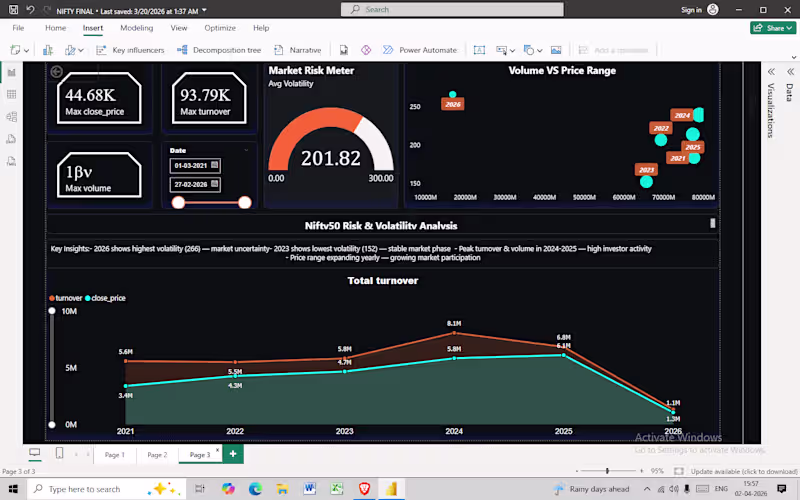
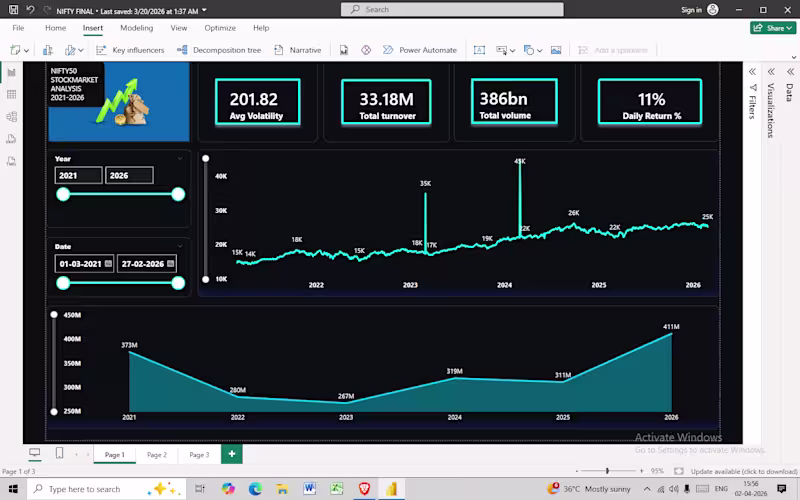
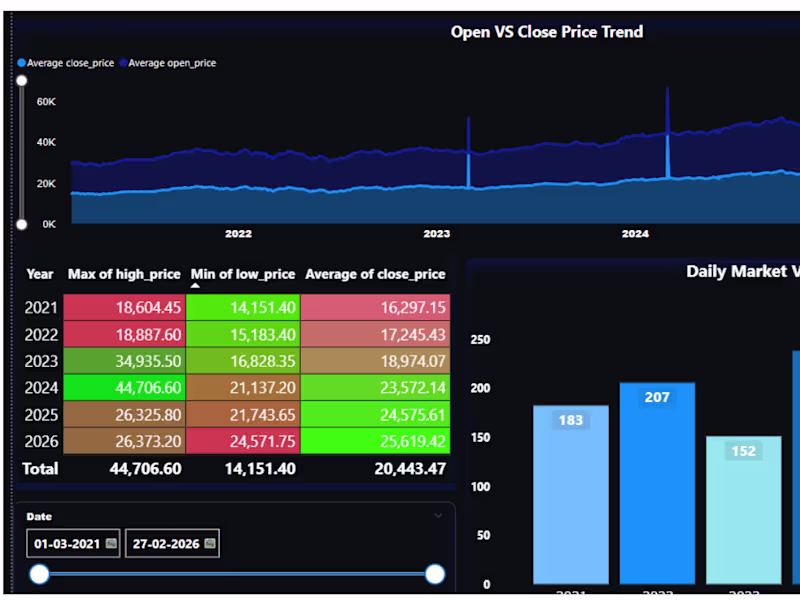
Data Insights & Dashboards Curated for Success
Data Insights & Dashboards Curated for Success


View more →
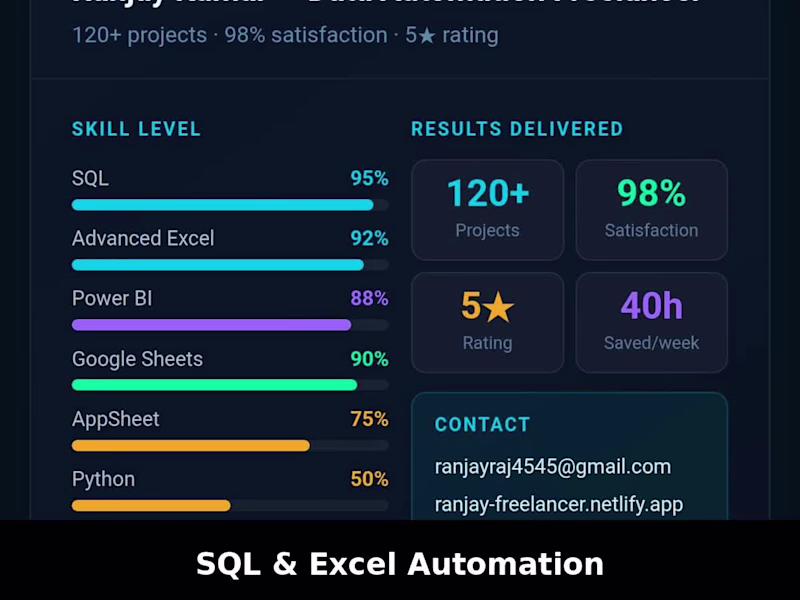
Data Analyst | SQL & Power BI Specialist
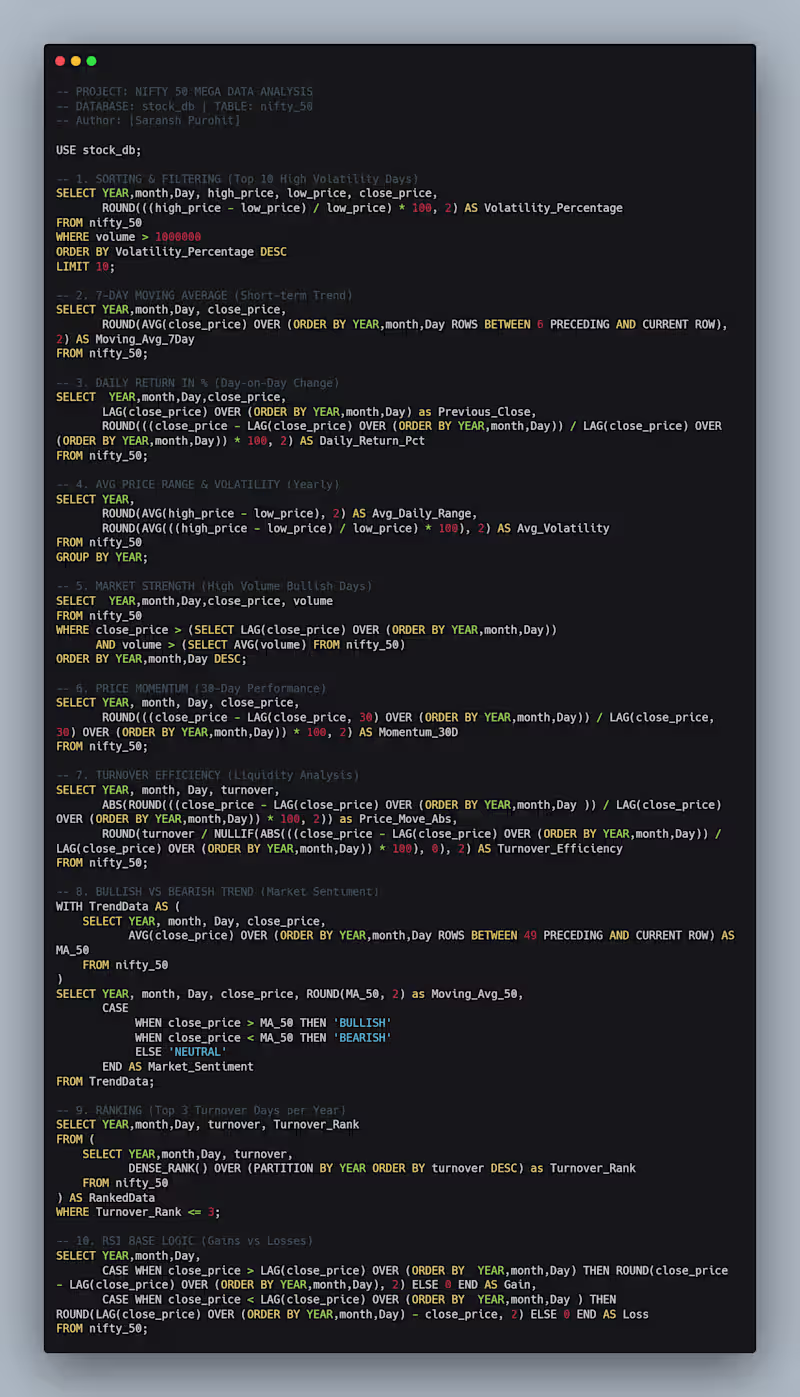
Data visualization engineer, Data Analyst, BI Expert
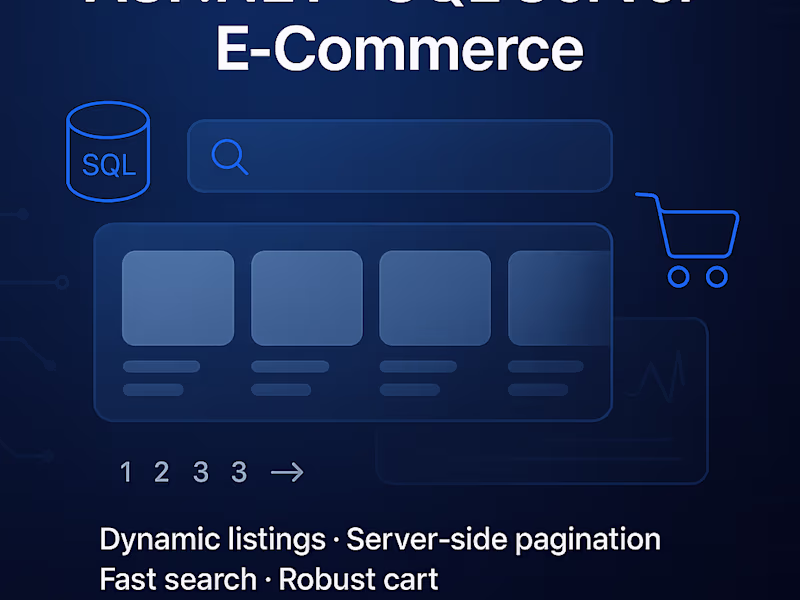
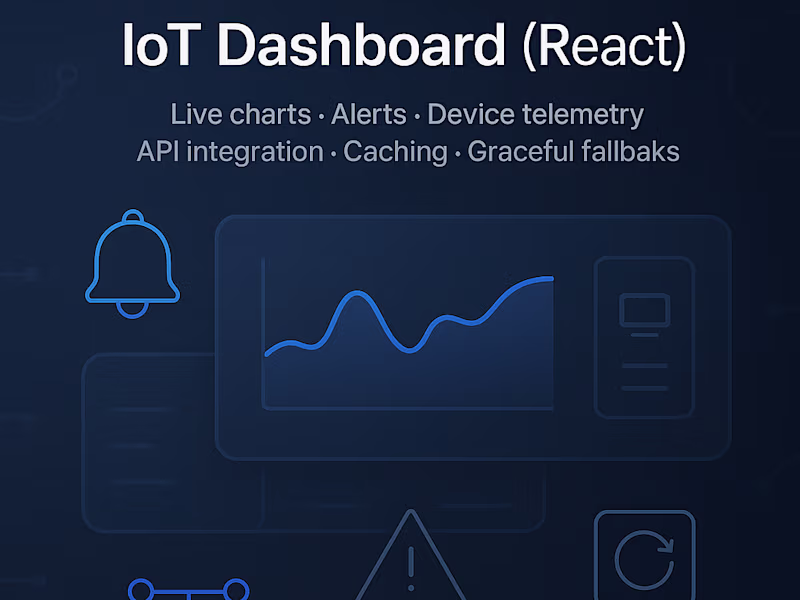
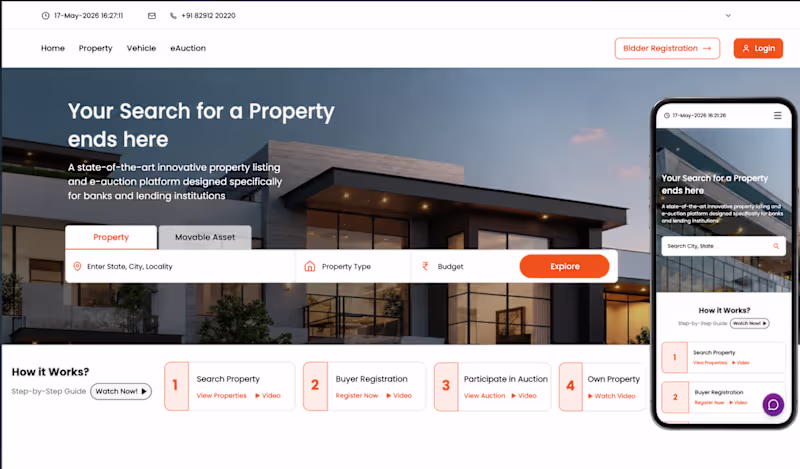
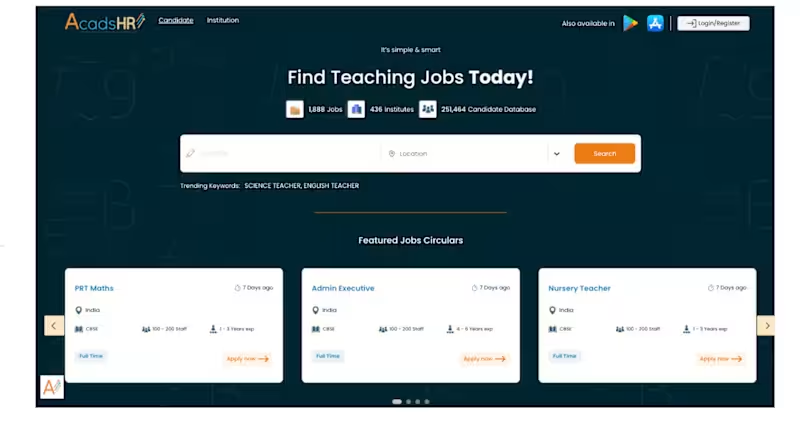
Full-Stack Developer (Angular • .NET • React Native)
Full-Stack Developer (Angular • .NET • React Native)
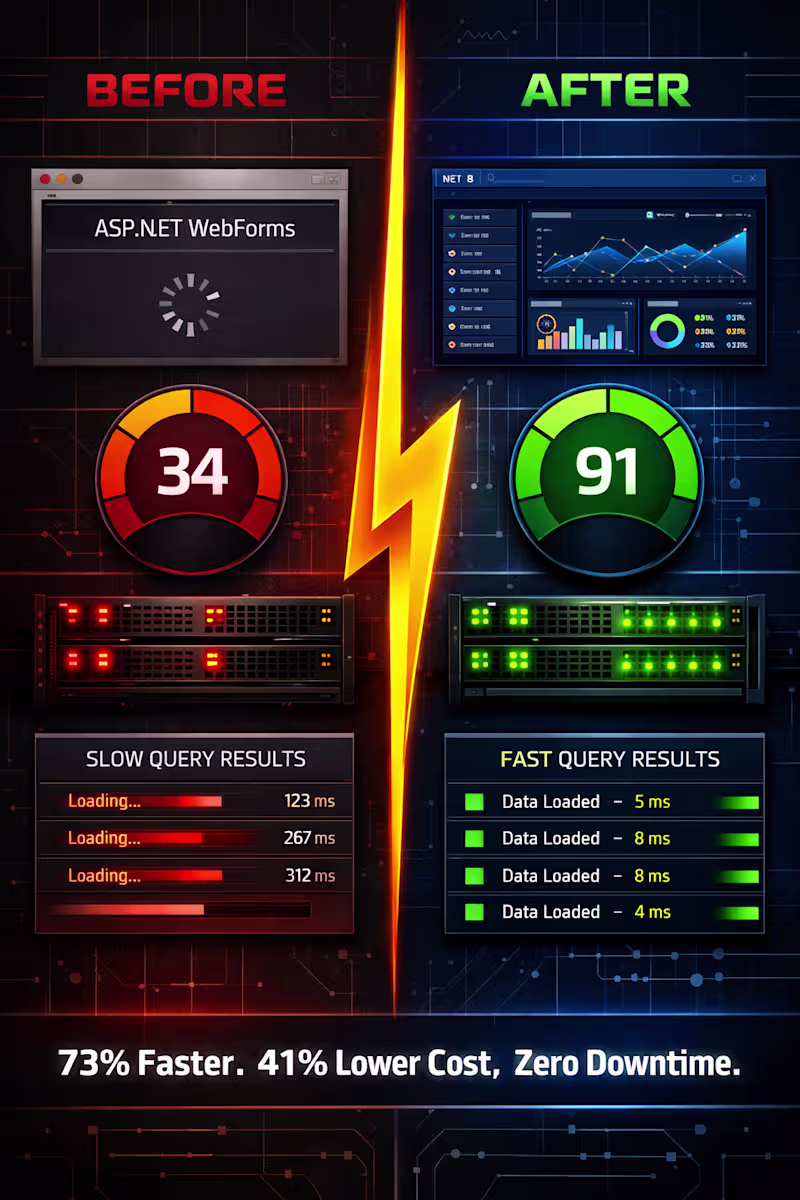

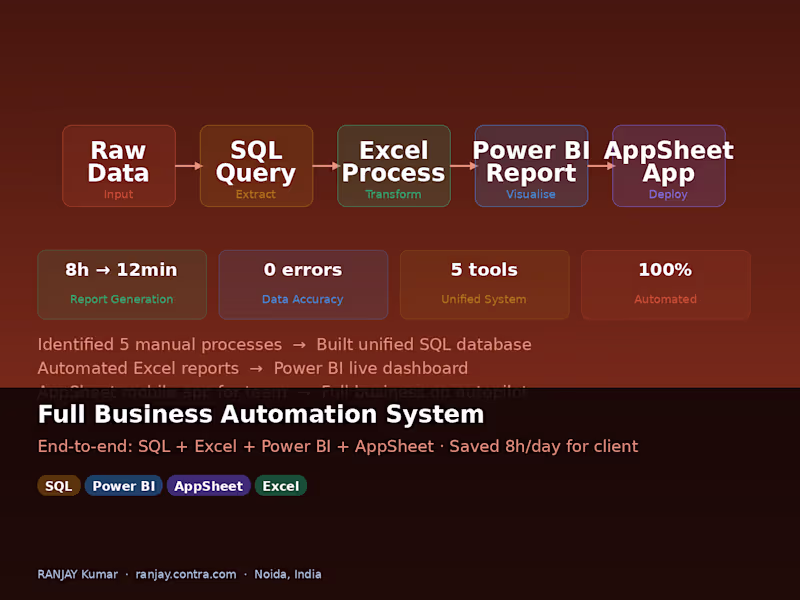
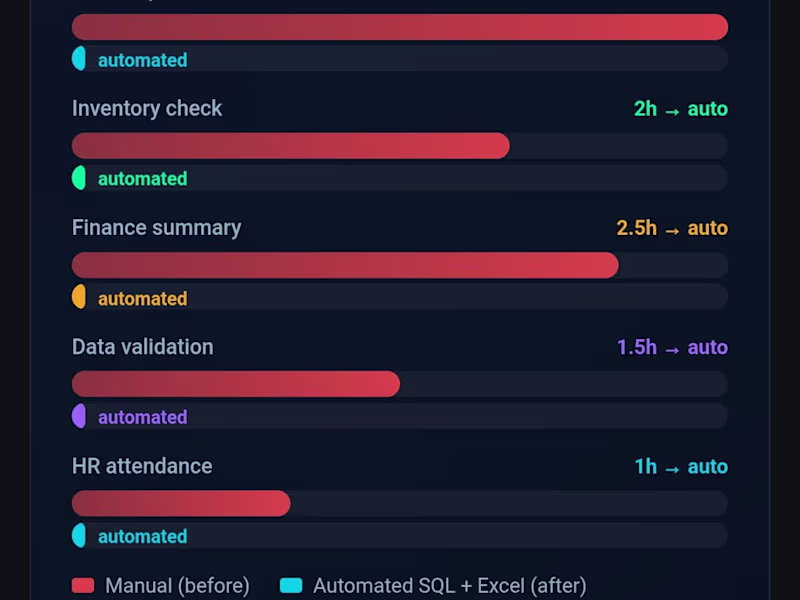
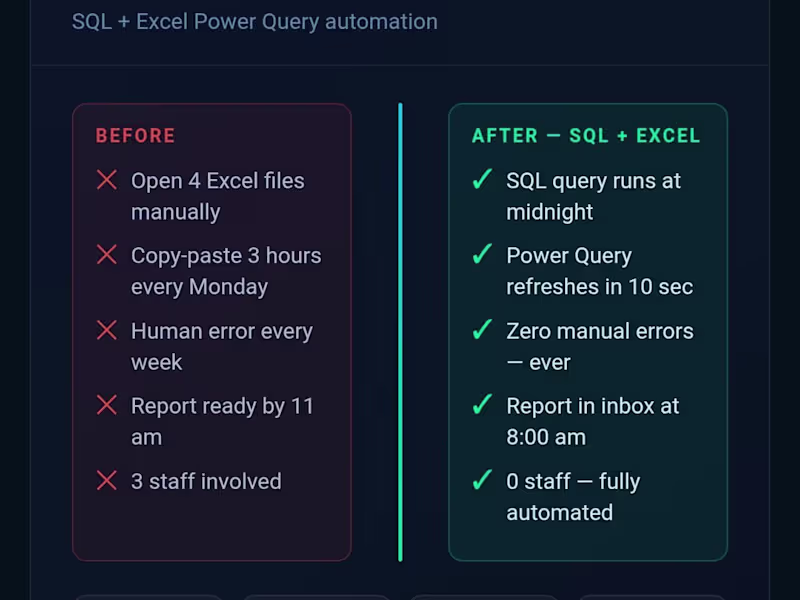
I automate processes and build dashboards that save time
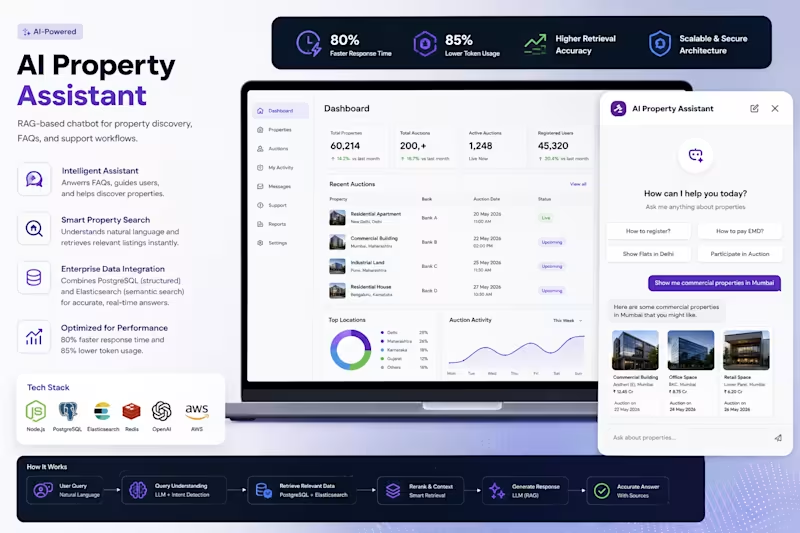
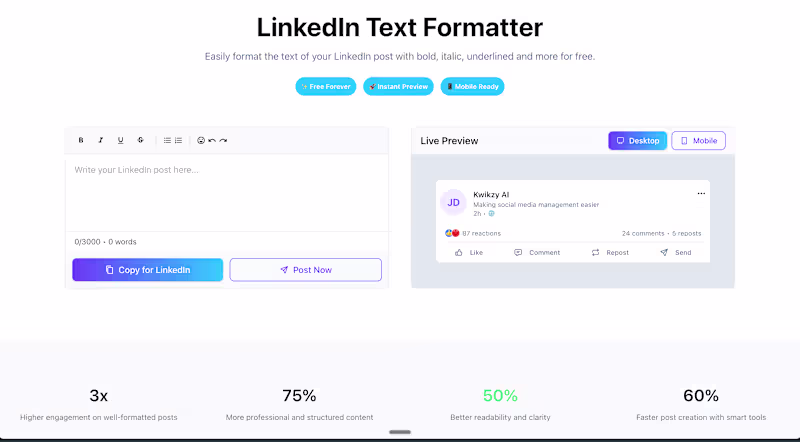
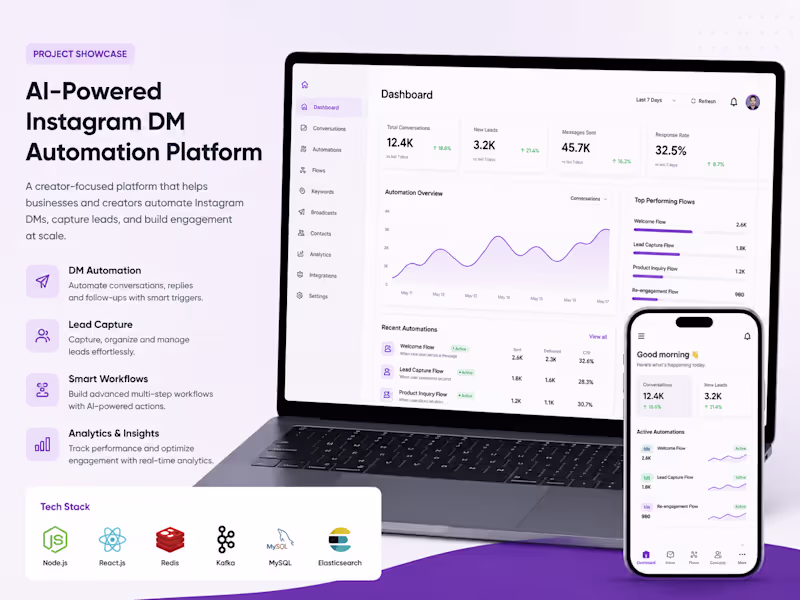
Full-Stack Developer building AI-powered products
Expert & Passionate Fullstack Engineer 8+ Years Experience
Expert & Passionate Fullstack Engineer 8+ Years Experience


Transforming data into insights that drive growth with AI