Data visualization engineer, Data Analyst, BI Expert
Data Scientist: Python, RStudio, ML, BI, NLP, DL, LLM
Data Scientist: Python, RStudio, ML, BI, NLP, DL, LLM
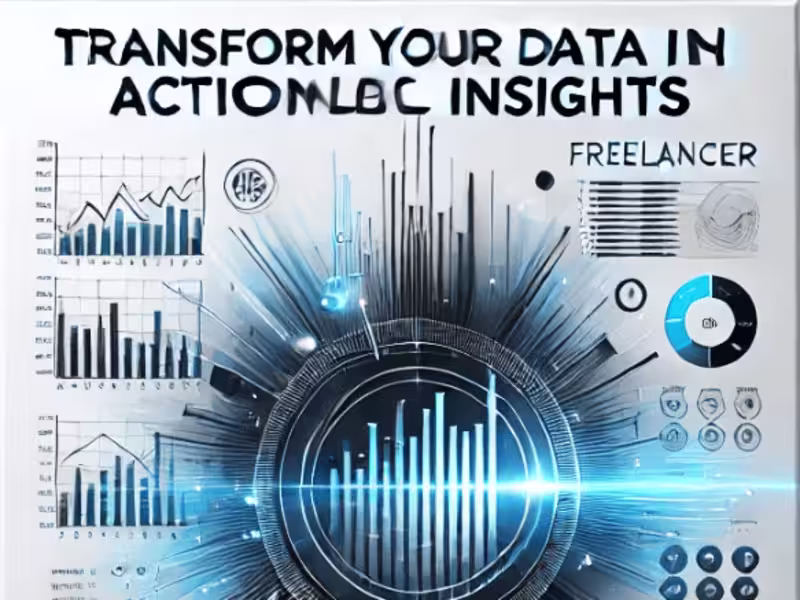
Transforming data into insights that drive growth with AI
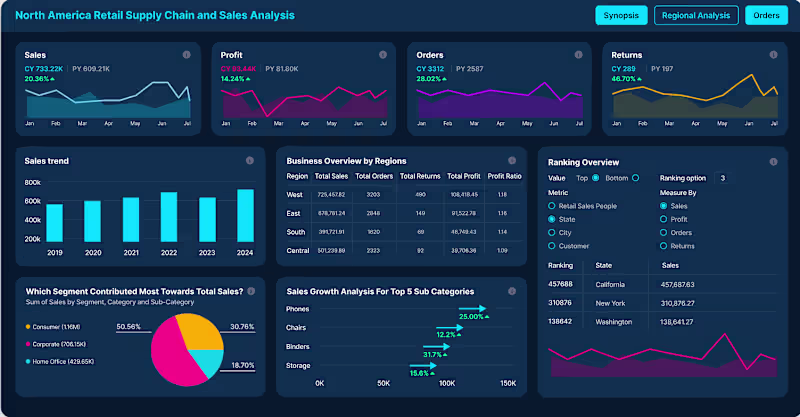
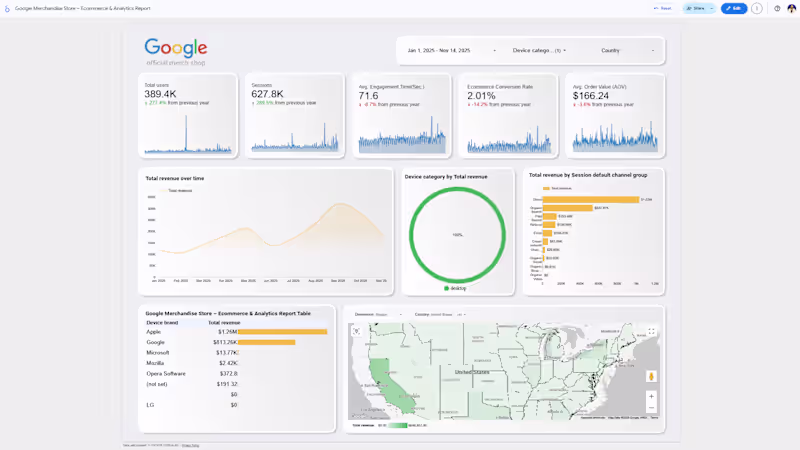
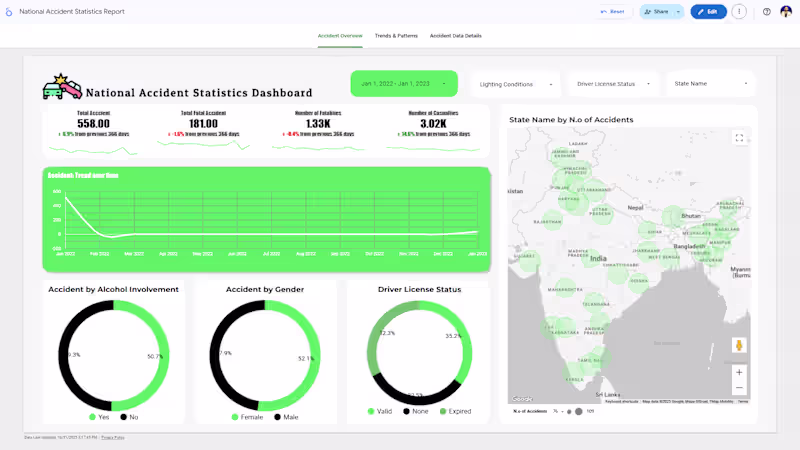
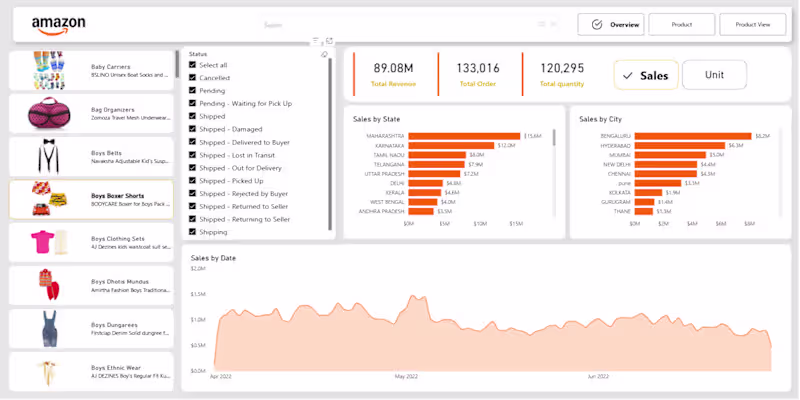
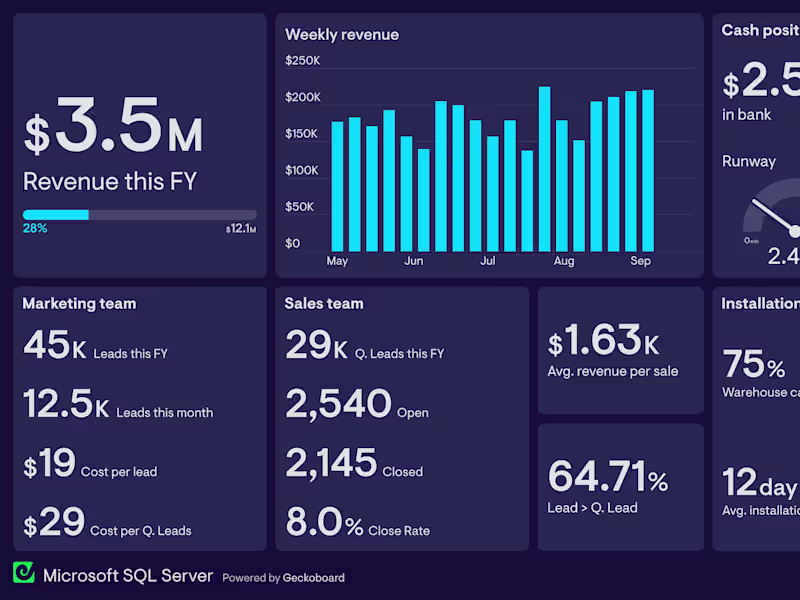
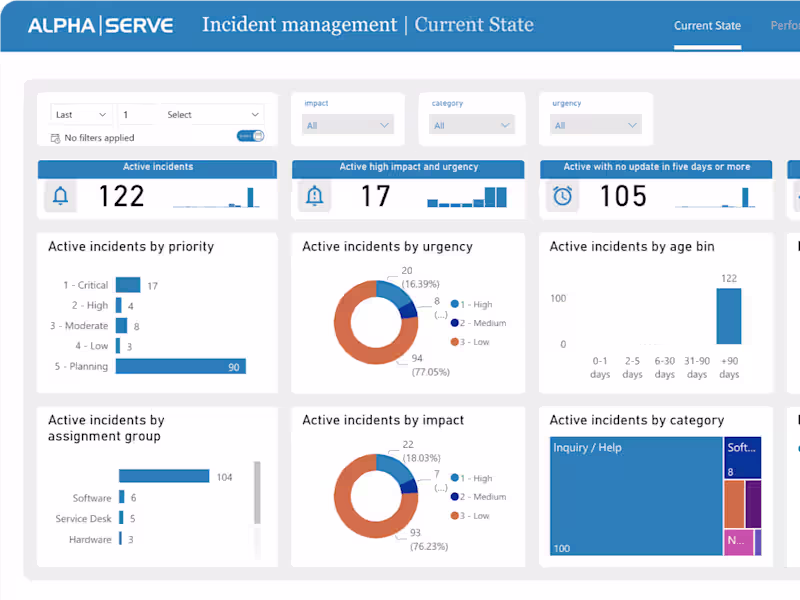
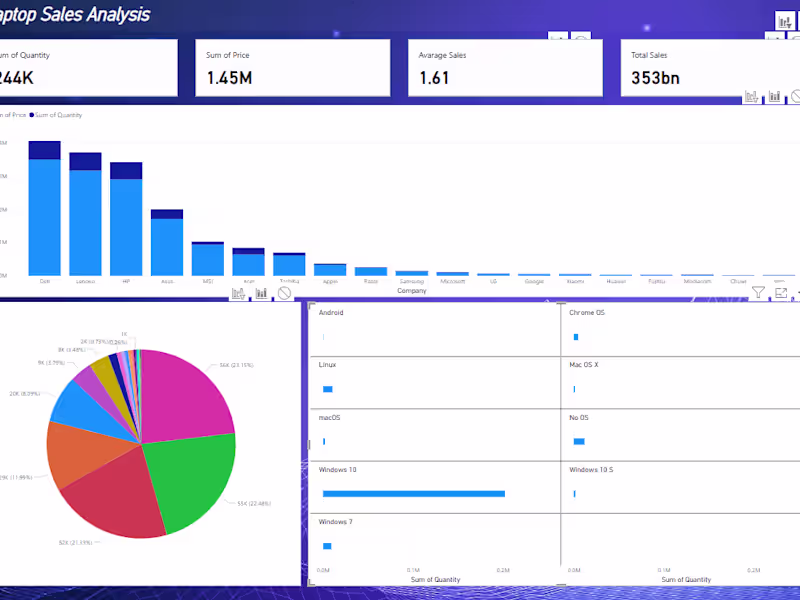
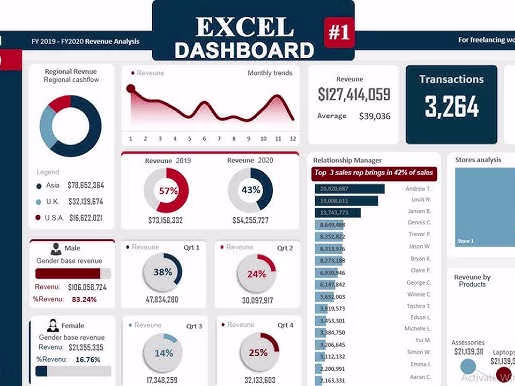
Data Insights & Dashboards Curated for Success
Data Insights & Dashboards Curated for Success


View more →
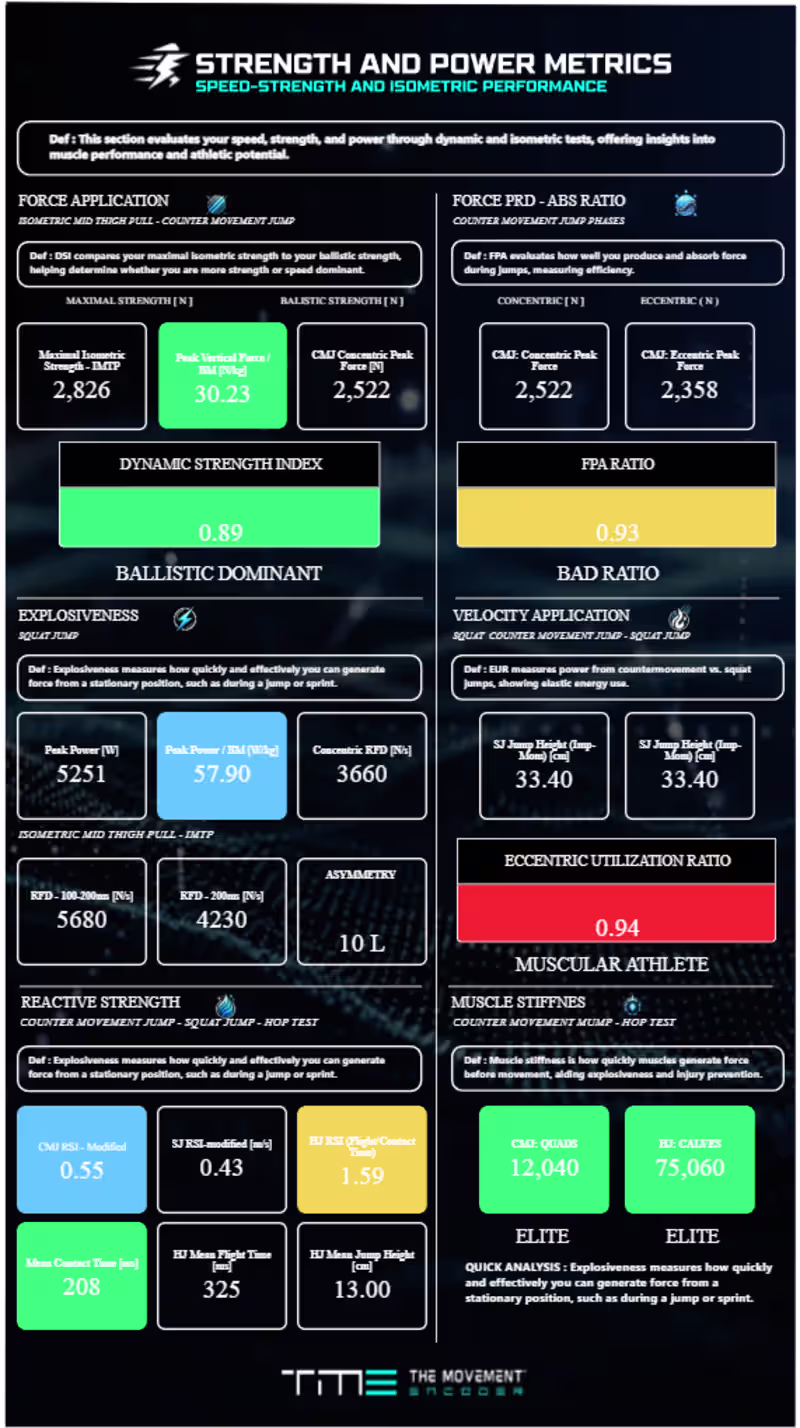
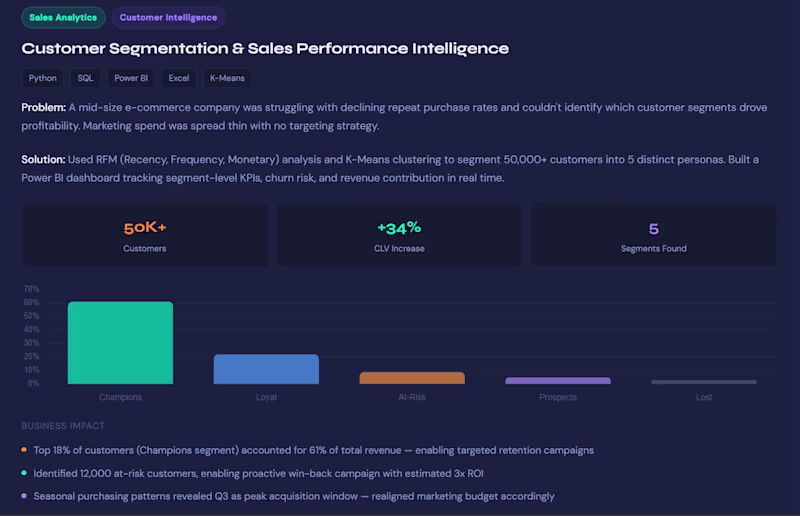
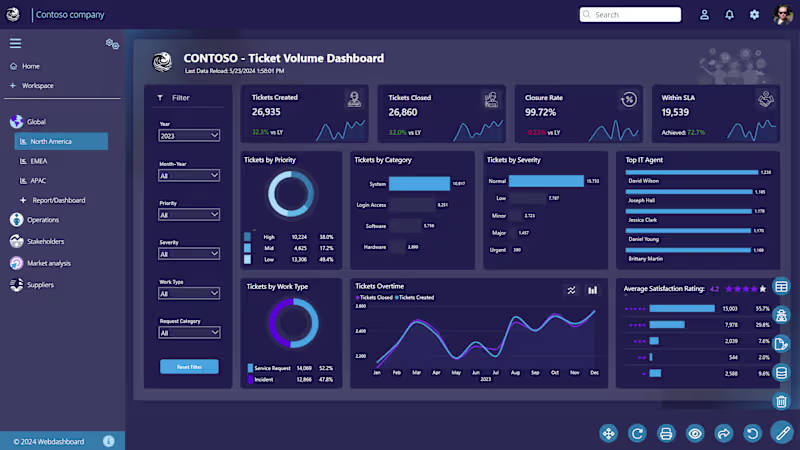
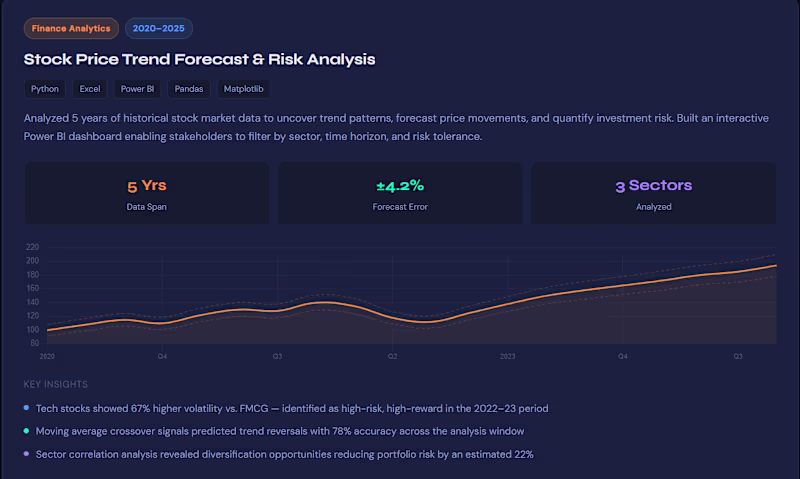
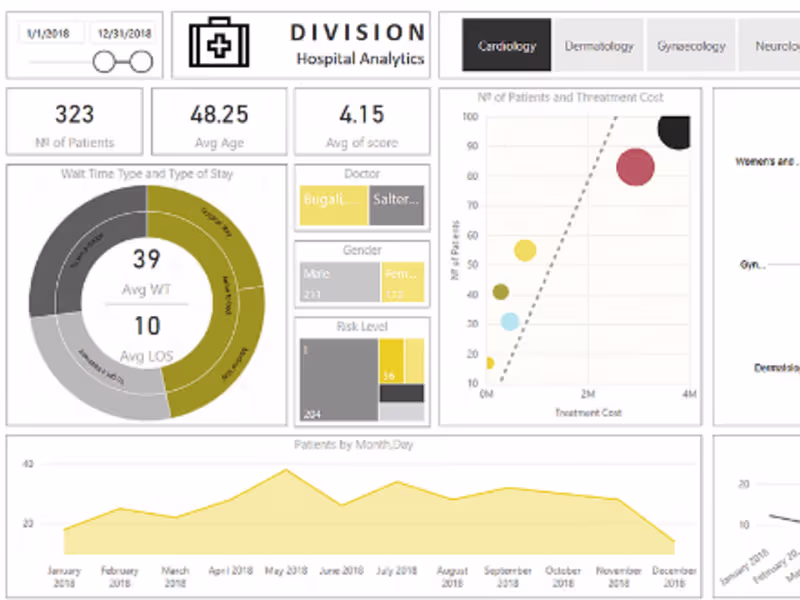
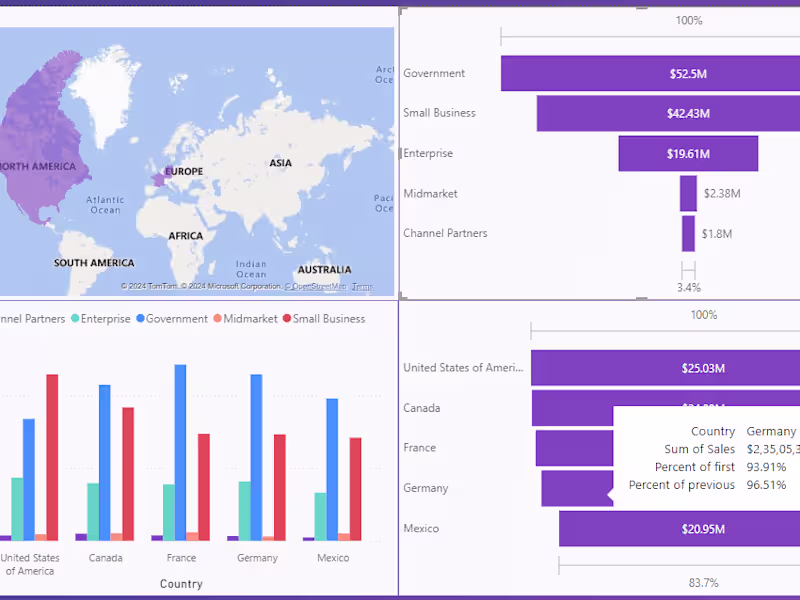
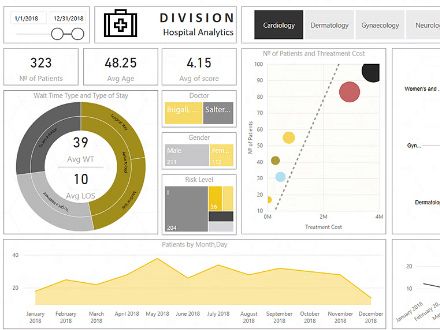
End-to-End Data Solutions
End-to-End Data Solutions


View more →
Expert Data Analyst & Bookkeeper Since 2017
Expert Data Analyst & Bookkeeper Since 2017
Turning Raw Data into Valuable Insights
Turning Raw Data into Valuable Insights

View more →
Creative Director AI video and Animation Production