Ticketmaster: UX Research, Storyboarding, & Design


About Ticketmaster: Ticketmaster is the global leader in ticket management for large-scale sports and entertainment, specializing in sales, marketing, and distribution. As the largest ticket marketplace in the world, Ticketmaster is also the number one event search platform trusted by billions of live event fans. Ticketmaster powers artists, promoters, venues, campuses, and more with the world's leading enterprise-grade ticketing software and services, selling over 500 million tickets annually in 30 countries worldwide and partnering with over 12,000 global clients.
Role: At Ticketmaster, I led the UX Research, Interviews, and Storyboarding exercises to map user pain points, synthesize the findings, and suggest features and optimizations based on the current user experience of seat selection and purchase for our new interactive seatmap. I led the design team through the storyboarding exercise of the new end to end seatmap experience.
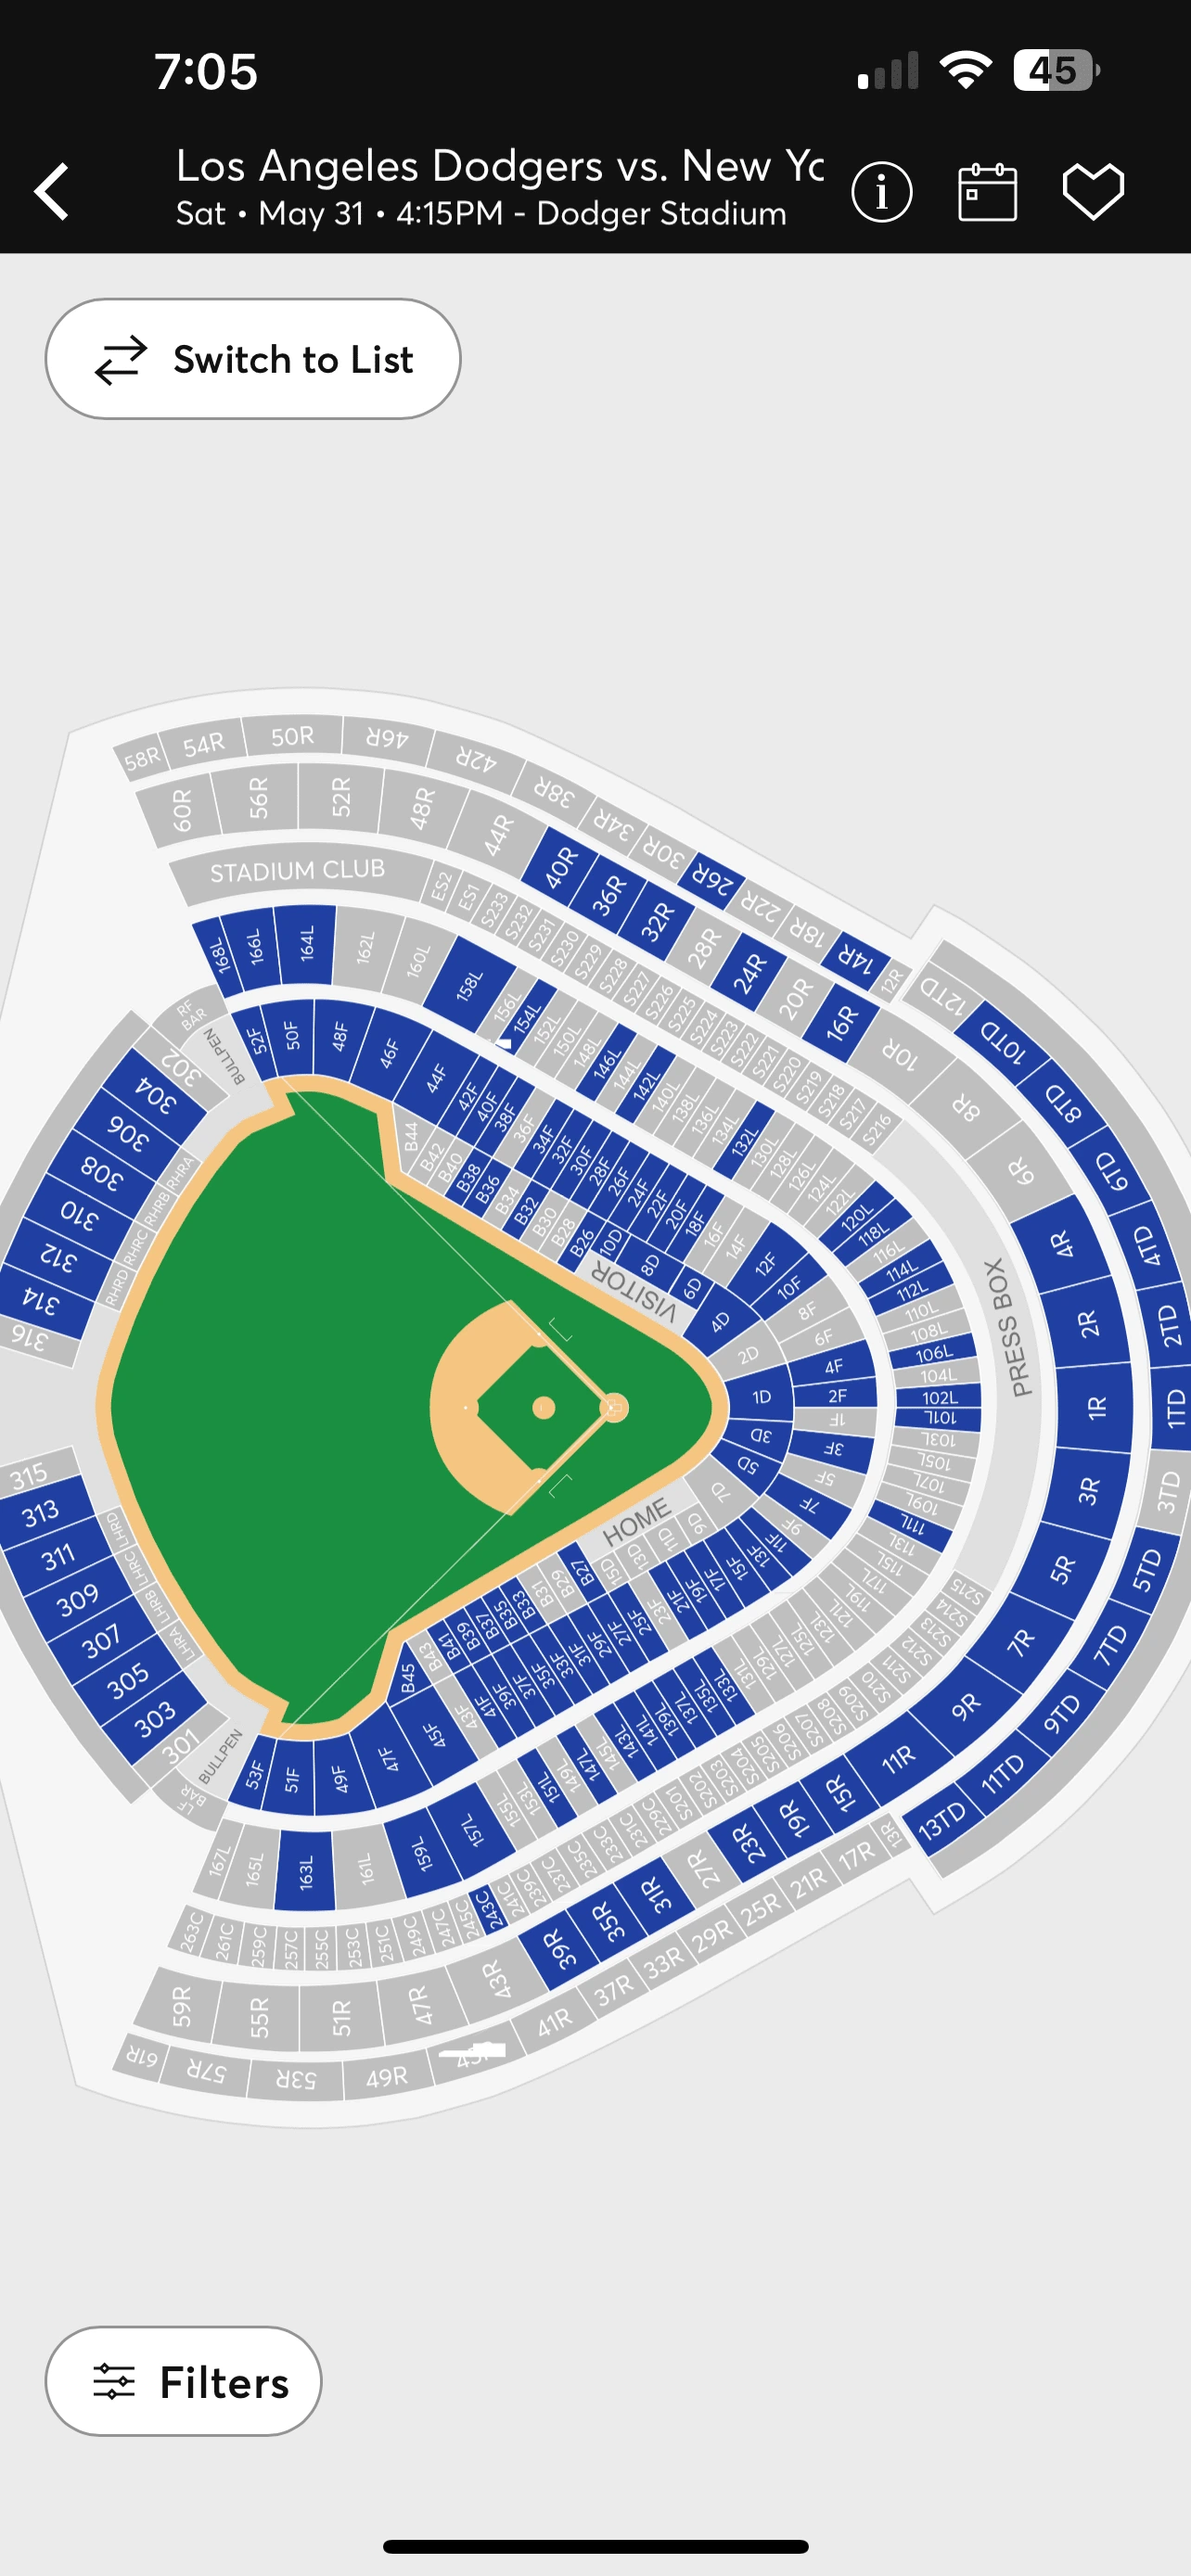
Project: I managed Ticketmaster's global flagship mobile product strategy, vision, and UX execution for Ticketmaster Mobile Applications. The goal was to identify customer pain points based on purchase behaviors with a focus on the interactive seatmap for live and on-demand events adn translate these data points into user needs to develop an engaging user experience.
Detailed Product Development Process I Evangelized in Partnership with Design and Engineering
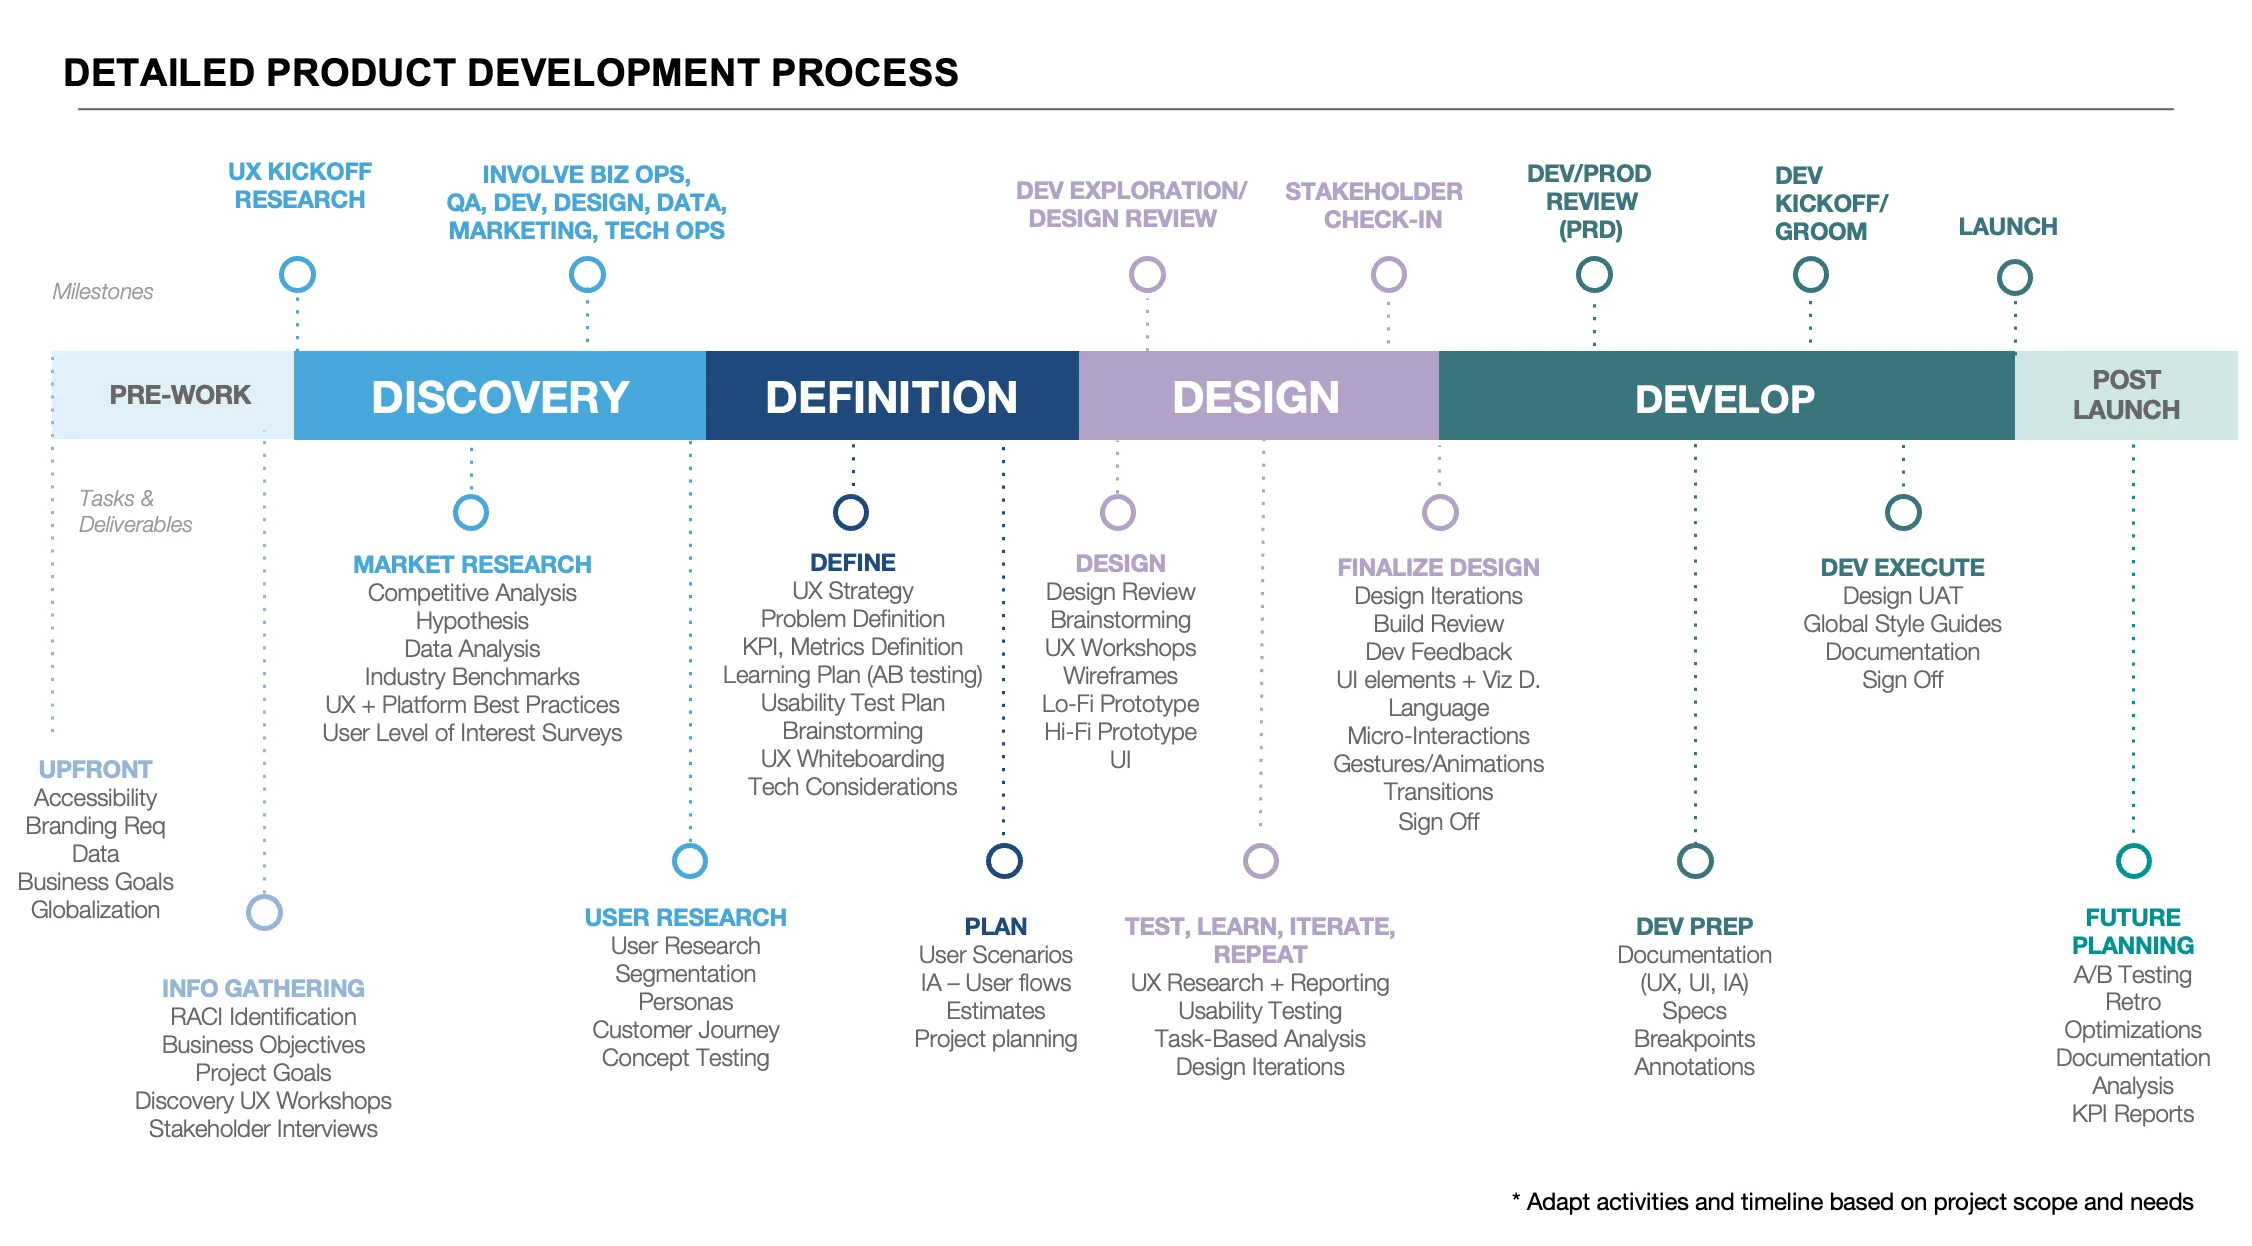
Project Scope: I led the end to end product development process, including the UX Research.
Phase 1: Defining the Problem
UX Research: At the information gathering stage, I drove the UX research and Storyboarding process by identifying the top 50 concert attendees in the Los Angeles area. I contacted each participant, and brought them into our building for UX Interviews. I structured the interview script to understand how users behaved and purchased during high-demand and low-demand Ticketmaster events. We combined this exercise with user surveys, analytics and interviews. I analyed correlations, commonalities, and differences to create a value proposition canvas highlighting user pain points.
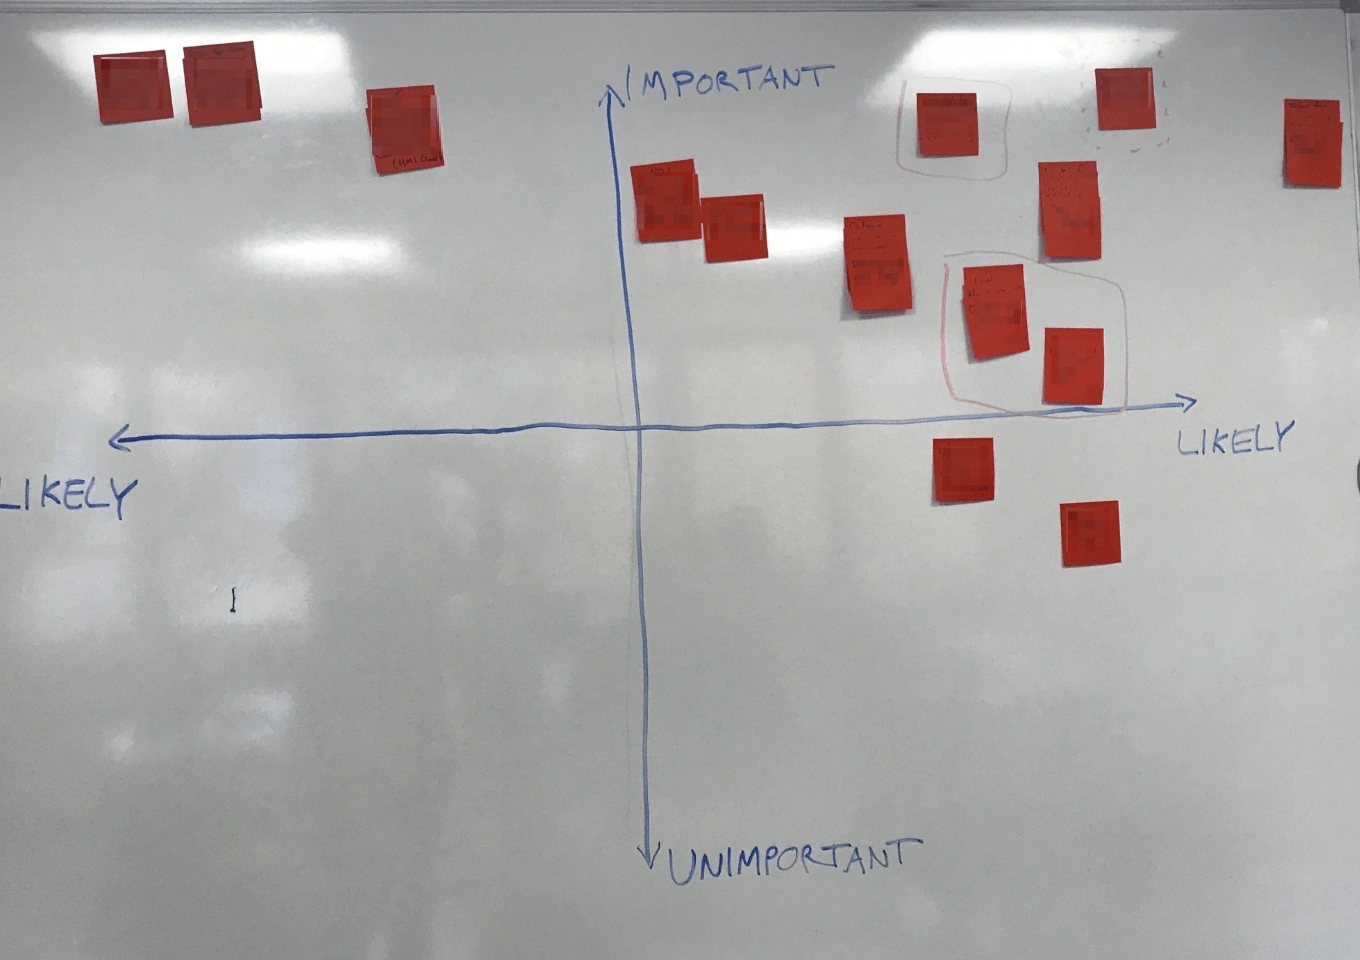
Data Synthesis: From the UX research process to the end-to-end technical execution, I synthesized the data collection from the customer interviews and worked with design and product to identify the areas of the product could be optimized. We leveraged a Hopes and Fears Coordinate system to identify top areas of concern to the users.
Takeaway: We were able to validate our hypothesis. Next, we needed to figure out what the solution to the problem would be.
Phase 2: Defining the Solution
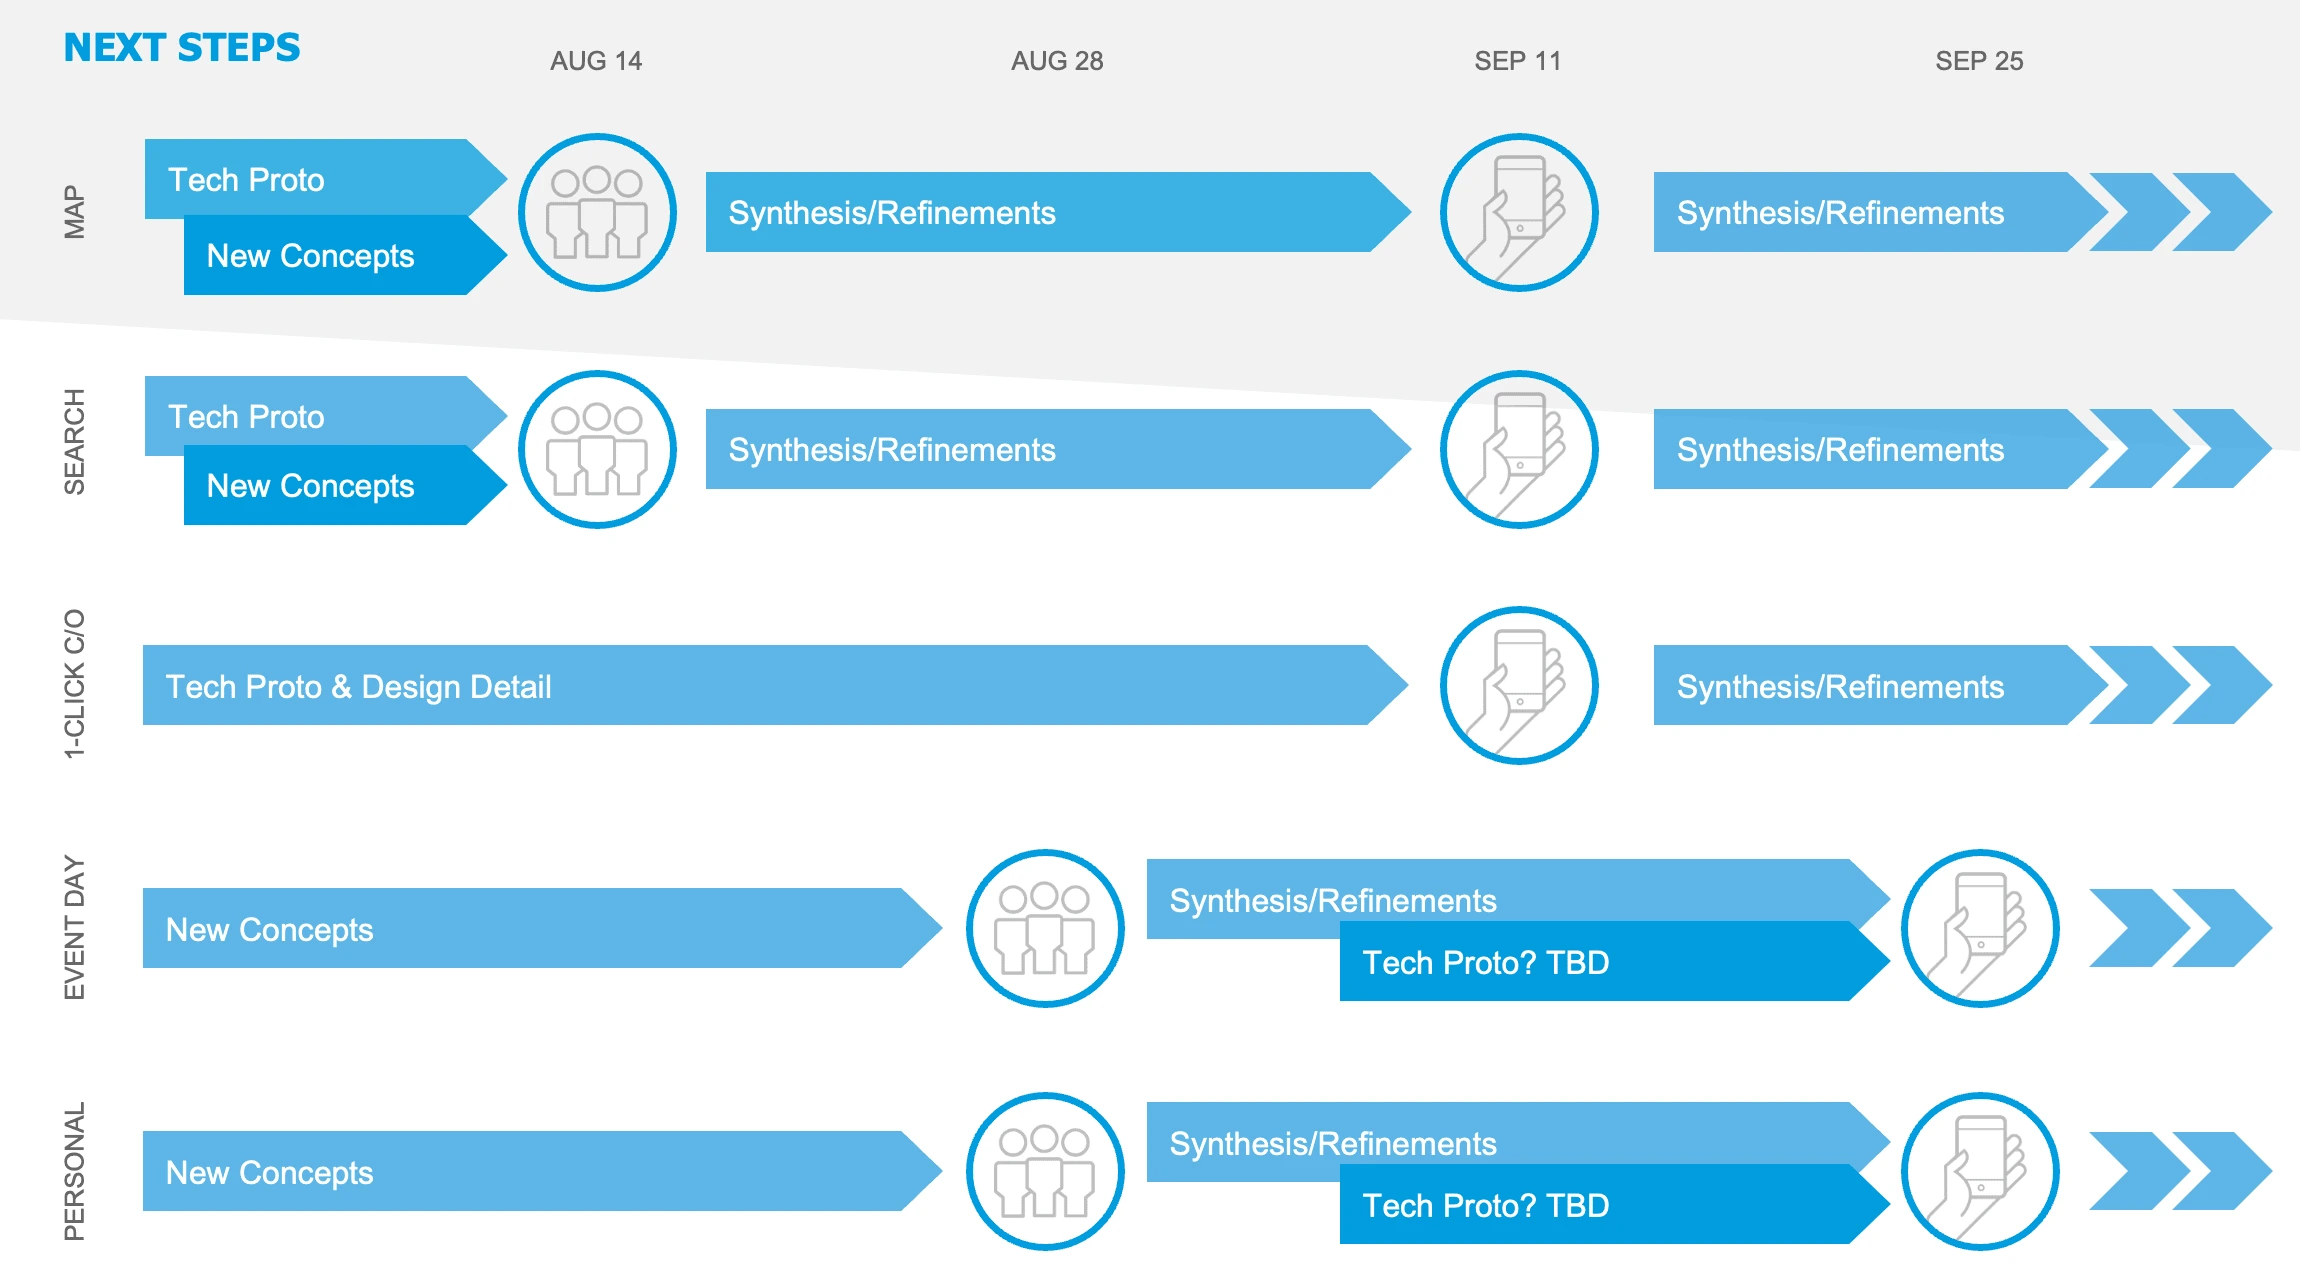
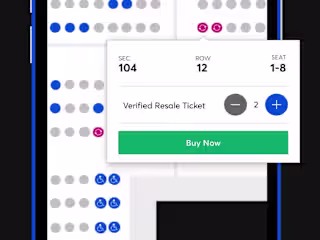
Storyboarding Exercise: I held a storyboarding session with the design and product team to identify the end to end flow based on the suggested optimizations from the pain points collected. I was responsible for the team timeline as well as the delivery of the revamped mobile application and new interactive seatmap across all of the artists and venues. Our exercise worked in chronological order from the onsale to the purchase and resale option. Everyone participated in the exercise mapping out where there was opportunity to add solutions for the areas of fricton that customers were experiencing.
Process: I worked with the design team to identify the step-by-step approach across the user journey. For every pain point that was identified, we prioritized the action items that could be taken to optimize engagement, conversion, and revenue which were he primary business drivers. From onboarding, purchase selection, purchase, and re-engagement, the journey map was created. I worked with design on identifying the key focus areas for improvement along the journey based on the iterative approach. We iterated on different versions of the seatmap and brought back the same users from the initial research to get their feeback on the updated prototype to understand if the seatmap met their customer needs for different scenarios for primary, resale, high demand and low demand use cases. We were able to use their feedback to continue to iterate on the product before we started the development process.
Phase 3: Prioritizing the User Needs
I worked with the team to come up with solutions for optimization along the user journey. We worked to score each of the solutions by voting with dots on the board. The highest number of dots that were voted in were utilized as the solution to the problem set. We then came up with the list of top solutions based on the following criteria using a scale of 0 (none) -3 (highest).
Business Impact
Financial Cost
Implementation Effort
User Satisfaction
Phase 4: Design Sprints; Low Fi Wireframes and Prototyping
Create low-fi wireframes that address the painpoints by experimenting with the top solutions for the user journey that were prioritized in our early sessions.
2. Conducted in-person testing with the various prototypes to gather quantitative. and qualitative data.
3. Analyzed data from user testing to iterate/improve low-fi designs.
4. Created mid-high fi prototypes and conducted more user testing, included unmoderated testing to compare the user satisfaction of the prototype verses the benchmarked data.
Phase 5: User Testing, Iterations, Defining the MVP
User feedback surfaced that having a toggle between seatmap and the list results offered additional user friction.
We solutioned to surface a single view of seatmap and list results which offered reduced friction for identifying the list on the map.
We then prioritized the features to include in the MVP based on user feedback and interaction within our timeline for delivery.
Once we got closer to our iterations through user feedback we then got our designs ready for development. We annotated the designs and worked with engineering on identifying the MVP for launch.
Phase 6: Launch and Tracking Metrics
A/B Testing & Iterative Launch: We released the seatmap through A/B testing and a phased approach to reduce the risk of launch. We watched over the primary metrics and performance to ensure we had no issues impacting the users at 5%, 10%, etc. We iteratively rolled out the release to a greater scale once we had deep confidence that our conversion rate and secondary metrics (Add to Cart, ARPU) was improving.
Phase 7:
Results: After significant testing and launch, we had successful results over time when comparing YoY results. We increased Android YoY MAU's by 22% and YoY tickets sold increased by 26%.
Like this project
0
Posted Dec 2, 2024
At Ticketmaster, I led the UX Research studies and storyboarding, leveraging Interviews, User Testing, Surveys, and Data to identify user problems,
Likes
0
Views
13
Timeline
Jan 1, 2014 - Feb 1, 2018
Clients
Ticketmaster


Ticketmaster: Built Interactive Seatmap for Conversion Lift

Machine Learning for Ticketmaster Recommendations
UX/UI Optimization for Nurtur
Go2Bank Go To Market Strategy