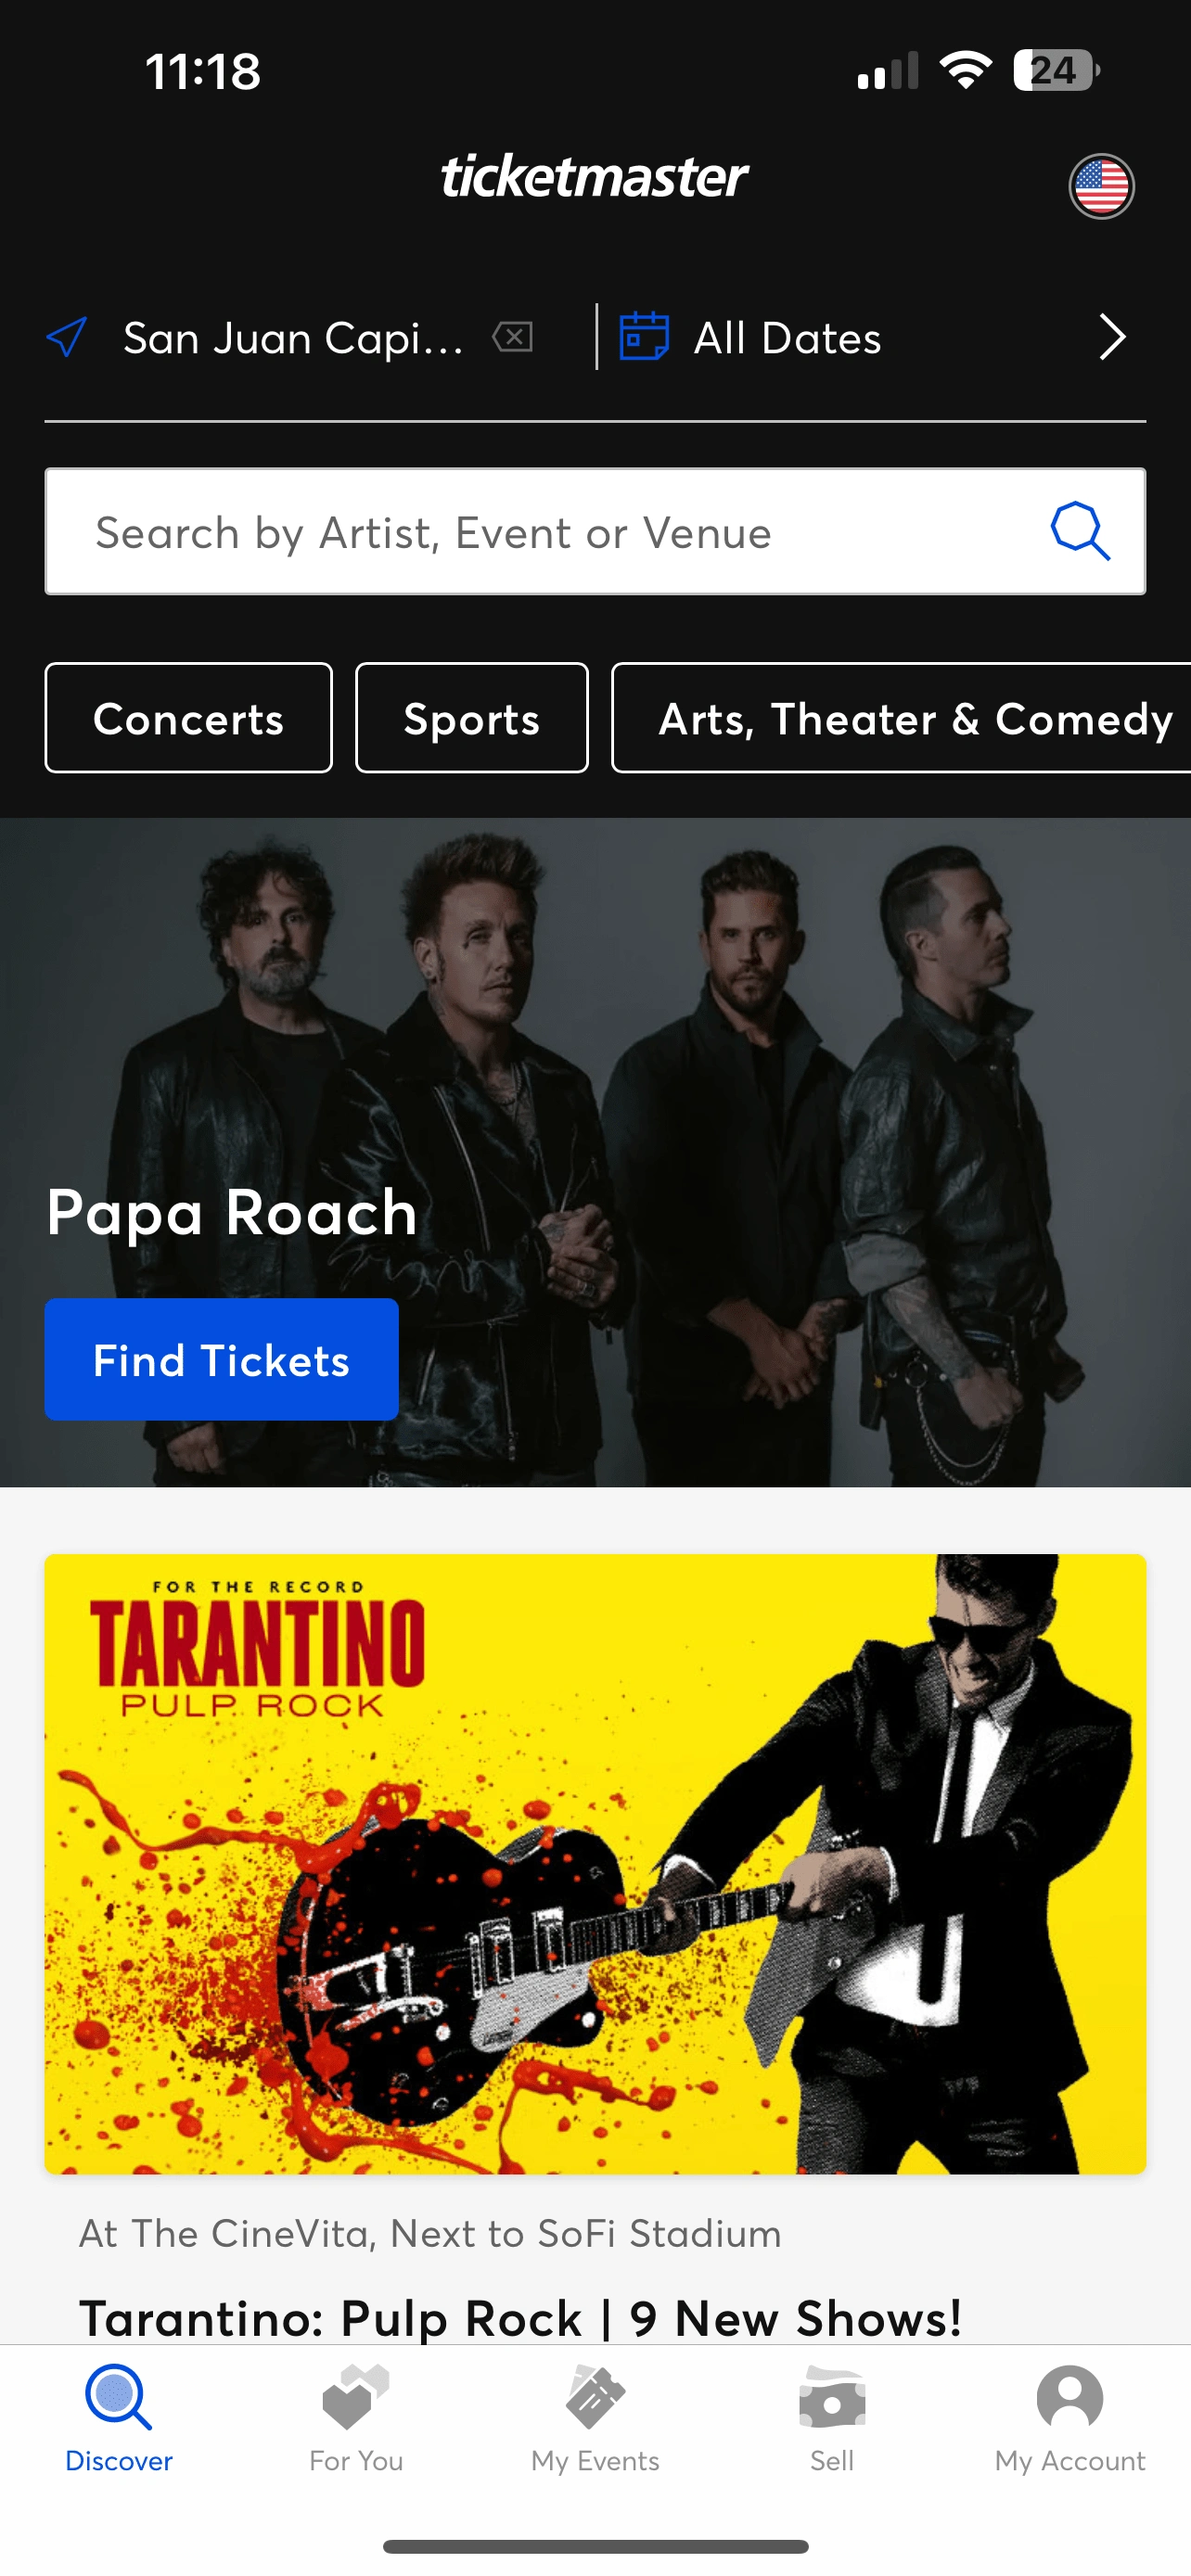
Machine Learning for Ticketmaster Recommendations

Krisha Zagura

Role: At Ticktmaster as the Sr. Director of Product, I led the end to end mobile applications for iOS and Android on the E-Commerce platform for 11M+ users globally. I managed a team of 5 product managers and was a cross functional stakeholder across design, front end and back end engineering, QA, marketing and business.
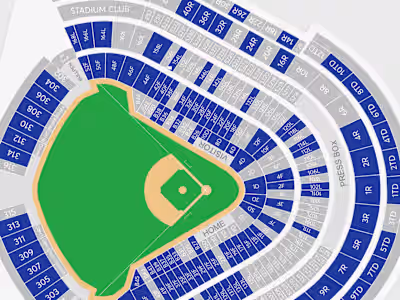
Problem: One of the core issues that our homepage event feed surfaced on the mobile applications was either repeated events or events that did not have specific relevancy to the user interests leading to consistent scrolling and a reduced Click Through Rate on the homepage, the core focus area for users. The frustration from our customers came from user reviews, customer service, and from the quantitative insights we focused on from the behavioral analytics. Users were dropping from the funnel, losing interest scrolling ultimately impacting our conversion rates and return visits. Users who had previosuly purchased an event would often see the same event return to their event feed.
Goals: Our goals were to optimize CTR (Click Through Rate) as a secondary metric and conversion rate and ARPU as our primary metric.
The Solution: In order to solve the event feed problem, I proactively partnered with the Data Science team to solution for a better output of recommended events for the user in order to garner greater traction to eliminate the repeated events and return events that were relevant for the user profile. We selected data attributes based on weighted values from purchase history, artists, sports events, genre of events, browsing history, and social affinities in order to surface event recommendations for the user which would be aligned with their user preferences to bring greater engagement and interest to the events that would be surfaced.
The Output: After iterating on the algorithm and testing with beta users, we A/B tested the rollout and started at 5% scale to understand how users were interacting with the new recommendations. I measured the KPI performance between the control and the variant. After seeing an uptick in click-through-rate and conversion over time, we increased the scale of the experiment to 10% and continued to see increased traction. I worked with Data Science to ensure that our KPI's and goals were being met and the outputs were consistently moderated and modified based on what we were seeing from the data and from the user feedback.
The Result: After continuing to see positive results over time, we gradually increased the scale of the experiment to 100% and continued the rollout of the new algorithm across iOS and Android. We continued to review user scrolling interactions to deeply understand how the event relevancy in the feed reduced scrolling length, scrolling time, and increased deeper interactions and engagement from finding relevant events faster.
Measuring Success: Within the first few months, improved our overall conversion rate by 1% by offering increased event types and reducing the repeated to our user base by offering a deeper level of engagement with events that were more aligned with the users affinities.
Like this project
Posted Apr 4, 2025
At Ticketmaster I worked with the Data Science team top optimize the event feed with recommendations and personalization.
Likes
0
Views
14
Timeline
Jan 1, 2014 - Feb 1, 2018

UX/UI Optimization for Nurtur
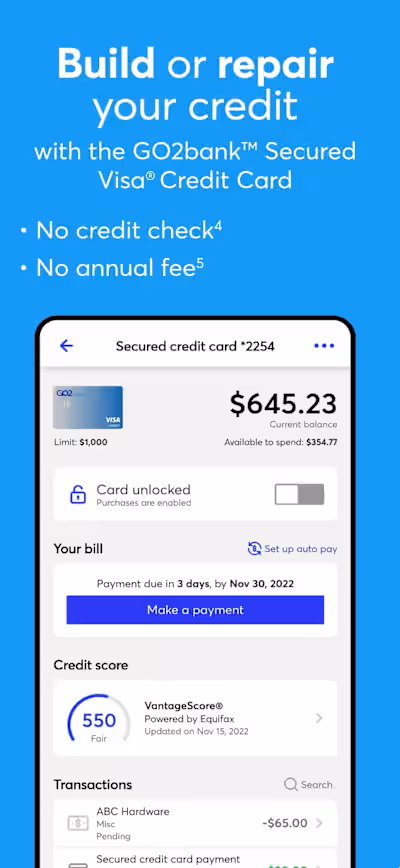
Go2Bank Go To Market Strategy & SEO Optimization
Green Dot: New Go2Bank Mobile Application
Ticketmaster: UX Research, Storyboarding, & Design