Excel Data Cleanup, PDF Conversion & Dashboard Reporting

Geethasree Naguboina


Like this project
Posted Dec 10, 2025
End-to-end Excel project covering data cleaning, formatting, PDF-to-Excel conversion, and an interactive dashboard for reliable reporting.


Excel Data Cleanup, PDF Conversion & Dashboard Reporting
📌 Overview
Many teams rely on Excel for reporting but struggle with messy data, broken formulas, and manual updates that slow decision-making.
In this project, I transformed raw, inconsistent Excel and PDF data into a clean, structured, and dashboard-ready reporting system—designed to support accurate analysis and faster business decisions.
This workflow reflects the type of Excel cleanup and reporting support I provide to operations, finance, and reporting teams.
🧩 The Problem
The data was:
Unstructured and inconsistent
Spread across Excel files and multiple PDFs
Difficult to analyze or update without errors
Time-consuming to maintain manually
Without cleanup and structure, reporting was fragile and unreliable.
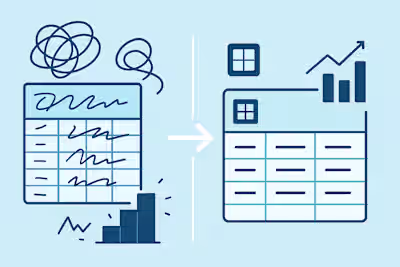
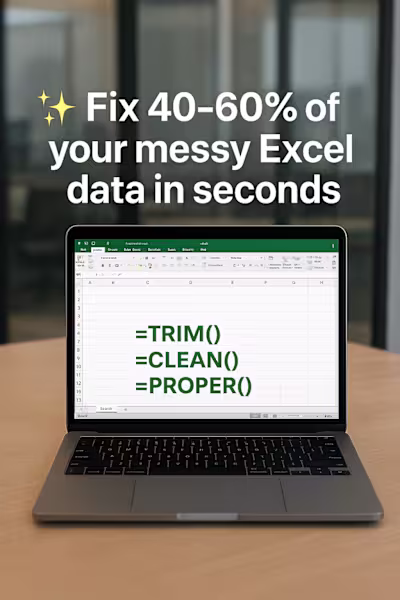
🧹 1. Data Cleaning & Structuring
I prepared the dataset to be analysis-ready by:
Removing duplicate and redundant records
Standardizing text formats, dates, and values
Cleaning spacing issues that cause formula errors
Organizing fields into a consistent structure
This ensured the data could support automation and accurate reporting.
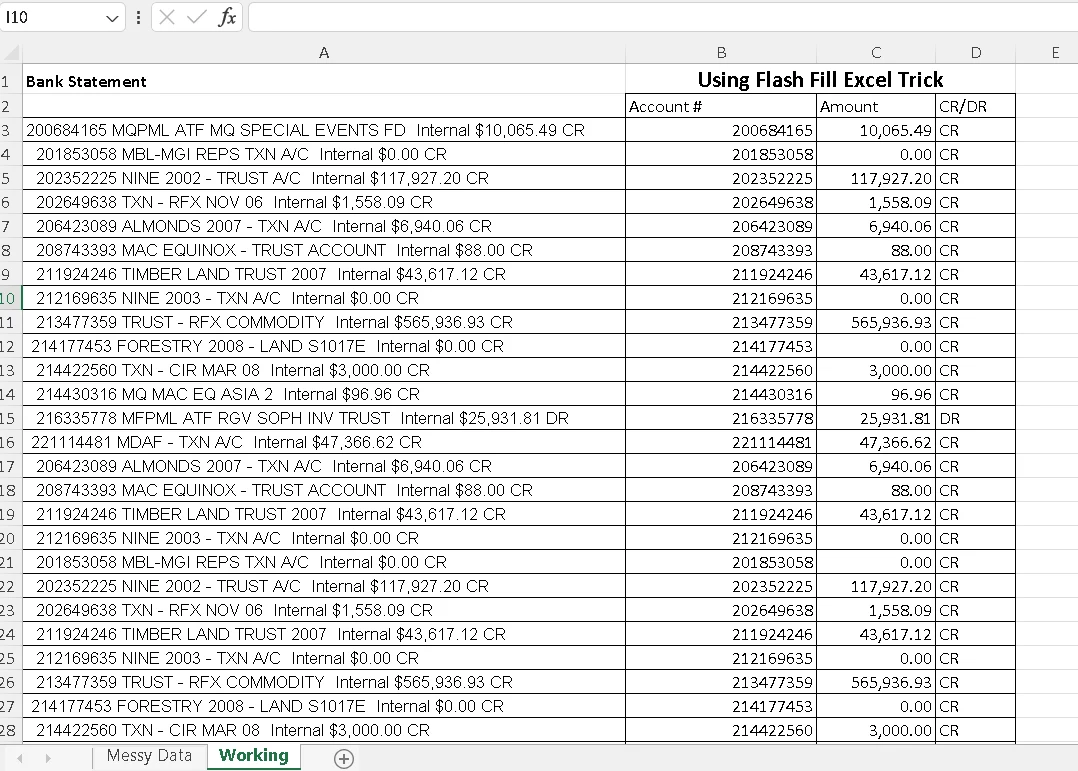
Basic Data Cleanup
🎨 2. Formatting for Readability & Usability
To make the data easy to work with:
Applied conditional formatting to surface key patterns and outliers
Organized columns with consistent alignment and styles
Converted raw ranges into structured Excel Tables with filters
This made the files easier to review, update, and share.
📄 3. Bulk PDF → Excel Conversion
The dataset included 12+ PDF files containing tabular data.
I:
Extracted tables accurately
Cleaned and normalized the converted data
Consolidated PDF data into structured Excel sheets
This unlocked data that was previously difficult to reuse or analyze.

Bulk 12 PDF's to Excel
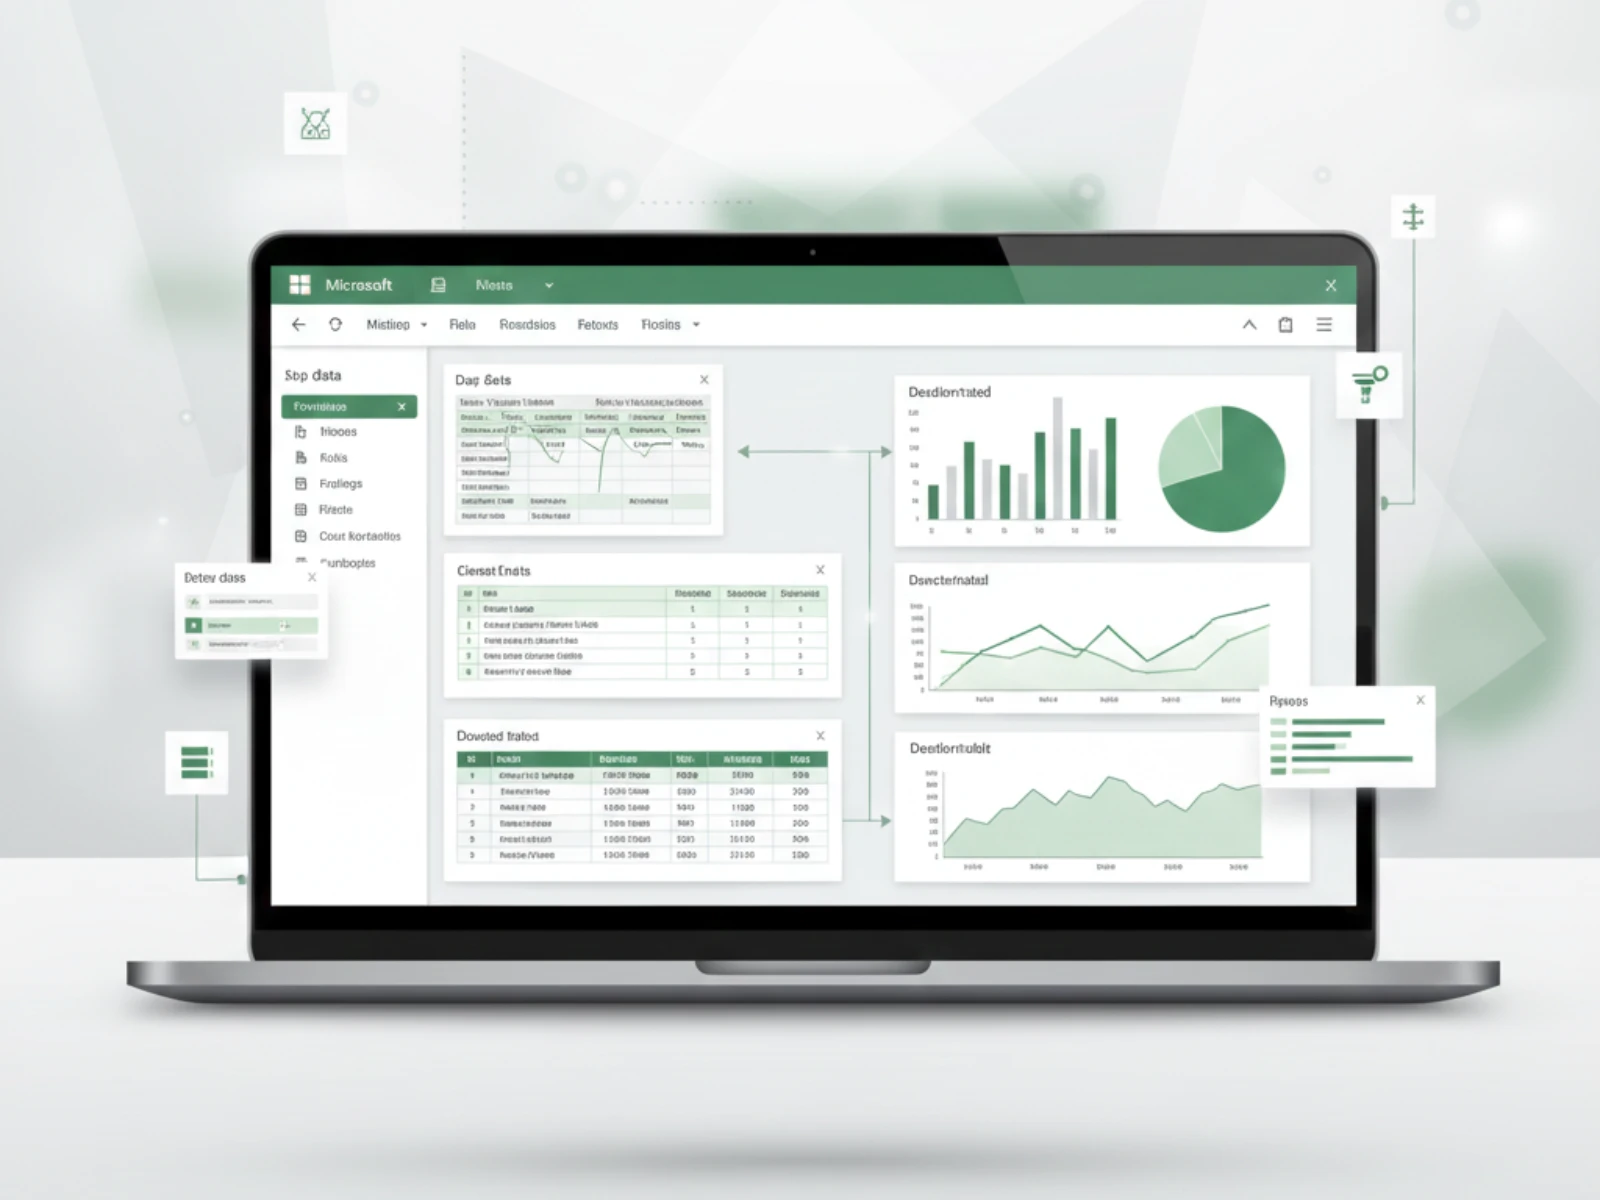
📊 4. Dashboard & Reporting Setup
Using cleaned and structured data, I built an interactive Excel dashboard with:
KPI summaries for quick insights
Pivot-based charts for trends and comparisons
Slicers and filters for flexible exploration
A clean layout suitable for ongoing reporting
The dashboard updates reliably as data changes.

KPI and Pivot Tables
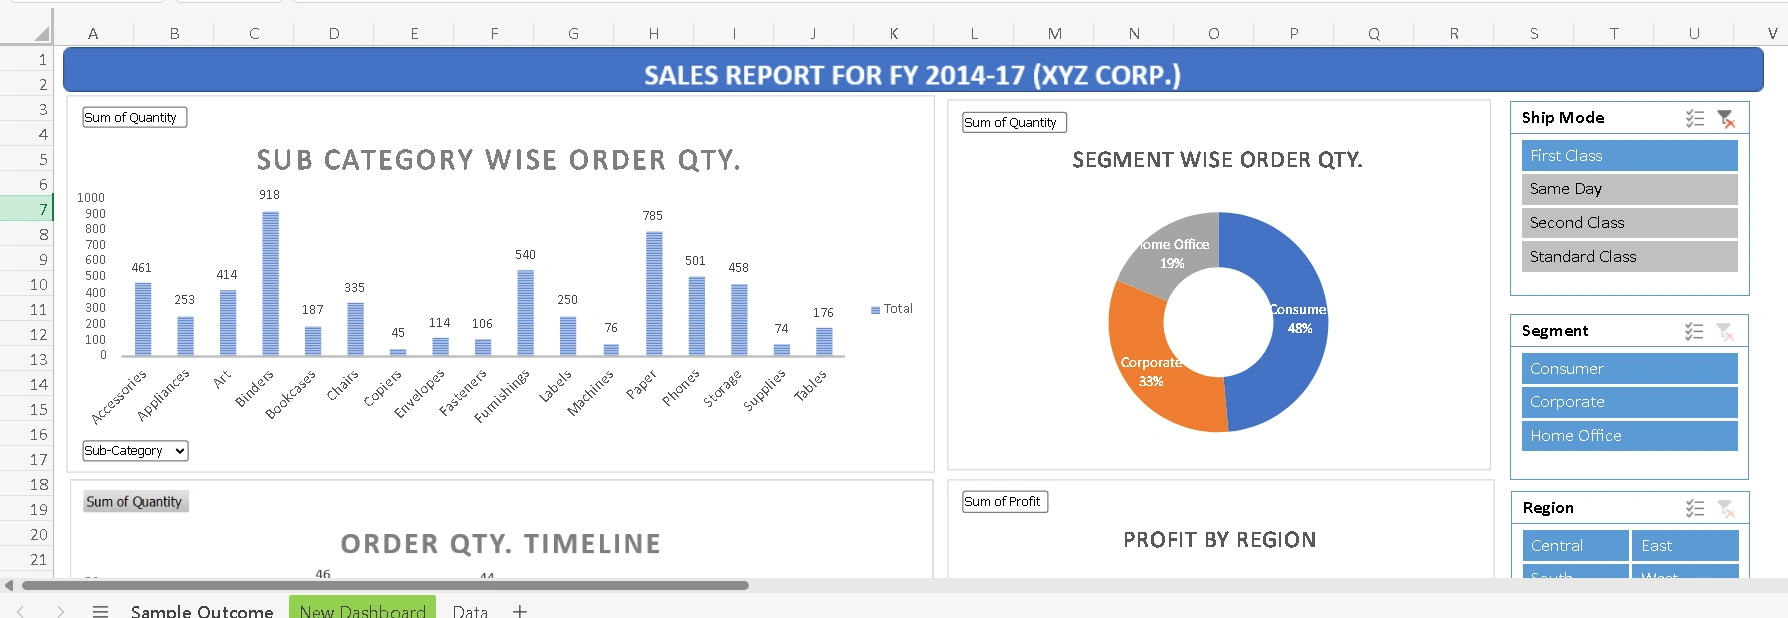
Dashboard
✨ Outcome
✔ Clean, structured Excel datasets
✔ PDF data converted into usable spreadsheets
✔ Reliable dashboards that don’t break with new data
✔ Reduced manual effort and reporting risk
This workflow demonstrates how I help teams move from messy Excel files to decision-ready reports.