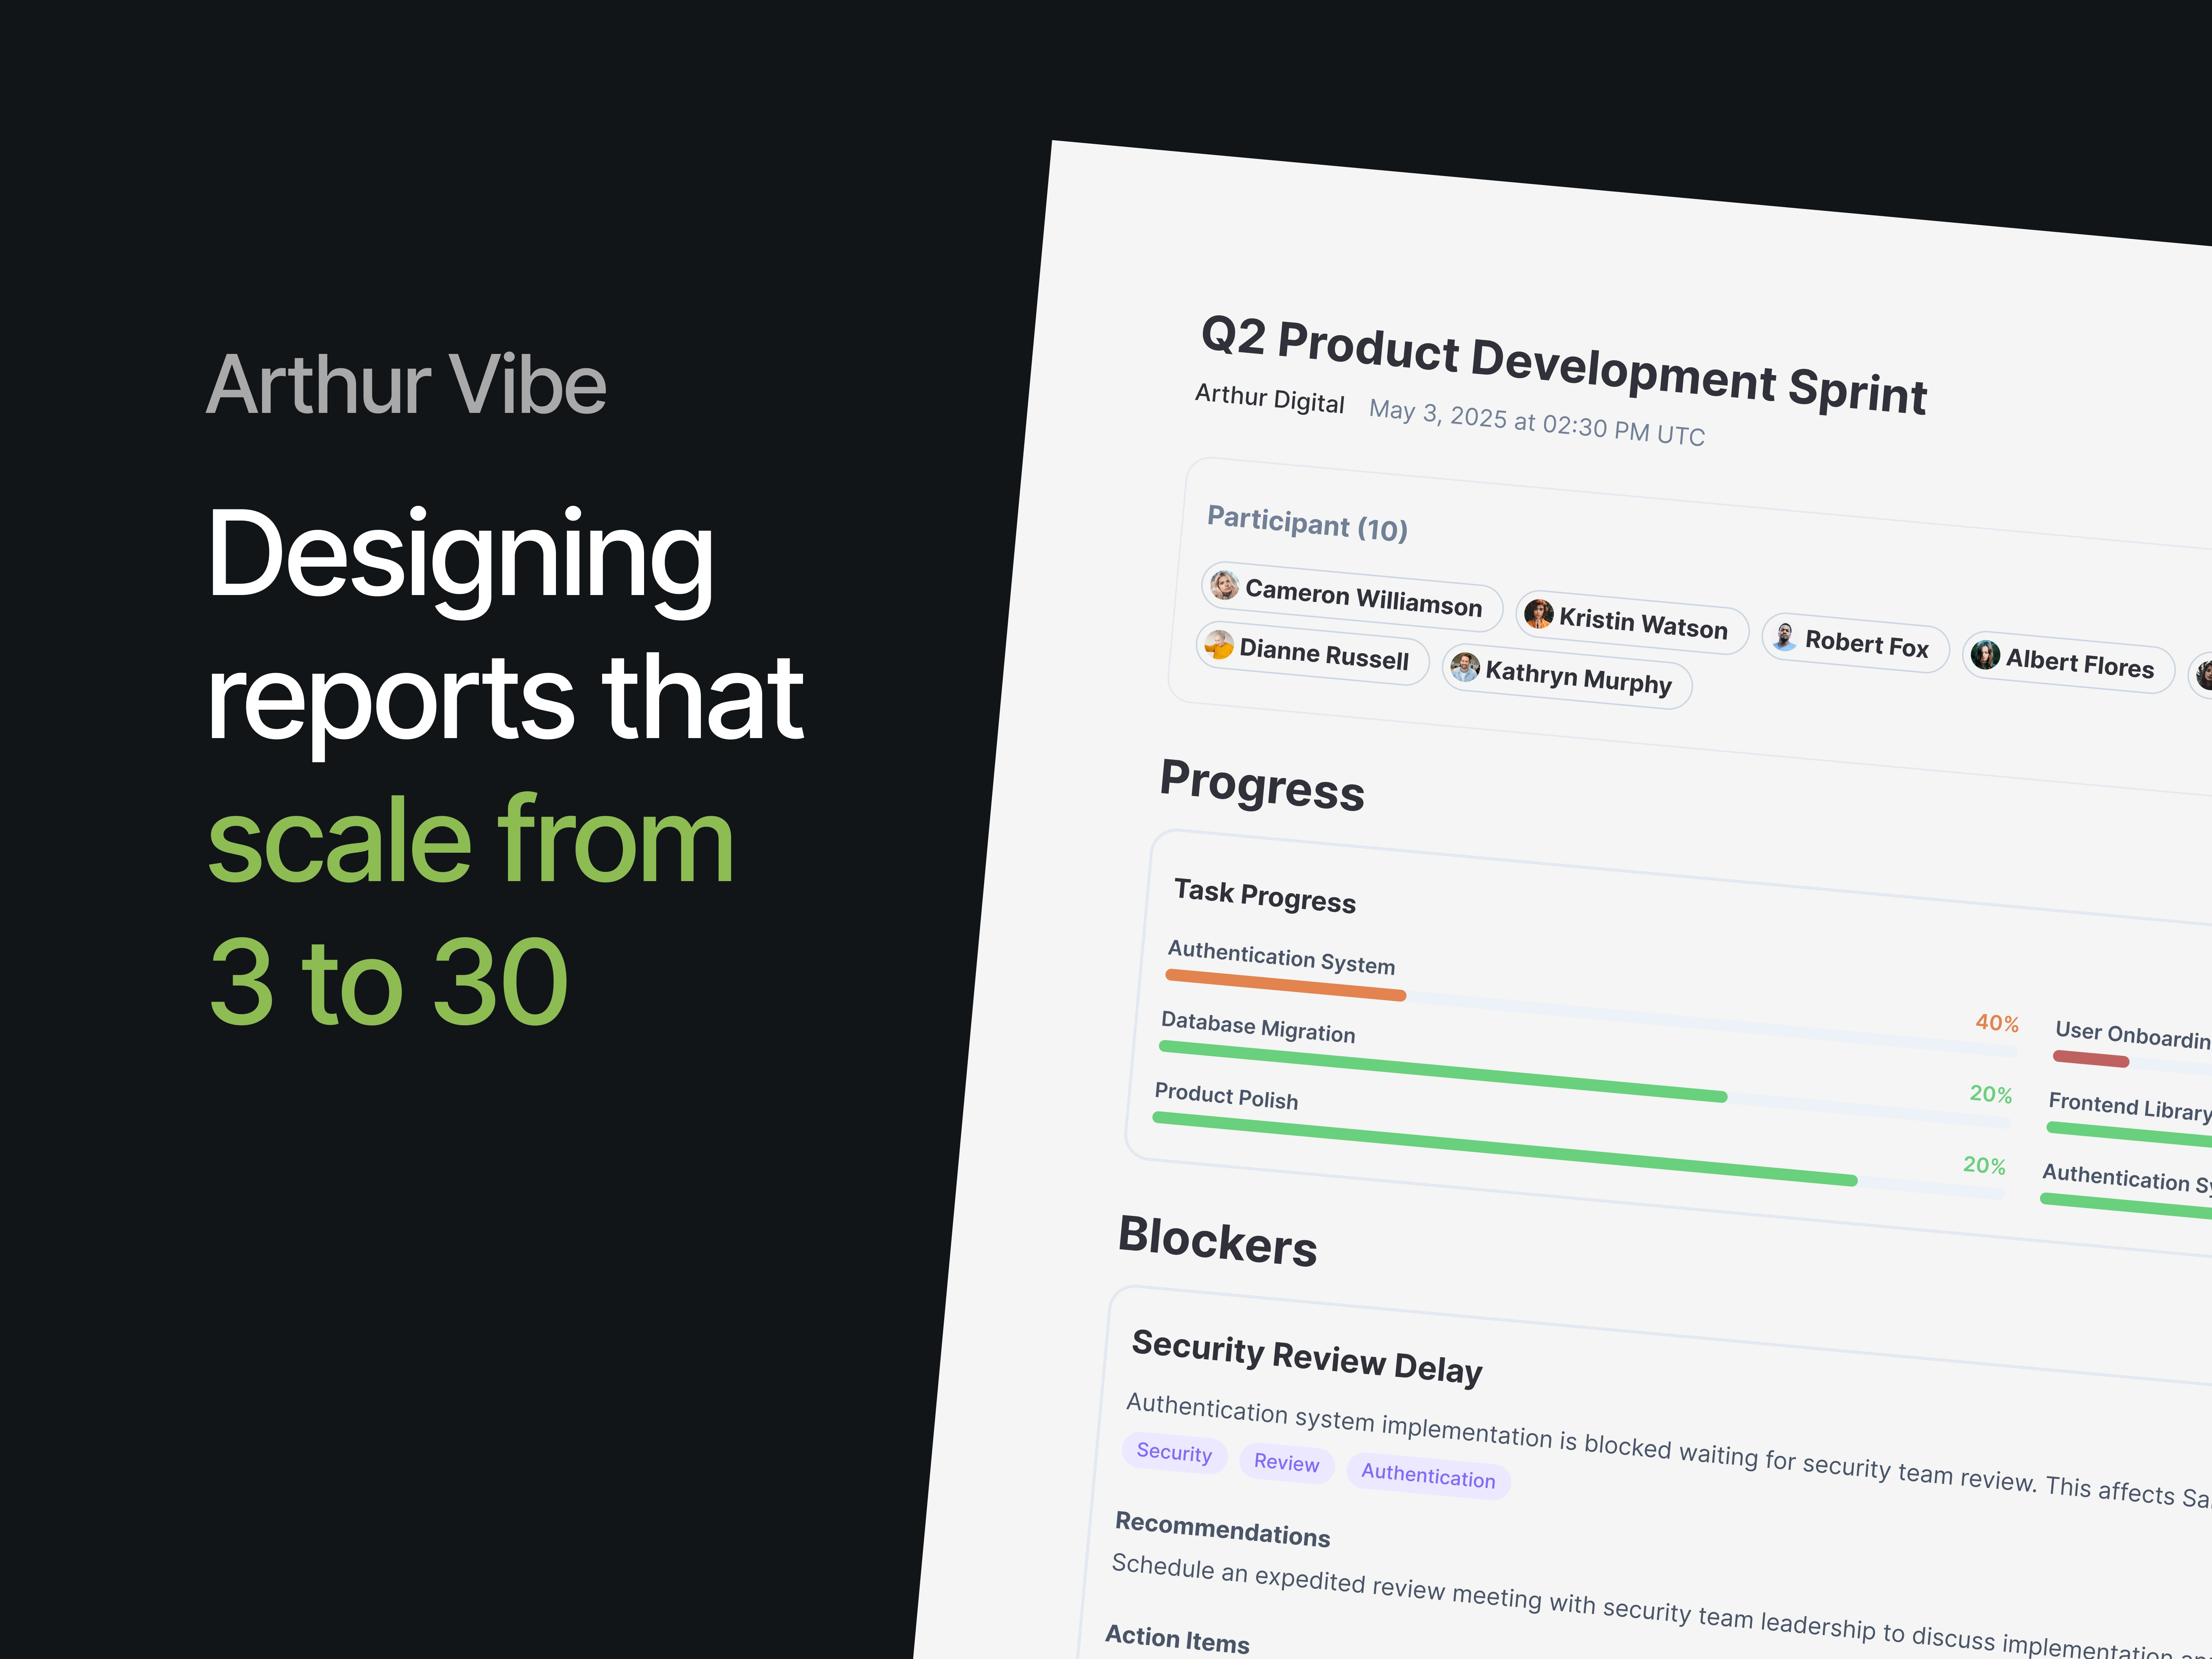
Designing reports that scale from 3 to 30

Hamza Waqas


Context
Arthur Vibe replaces meetings with structured async interviews. Once responses are in, a report generates automatically. It had to work whether three people answered or thirty.
One report doesn't fit every Vibe
Four people can each be read individually. Forty need patterns, not a wall of quotes.
Meeting type matters too. Root Cause needs a cause and effect breakdown. Feedback needs sentiment and themes. One template for both flattens what each meeting needs to say.
Two questions had to be answered before the report could generate: what kind of meeting, and how many people.
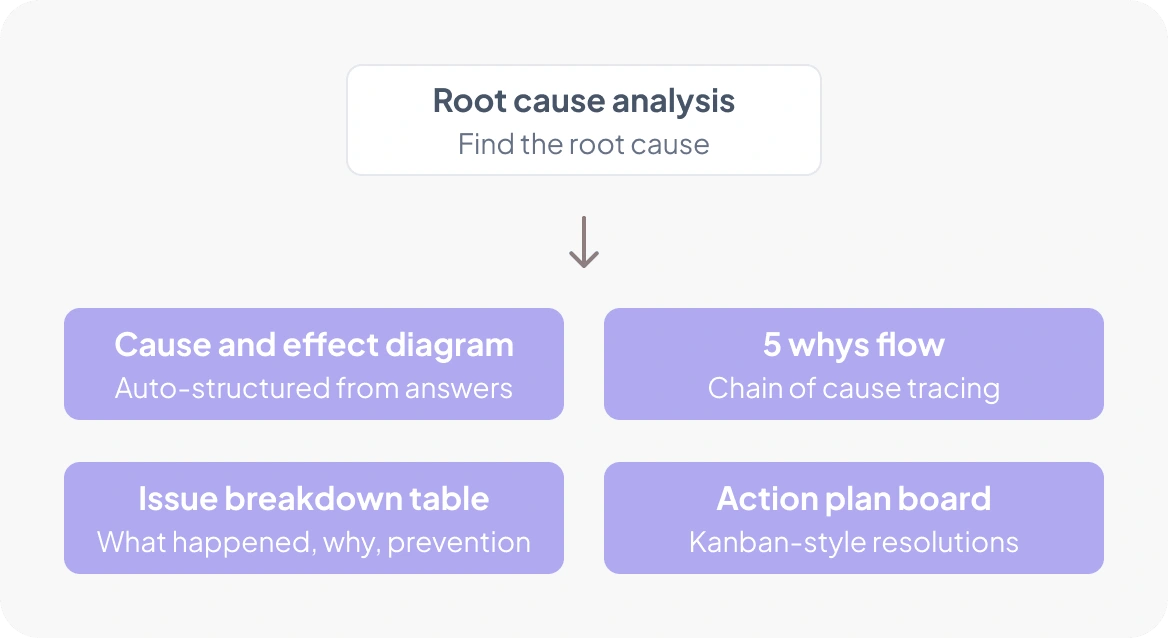
The plan: four approaches for one meeting type, decided before a single report was built.
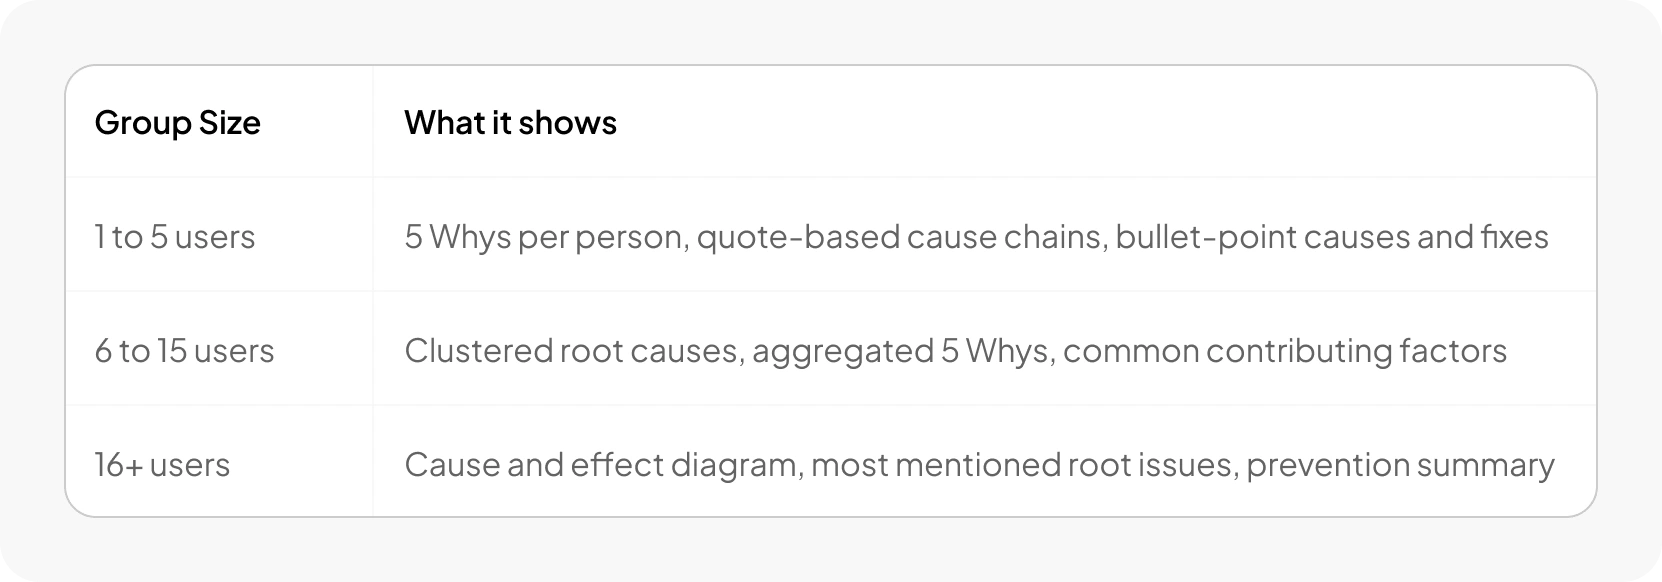
Same question, three different answers, depending on how many people are in the room.
Small groups get depth
At 1 to 5 participants, the report shows individual voices. Quote cards, side by side answers. A manager can trace an insight back to a person
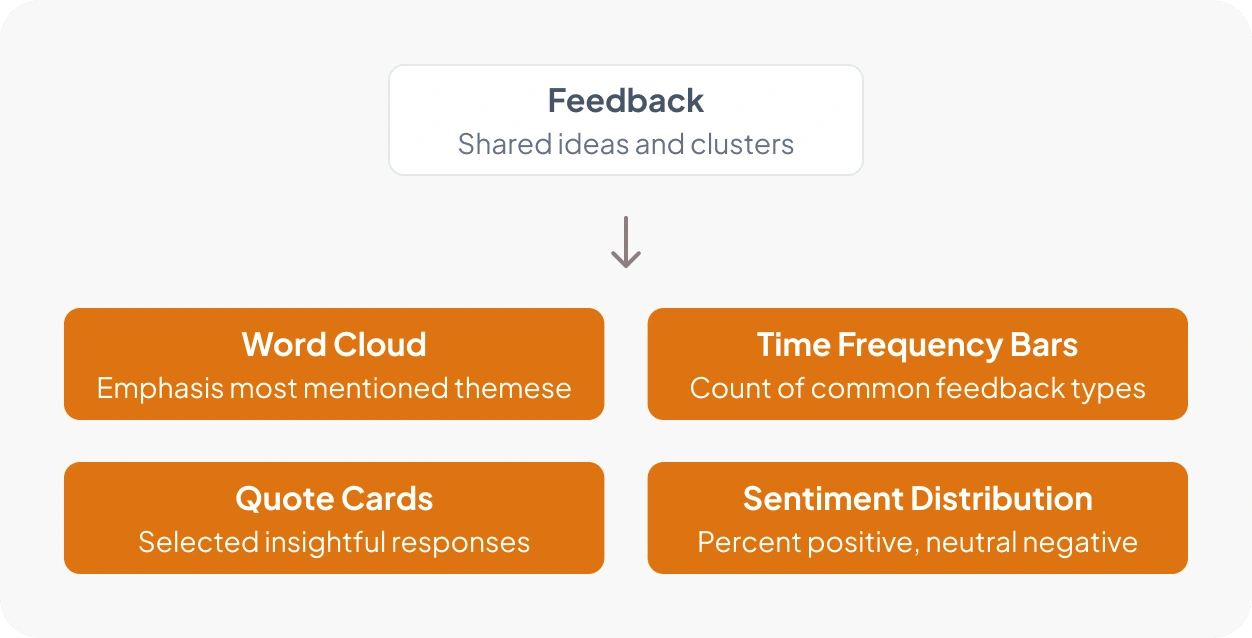
The same planning approach, applied to a different meeting type.
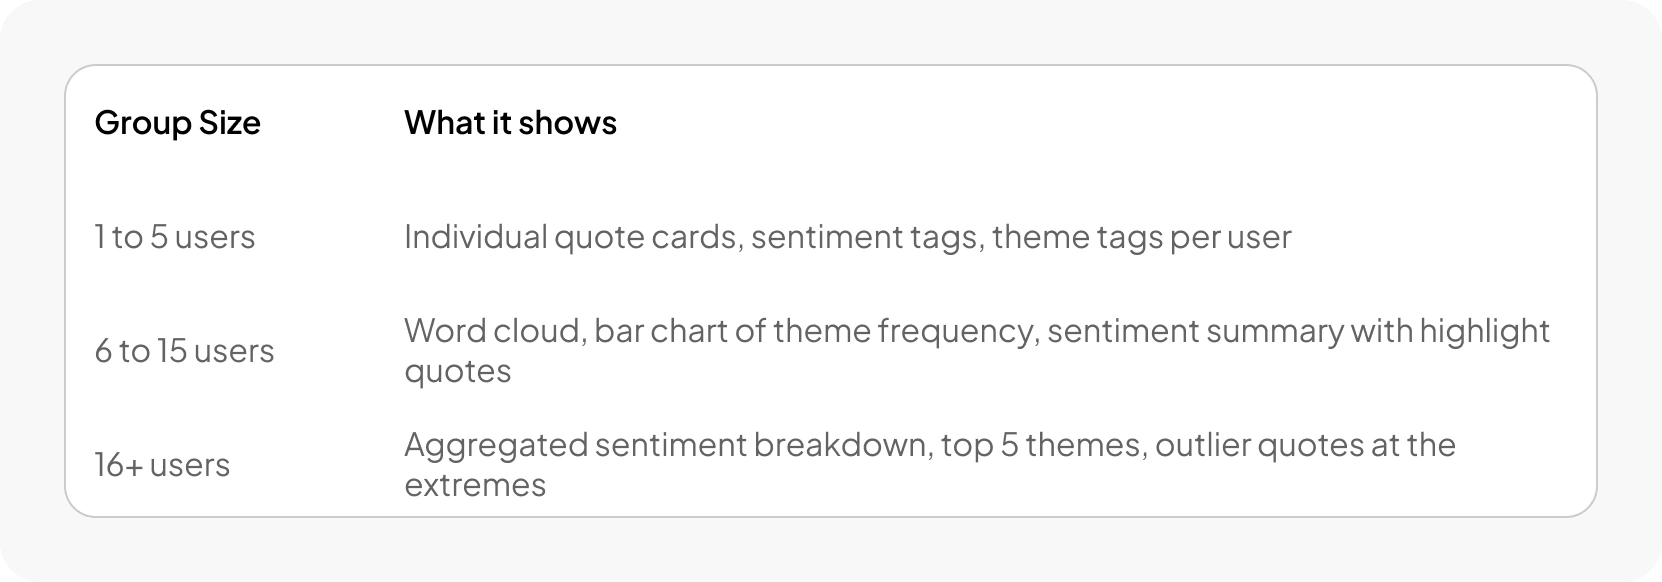
Group size changes the visual. The question stays the same.
Large groups get patterns
At 16 or more, the report shifts to aggregation. Heatmaps, top themes, outlier quotes. Nobody reads forty answers in five minutes, but they can read a pattern.
Between 6 and 15, it sits in the middle. Clustered themes, grouped consensus.
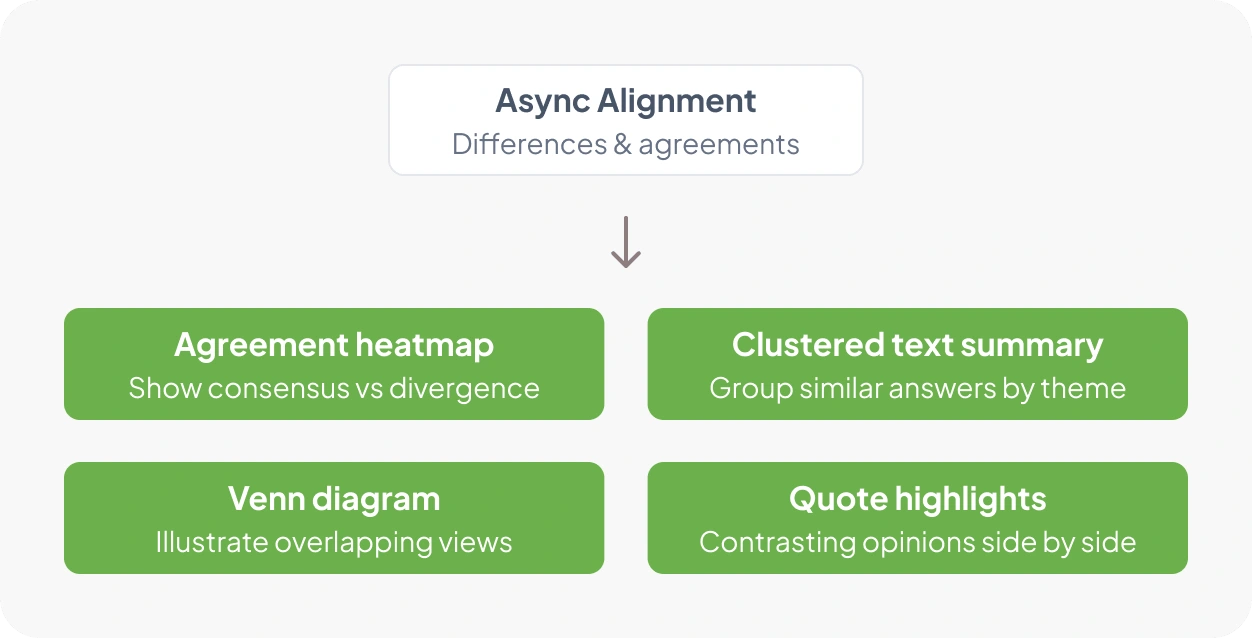
One more meeting type, the same underlying decision.
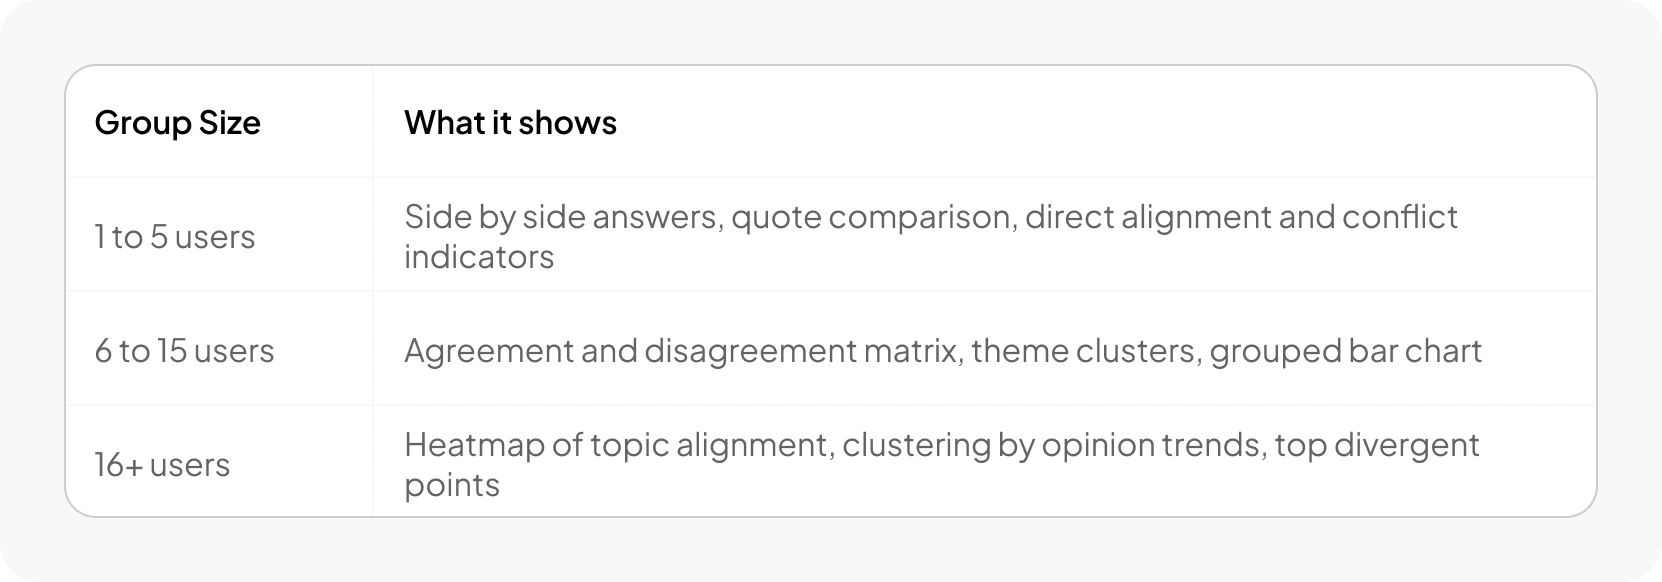
Three tiers, one system. Depth at small scale, pattern at large scale.
Real reports, real industries
Below: a Root Cause Analysis for a pharma production site, a Retrospective with sentiment tracking and Start/Stop/Keep, and a Standup with blocker recurrence detection. Different meeting types, different report structures, same underlying system.
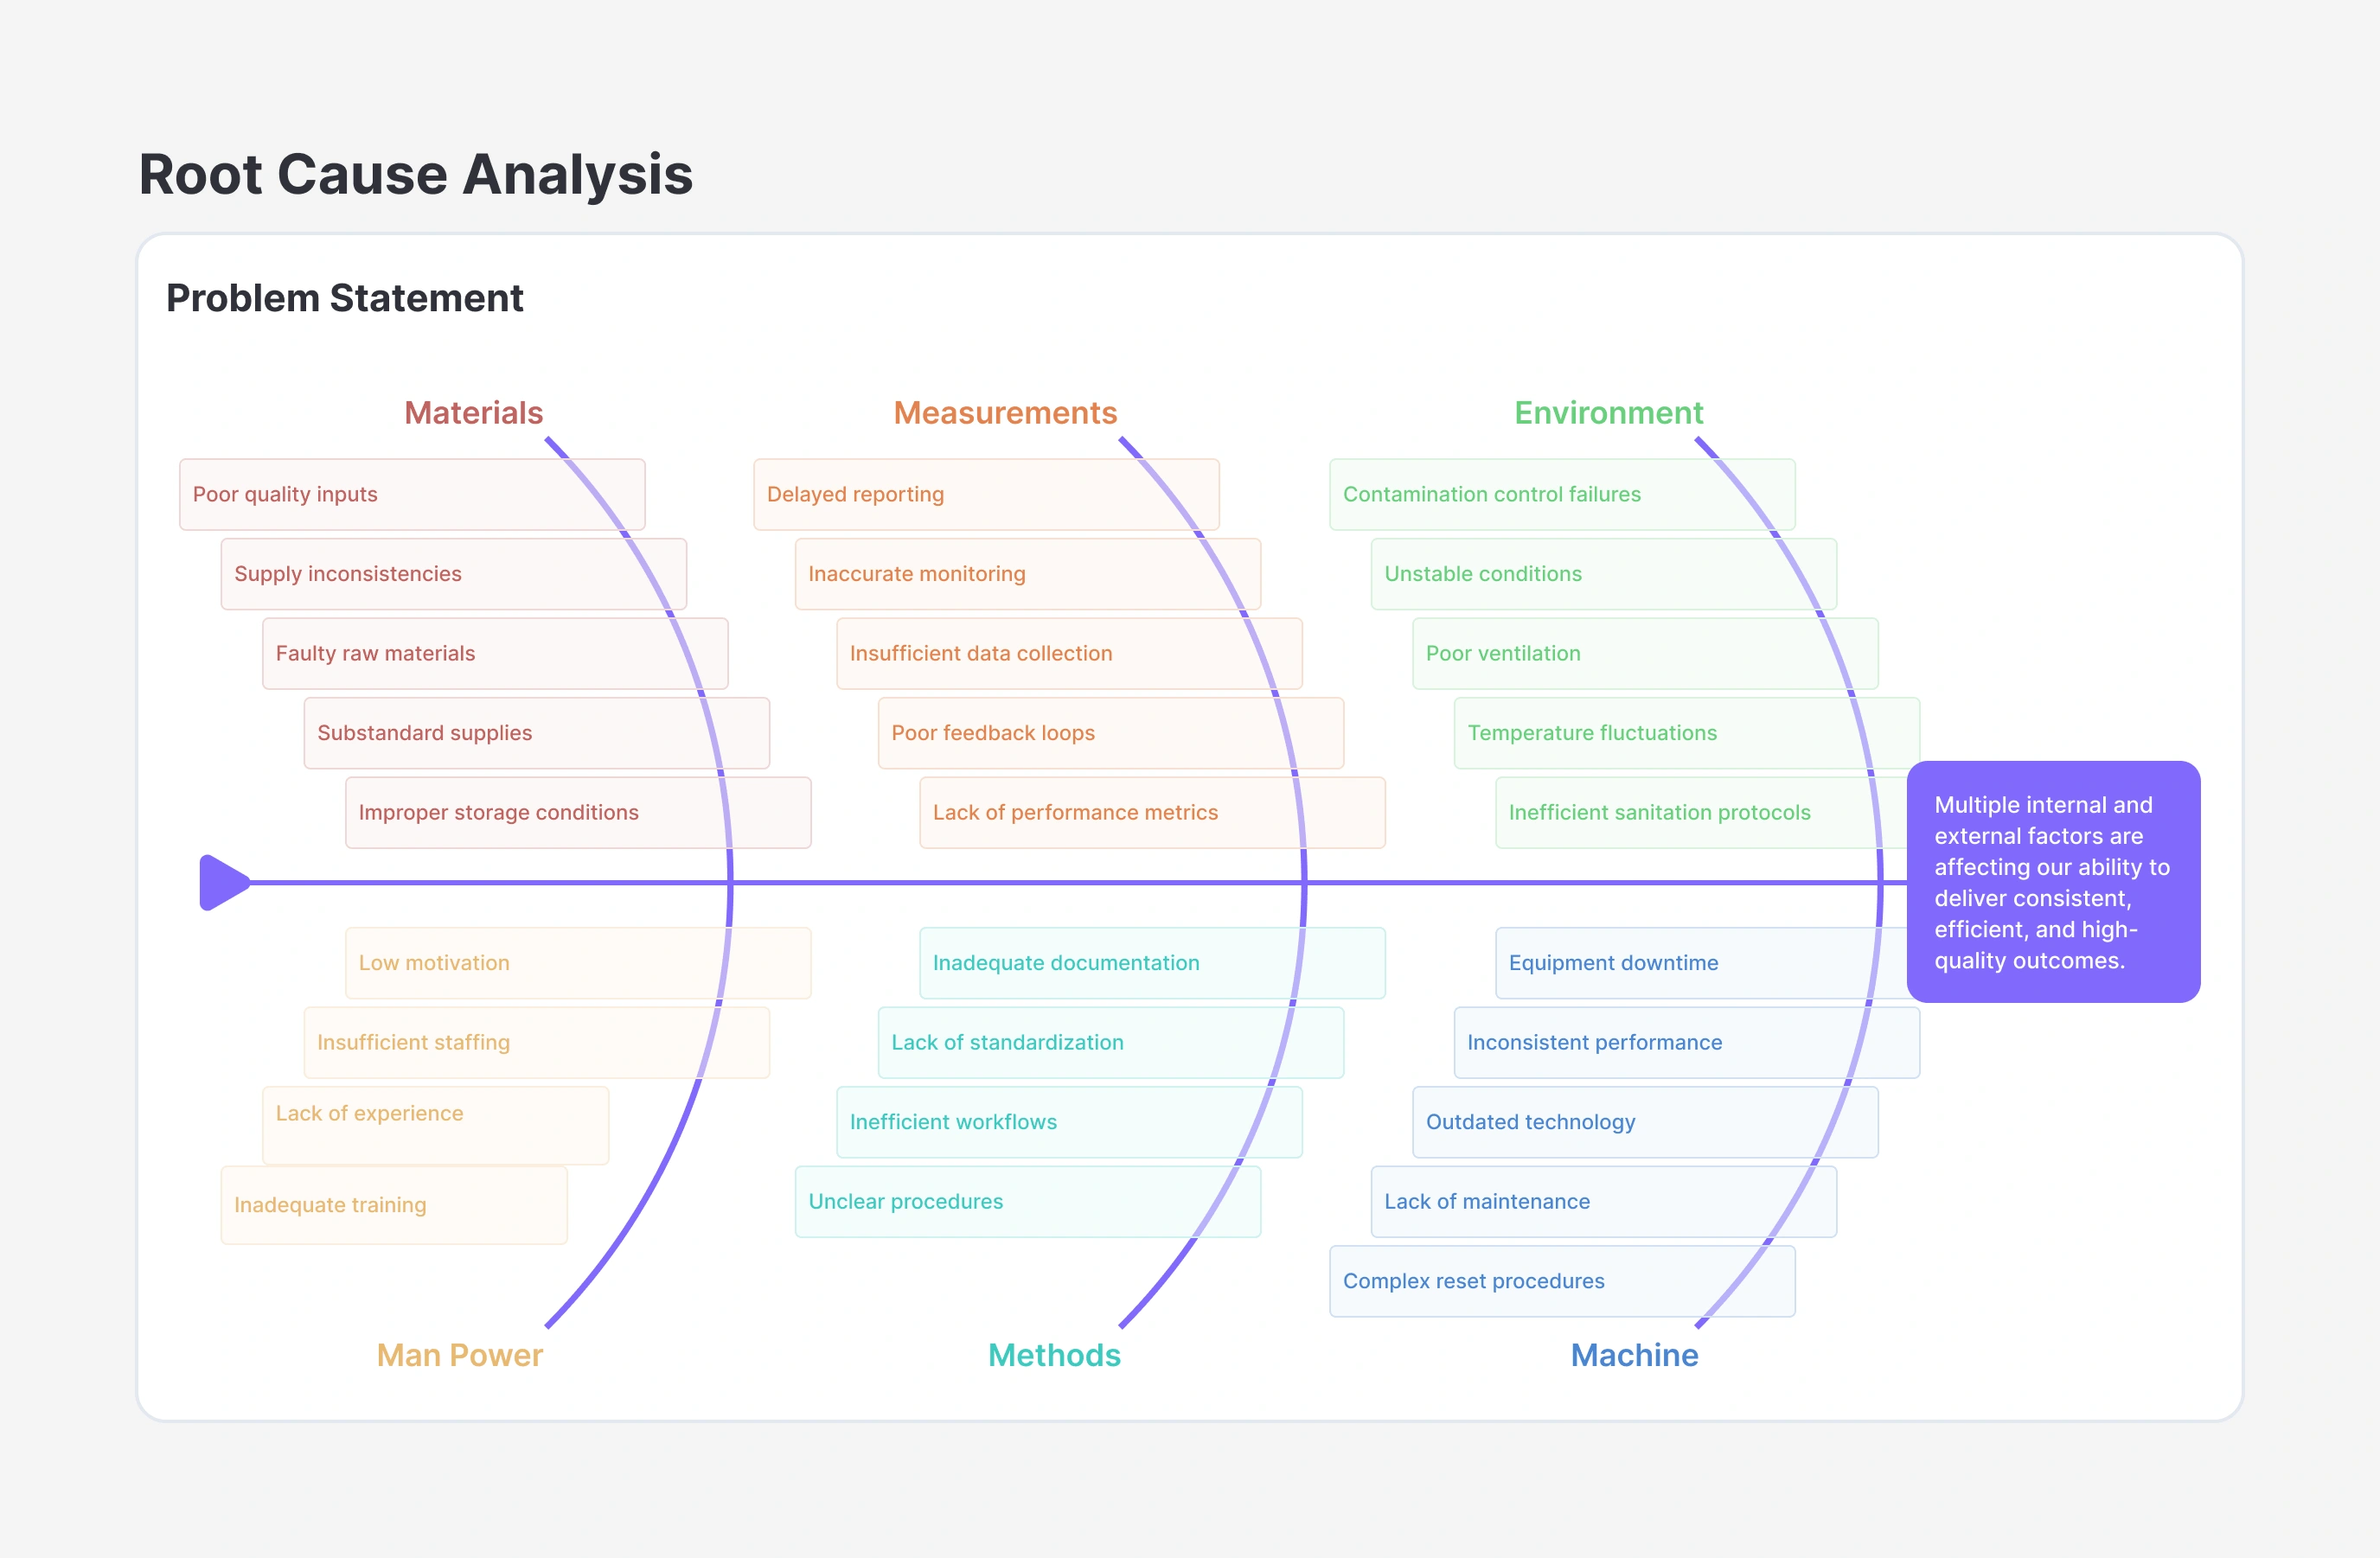
A fishbone diagram, generated automatically from interview responses.
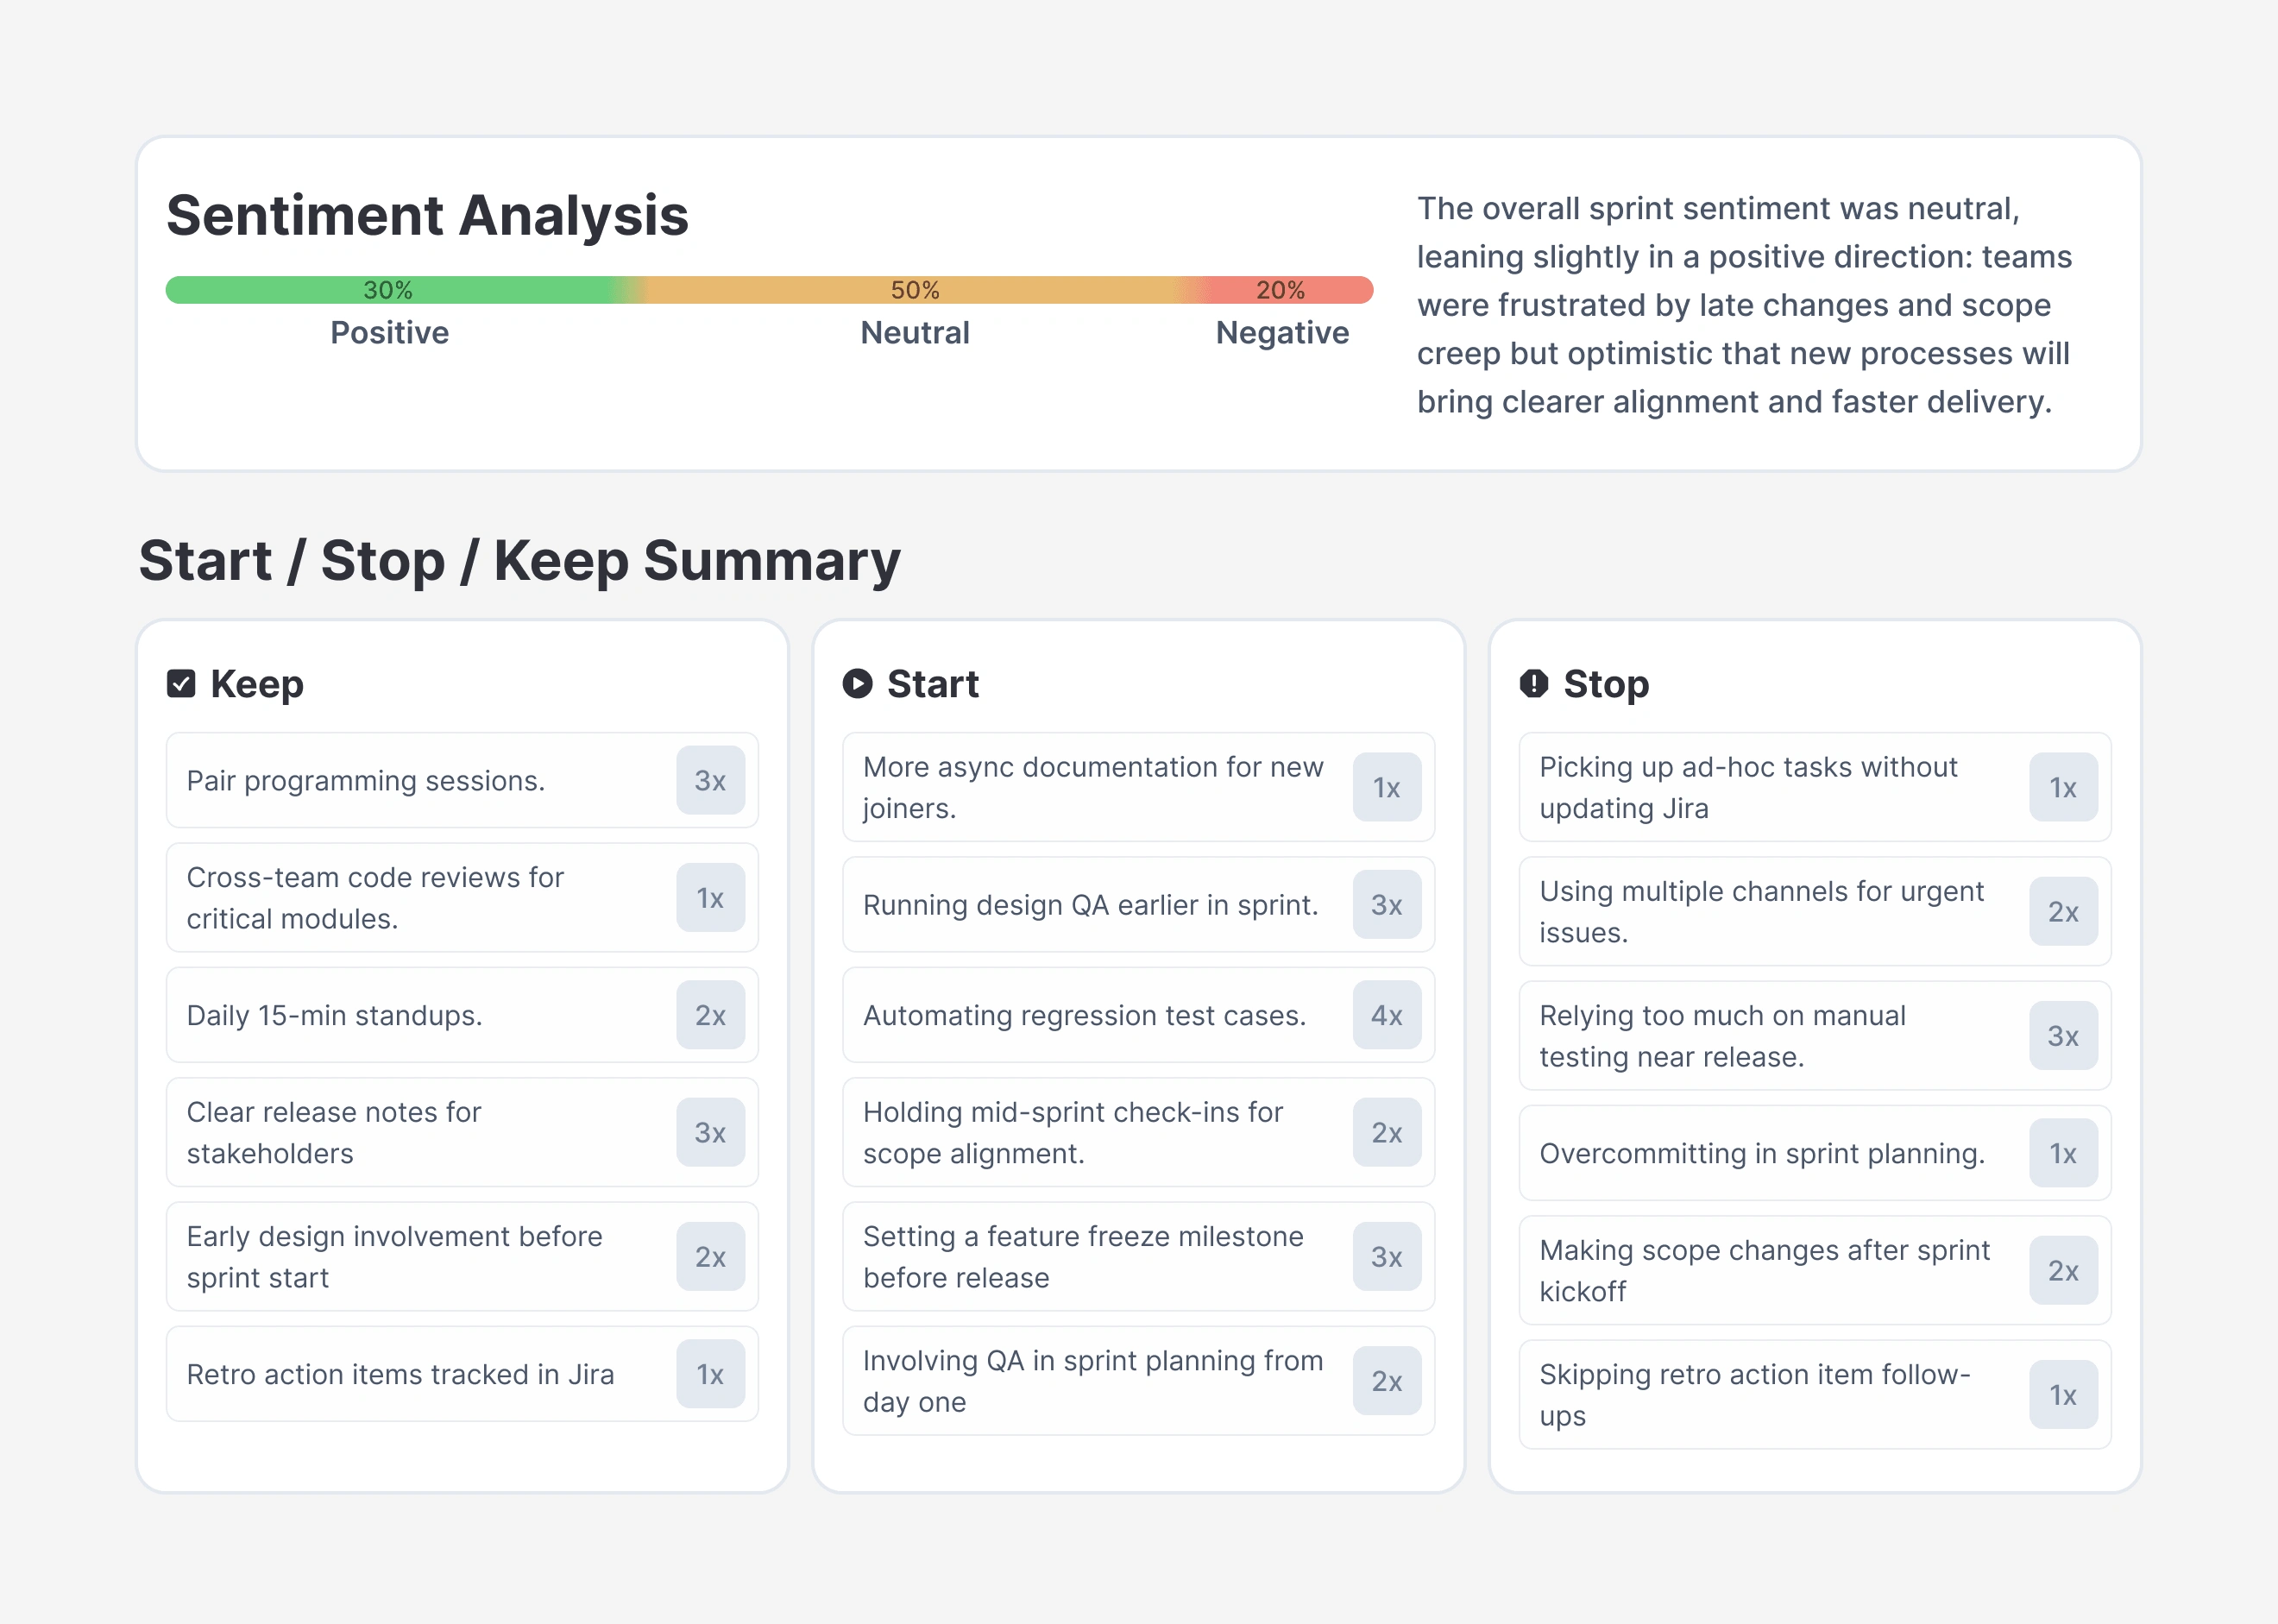
A different meeting type gets a different structure entirely, not just a different color.
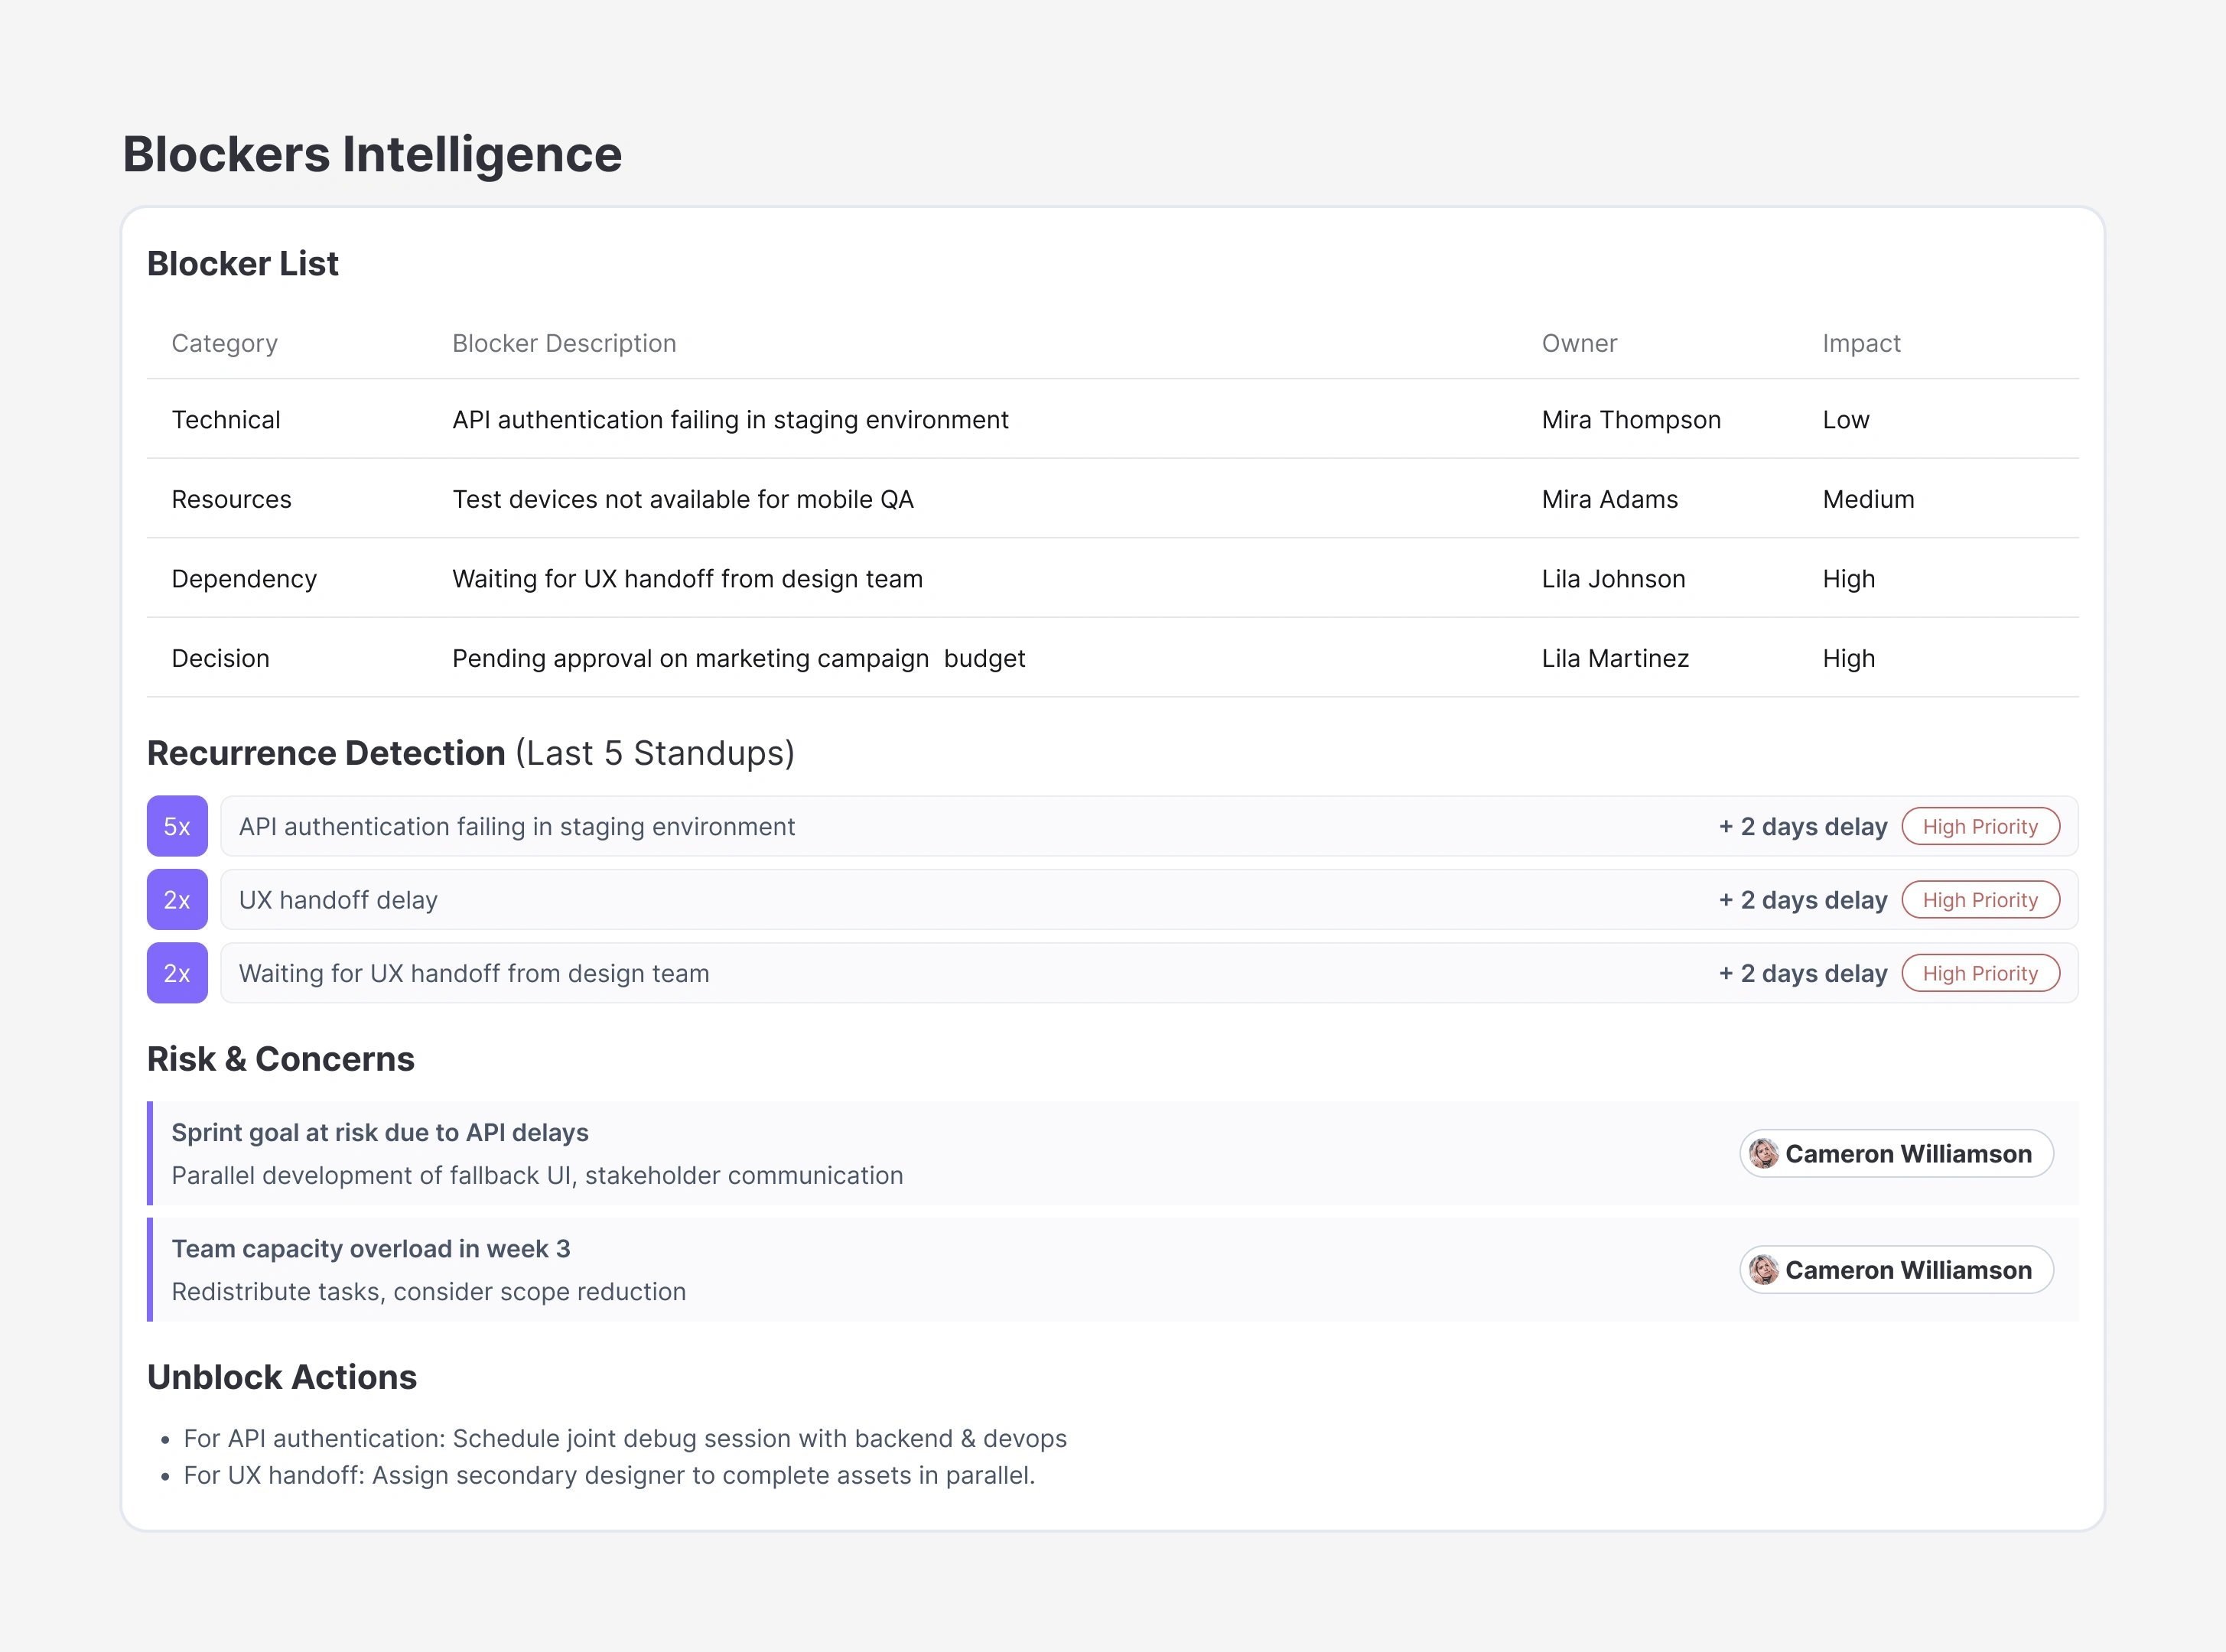
The system tracks patterns across meetings too, like a blocker that keeps recurring.
Real reports, real meeting types
Below: a Root Cause Analysis for a pharma production site, a Retrospective with sentiment tracking and Start/Stop/Keep, and a Standup with blocker recurrence detection. Different meeting types, different report structures, same underlying system.
What I carry forward
The hard part was never one good report. It was the rules that decide which report gets built. Meeting type sets the shape. Participant count sets the depth.
A report that works at every scale isn't one design. It's a system that knows when to show everything and when to show only what matters.
Like this project
Posted Jul 18, 2026
Designed the system behind Arthur Vibe's reports, adapting depth and structure based on meeting type and participant count.
Likes
0
Views
4