Expense Breakdown
Joseph Killingsworth
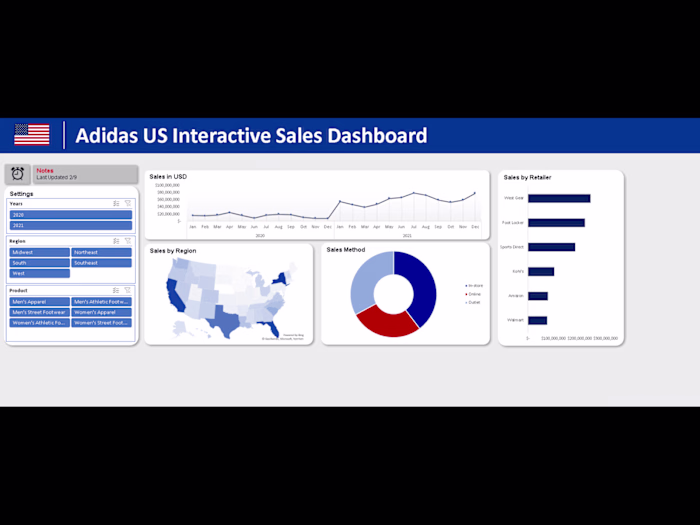
Data Entry and Management:
Dashboard Creation:
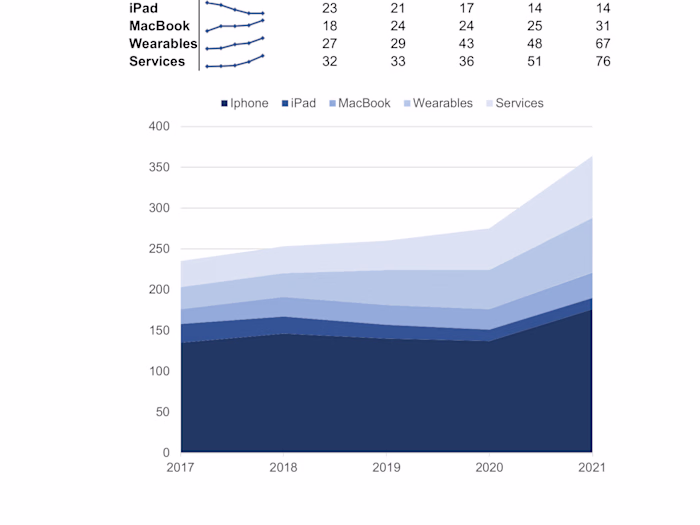
Charts and Graphs:
PivotTables for Analysis:
Customizable Filters:
By breaking down the project into these components, users can better understand how each element contributes to the overall functionality and effectiveness of the Expense Dashboard in helping manage personal finances effectively.
Like this project
Posted Feb 19, 2024
Expense Dashboard in Excel: Enter, manage expenses; visualize trends with charts, PivotTables; analyze by category, month; customizable filters for insights.
Likes
0
Views
5