Adidas Sales Dashboard
Joseph Killingsworth
Title: Comprehensive Adidas Sales Analysis and Visualization Dashboard
Description:
This Excel dashboard presents a thorough analysis and visualization of Adidas product sales data. It offers a range of features aimed at providing detailed insights into Adidas sales performance:
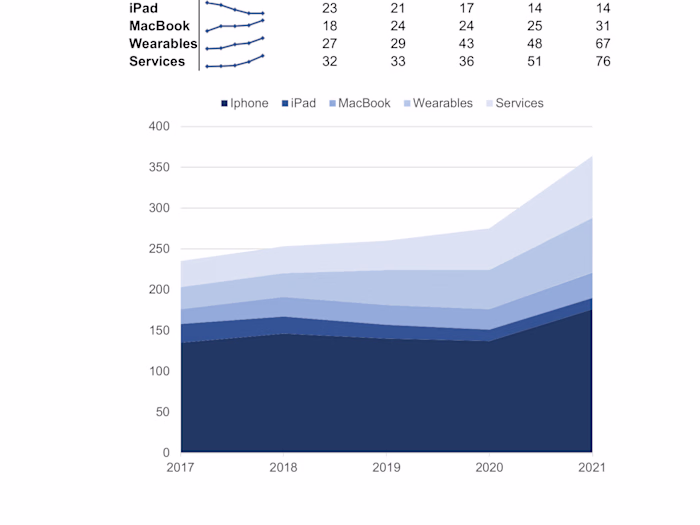
•Sales Trend Line Chart: A dynamic chart spanning from January 2020 to January 2021 showcases the fluctuation in sales revenue, aiding in the identification of sales trends over time.
•Sale Method Doughnut Chart: Illustrates the distribution of sales across three methods: in-store, online, and outlet, with a focus on highlighting the effectiveness of different sales channels.
•Adidas Retail PivotTable: Provides a detailed summary of Adidas retail performance, spotlighting key retail partners such as West Gear, Foot Locker, and others. This information is complemented by a bar chart that showcases the total sales contribution of each retailer, with West Gear identified as the top performer.
•Sales Region Map: Utilizes a PivotTable summarizing sales data across 50 states to present a geographical analysis of Adidas sales performance. This visualization helps in identifying regions of high and low sales activity, facilitating strategic decision-making.
•Adidas Sales Database: Serves as the foundation for all analyses and visualizations, ensuring data integrity and consistency across the dashboard's various components.
In summary, this Adidas Sales Analysis and Visualization Dashboard offers stakeholders a comprehensive overview of sales performance, enabling data-driven decision-making and strategic planning to drive business growth and profitability.
Like this project
Posted Feb 19, 2024
Offers a comprehensive overview of sales performance, enabling data-driven decision-making strategic planning to drive business growth and profitability.