Tech in Asia Article Network: Exploring Authors & Topics
Diana O
Tech in Asia Article Network: Exploring Authors & Topics
Technologies: Python, Javascript, D3.js
Data Processing
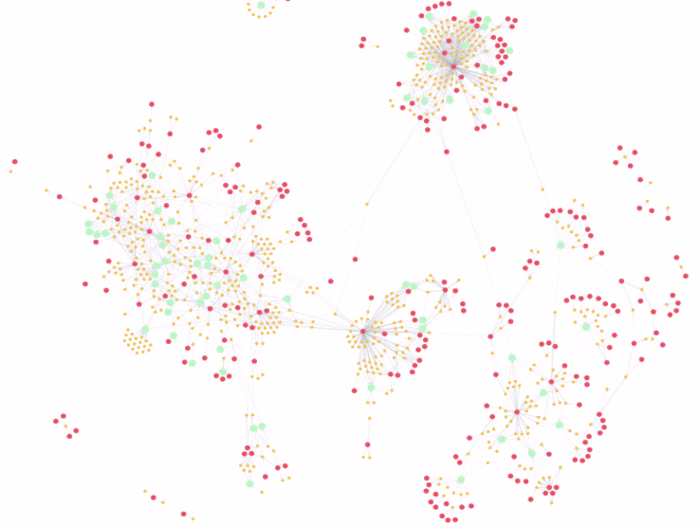
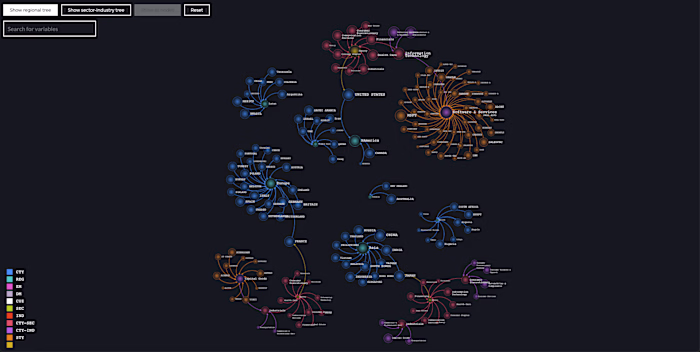
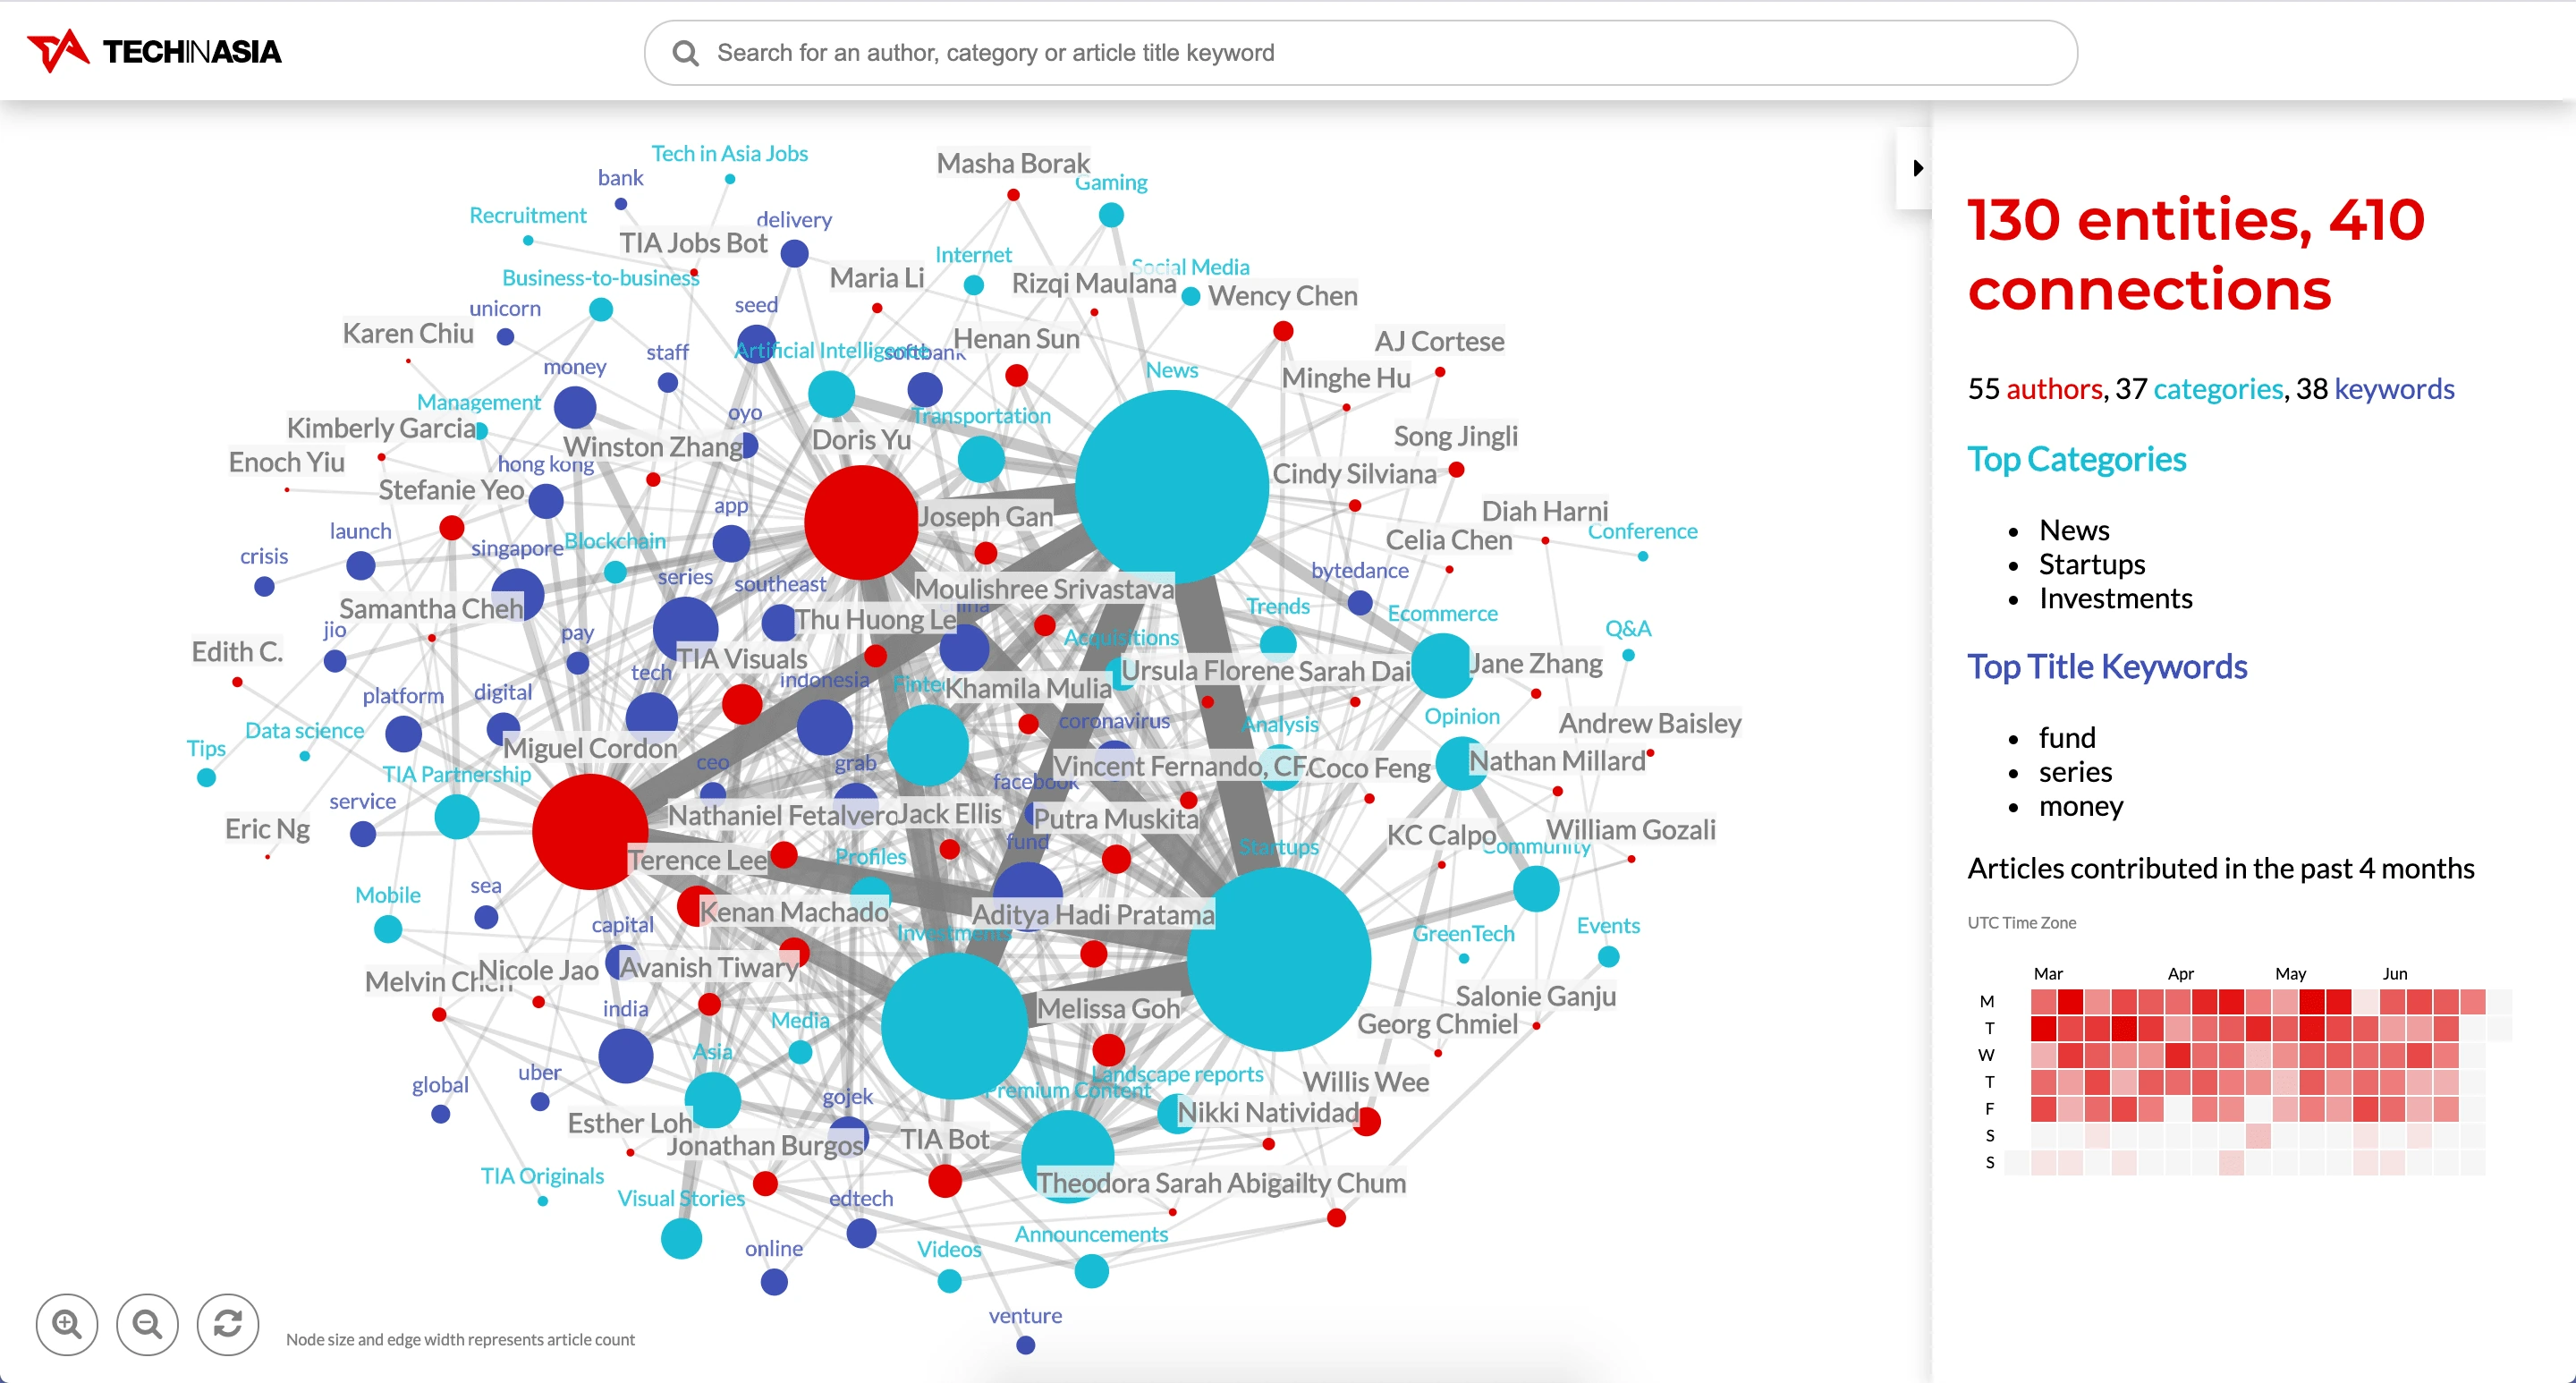
I extracted data of 900 articles from Tech In Asia's API. After checking the available data attributes, i thought it will be useful to create a dashboard to better understand articles published on TIA by identifying trends in terms of author contribution and article topics. I conceptualized a graph network to be like a TIA 'universe' enabling the user to explore infuential authors or topics and their connections. To achieve this, I did some simple Natural Language Processing of article titles to extract keywords. This is done on the assumption that a TIA article's content can be summarized by just its title. Relationships between authors, title keywords and tagged categories were then established. Graph analytics was done to understand the global and local graph structure.
Dashboard Features
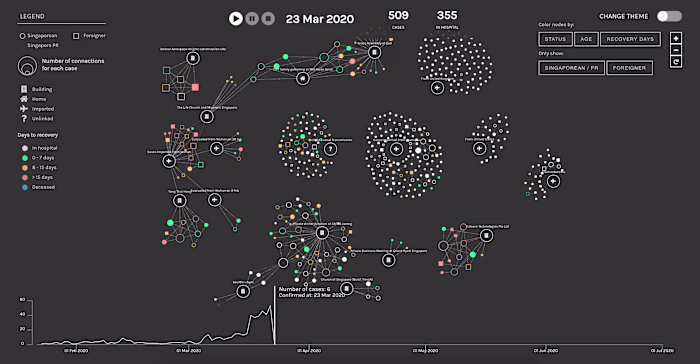
1. Select a node to see its connections using hover effect Only author nodes have detailed information such as summary statistics and timeline heatmap appearing in the right sidebar.
2. Select a node using the search bar Area of improvement: Search function currently only accepts exact keywords. Fuzzy search can be implemented in the future
Like this project
Posted May 3, 2025
Developed a dashboard to analyze Tech In Asia articles using graph analytics.