COVID-19 Case Visualization for Singapore
Diana O
COVID-19 Network Singapore
Technologies: React, D3.js
Overview
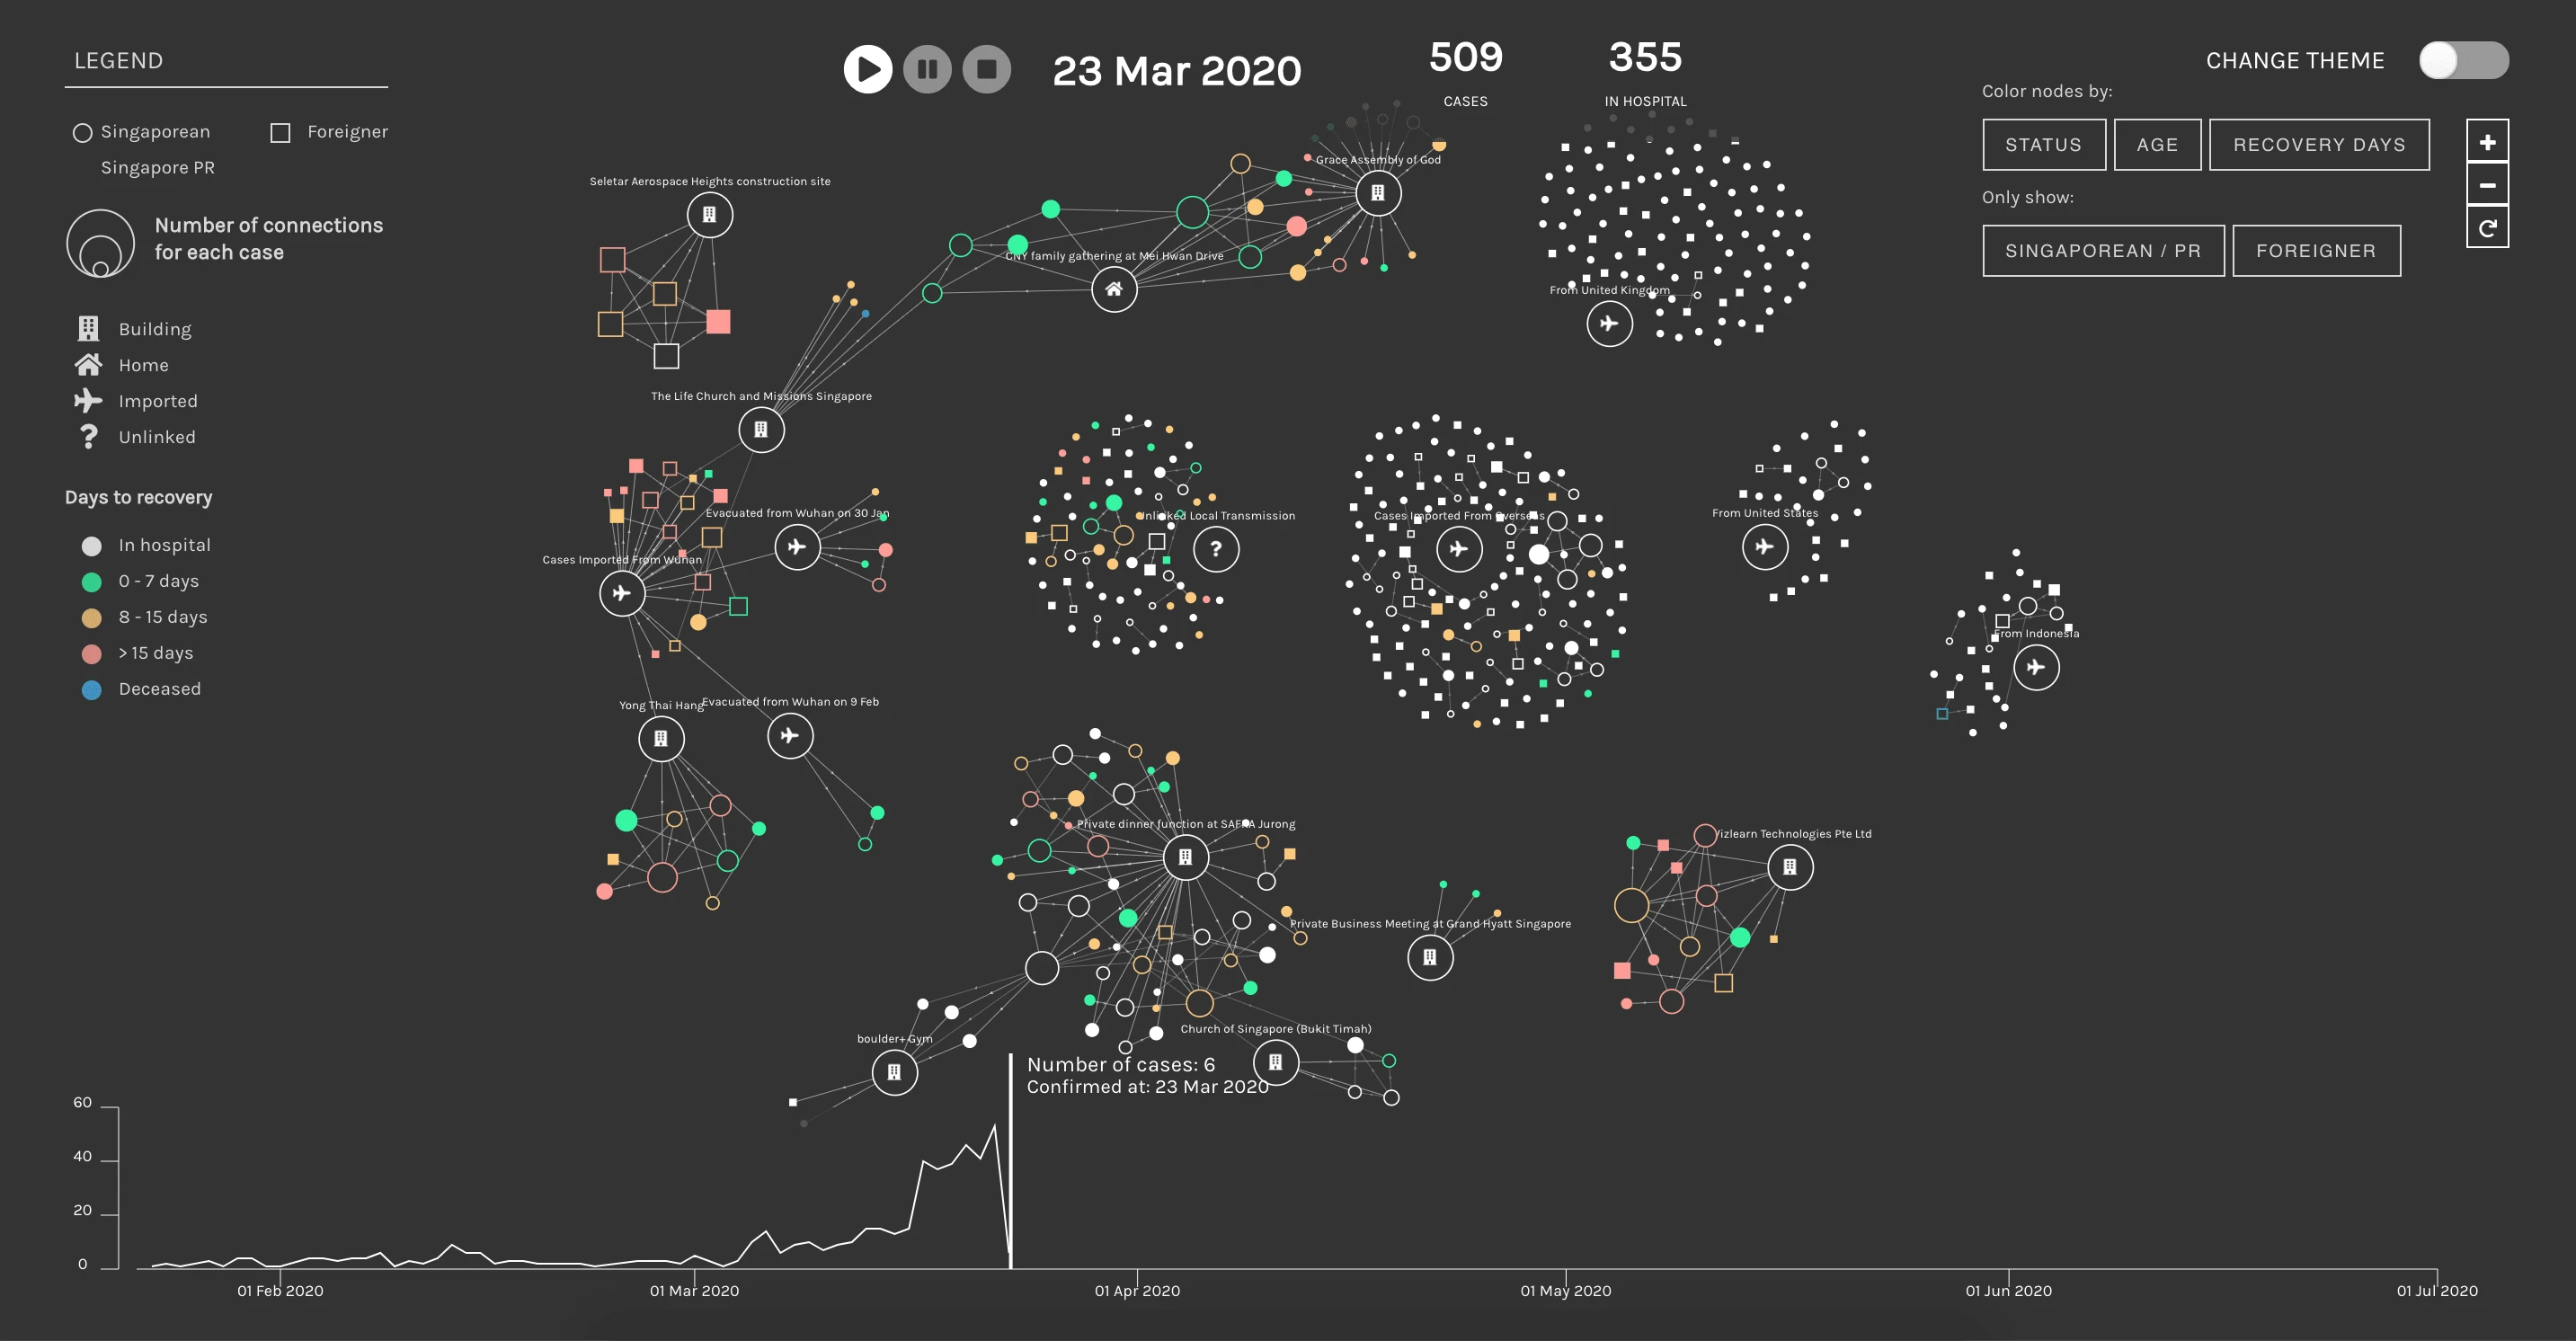
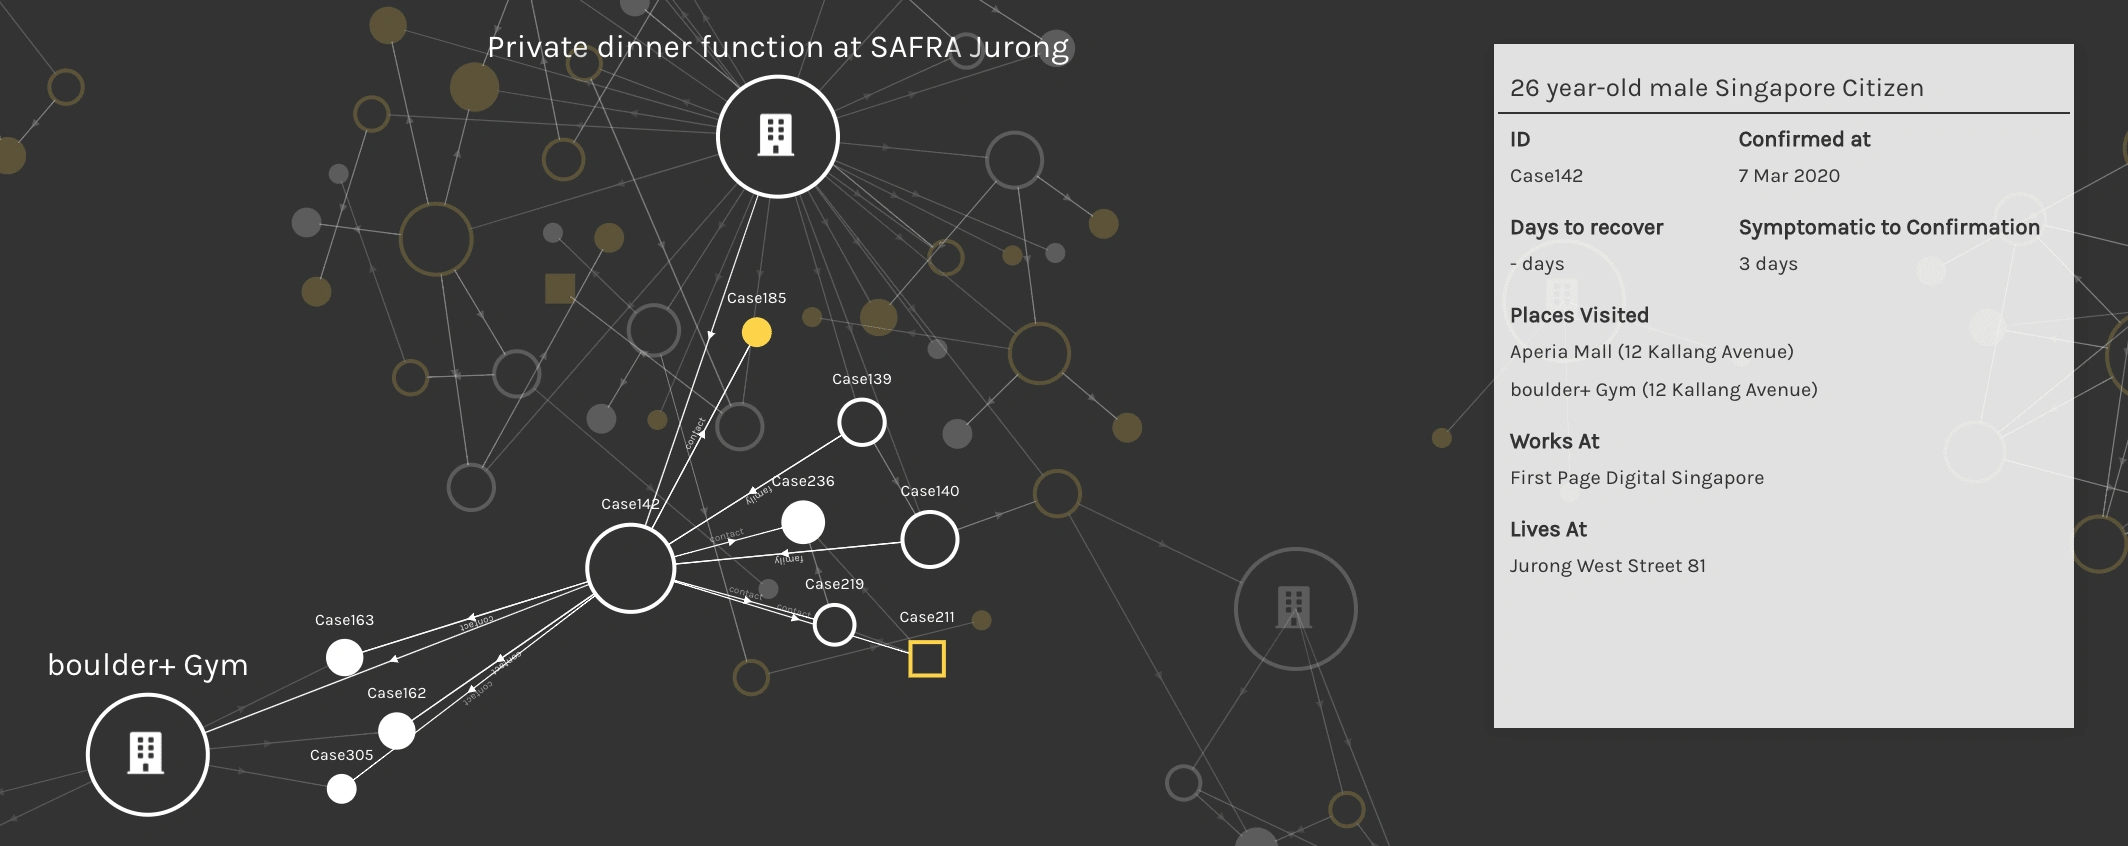
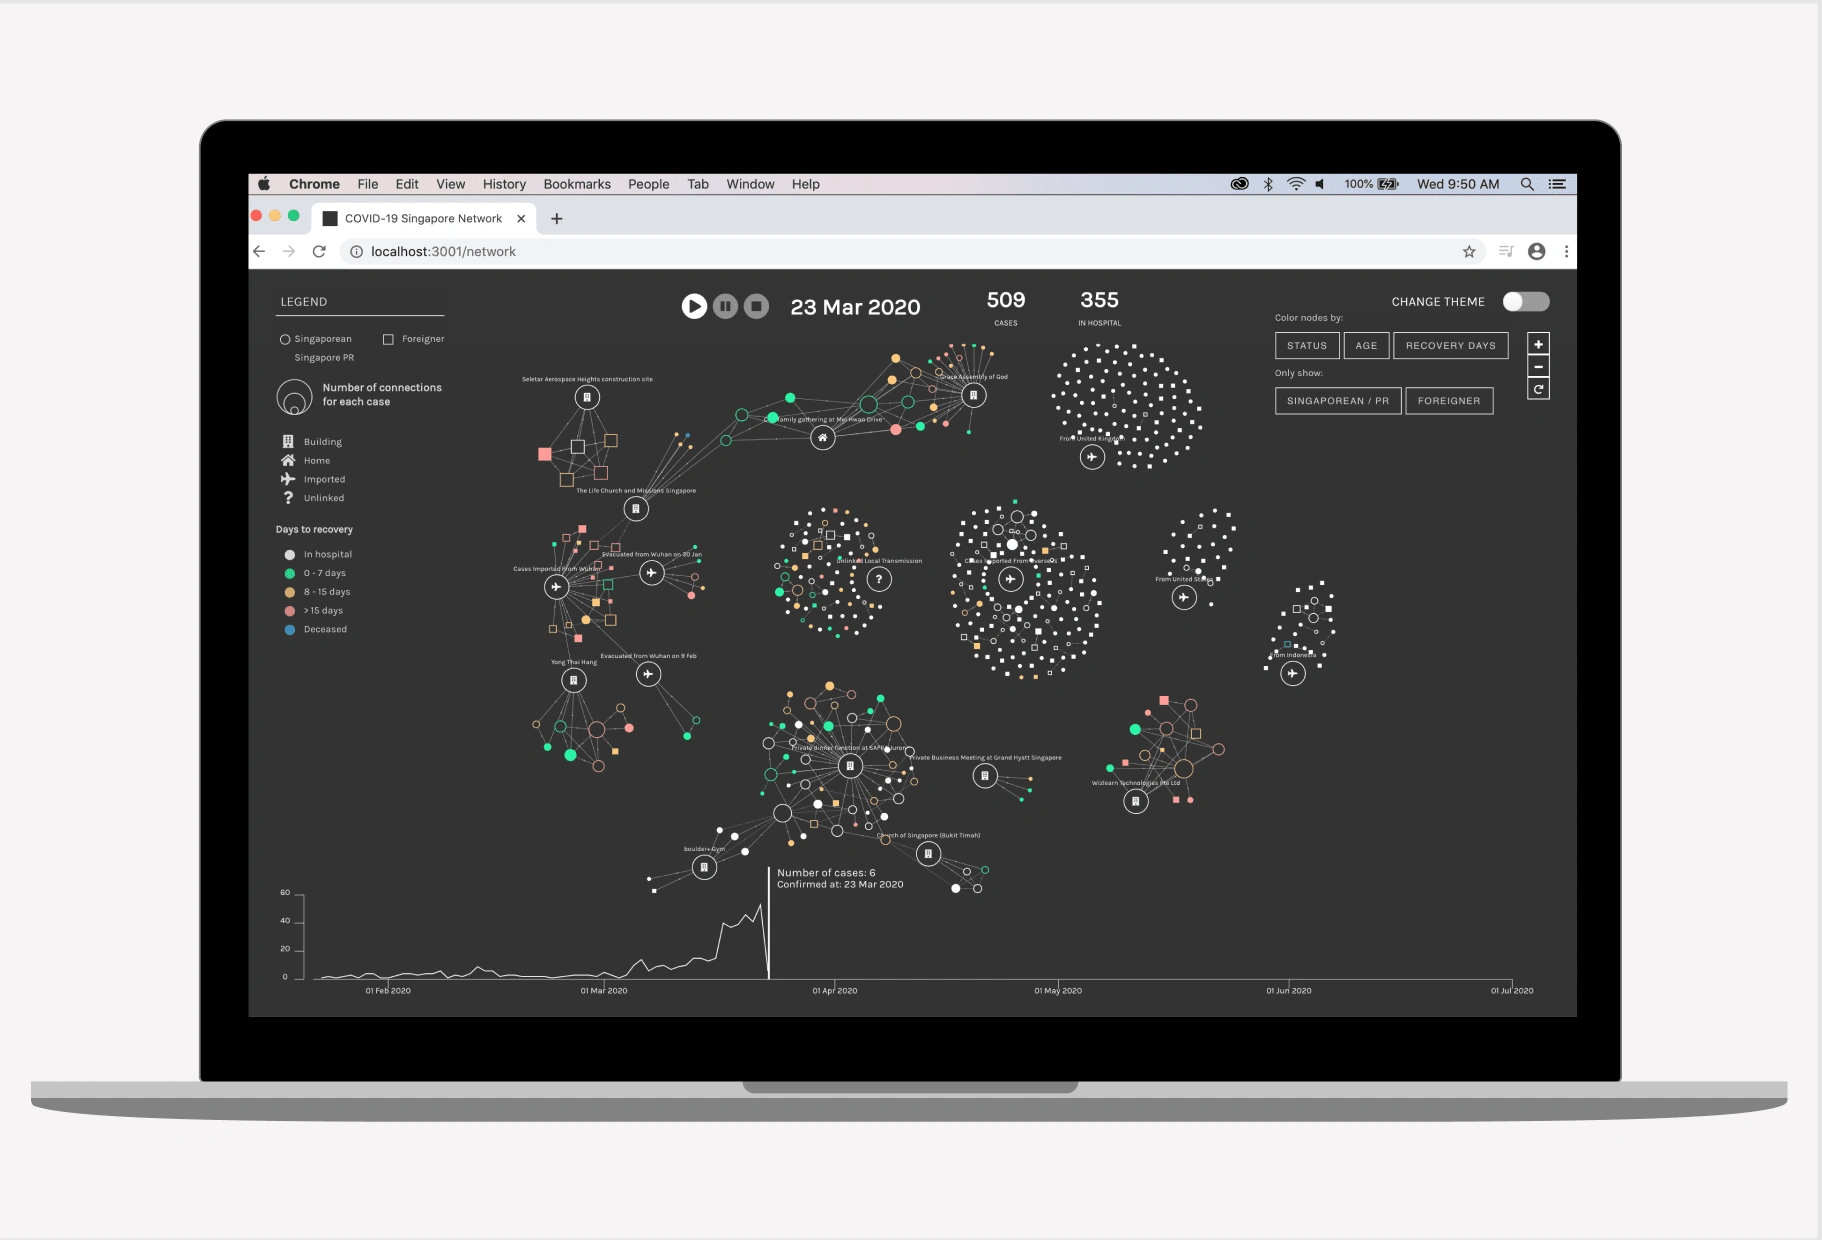
The graph network below use figures from a dataset of every confirmed COVID-19 case announced since January 24, 2020 when the country’s first case was reported, to March 23, 2020 The data tracks confirmed cases by gender, age, status, source of infection and other information published in case reports and official press releases from Singapore's Ministry of Health (MOH). I created an animation to track the growth and spread of COVID-19 cases over time, with the network helping to visualize the relationships between cases.
With the timeline animation, it is possible to track which cases were initially unlinked and eventually discovered to belong to a new cluster by the movement of nodes from one point to another and simultaneous creation of edges. The animation visualizes the growth of COVID-19 cases over two months (Jan 24 to March 23). It certainly felt alarming to see how the empty canvas was gradually filled up with hundreds of nodes!
Like this project
Posted Apr 24, 2025
I created an animation to track the growth and spread of COVID-19 cases in Singapore, with the network helping to visualize the relationships between cases.
Likes
0
Views
8
Timeline
Jan 24, 2020 - Mar 23, 2020