Executive Excel Dashboard for Sales Reporting

Geethasree Naguboina

Like this project
Posted Jan 21, 2026
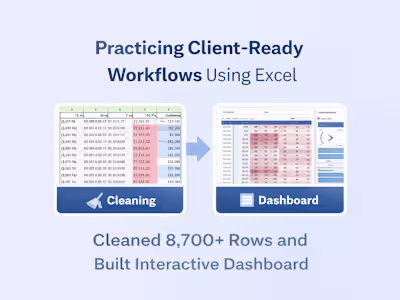
Built an interactive Excel dashboard to analyze sales, profit, and quantity trends with pivot tables, charts, and slicers for executive reporting.


Executive Excel Dashboard for Monthly Business Reporting
Project Overview
Business stakeholders often struggle with large Excel datasets that require manual filtering, repeated reporting, and time-consuming analysis. The goal of this project was to transform raw sales data into a clear, interactive Excel dashboard that allows decision-makers to track performance quickly without needing advanced Excel skills.
This dashboard was designed for monthly and quarterly business reporting, enabling leadership to monitor sales, profit, and operational trends at a glance.
The Problem
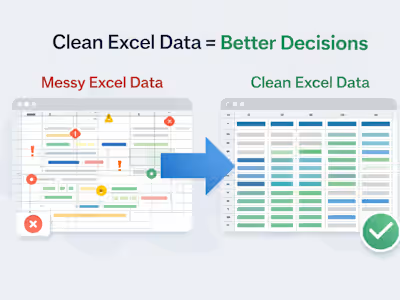
The original dataset contained thousands of rows of transactional sales data spread across multiple years, regions, customer segments, and product categories. While the data was comprehensive, it was difficult to extract insights efficiently.
Key challenges included:
No centralized view of sales performance
Manual reporting for monthly and quarterly reviews
Difficulty comparing regions, segments, and shipping modes
High risk of errors due to repeated manual analysis
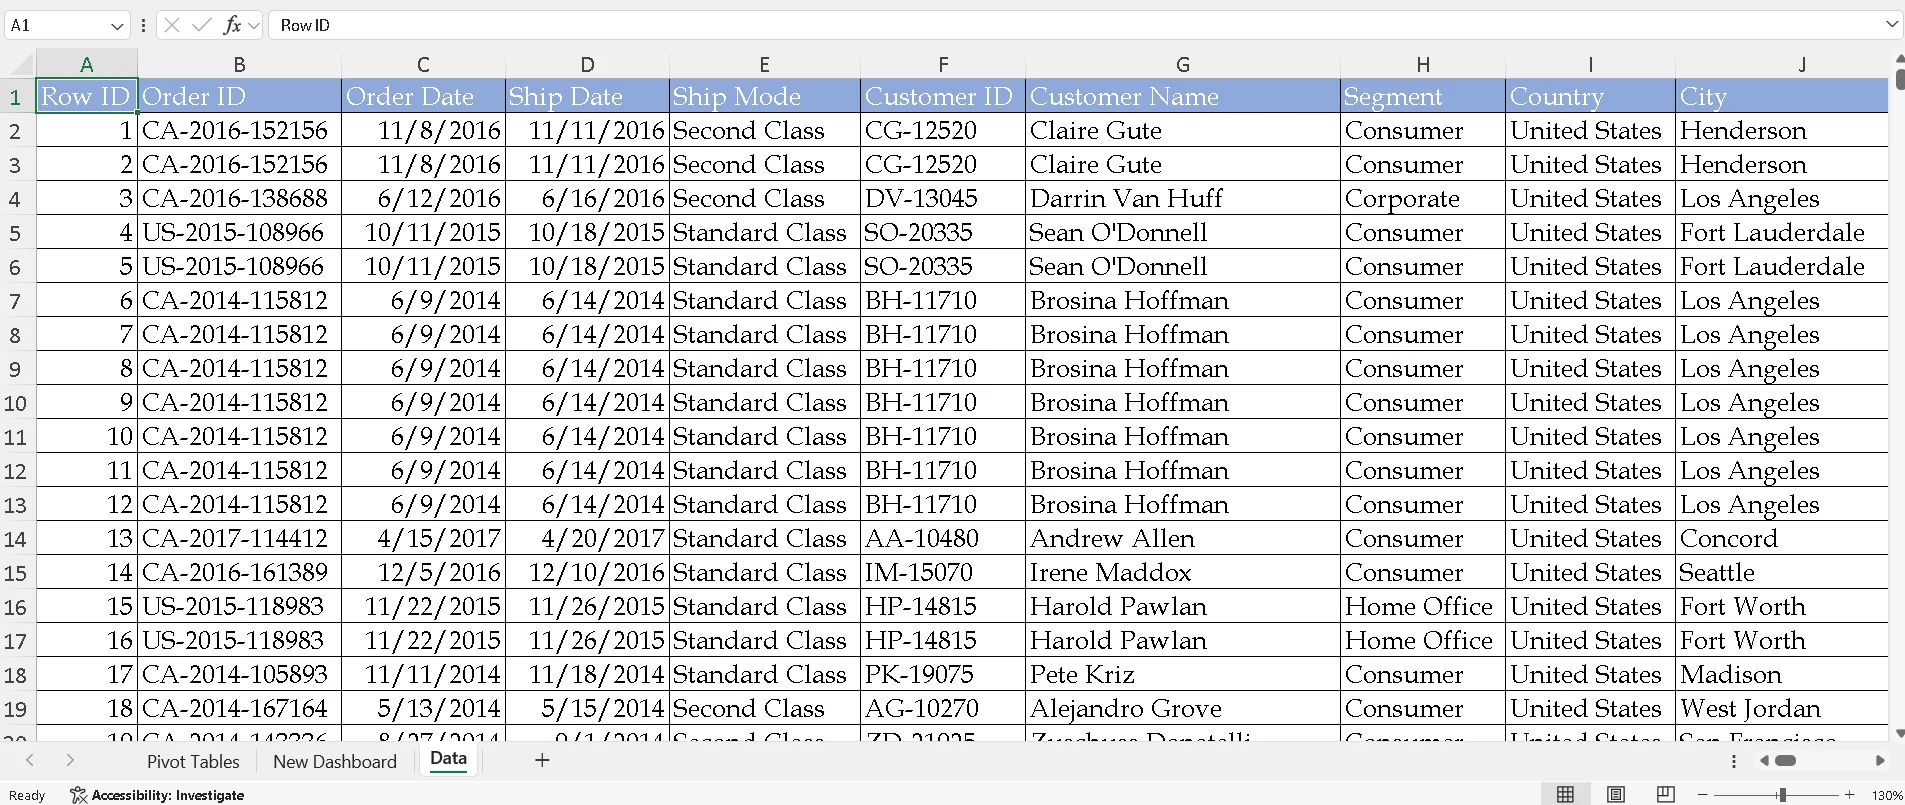
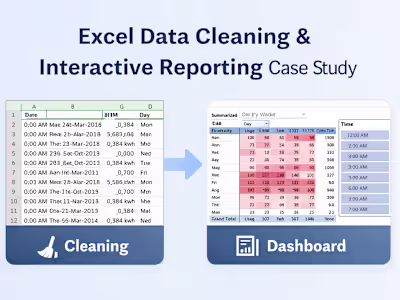
Data Cleaning
Data Preparation & Analysis
The raw dataset was cleaned and structured to ensure accurate reporting. Key steps included:
Validating dates, categories, and segment labels
Structuring data for time-based analysis (year and quarter)
Creating pivot tables to summarize:
Sales by year and quarter
Quantity by product sub-category
Profit by region
Quantity distribution across customer segments
These pivot tables formed the analytical foundation for the dashboard and ensured consistency across all views.
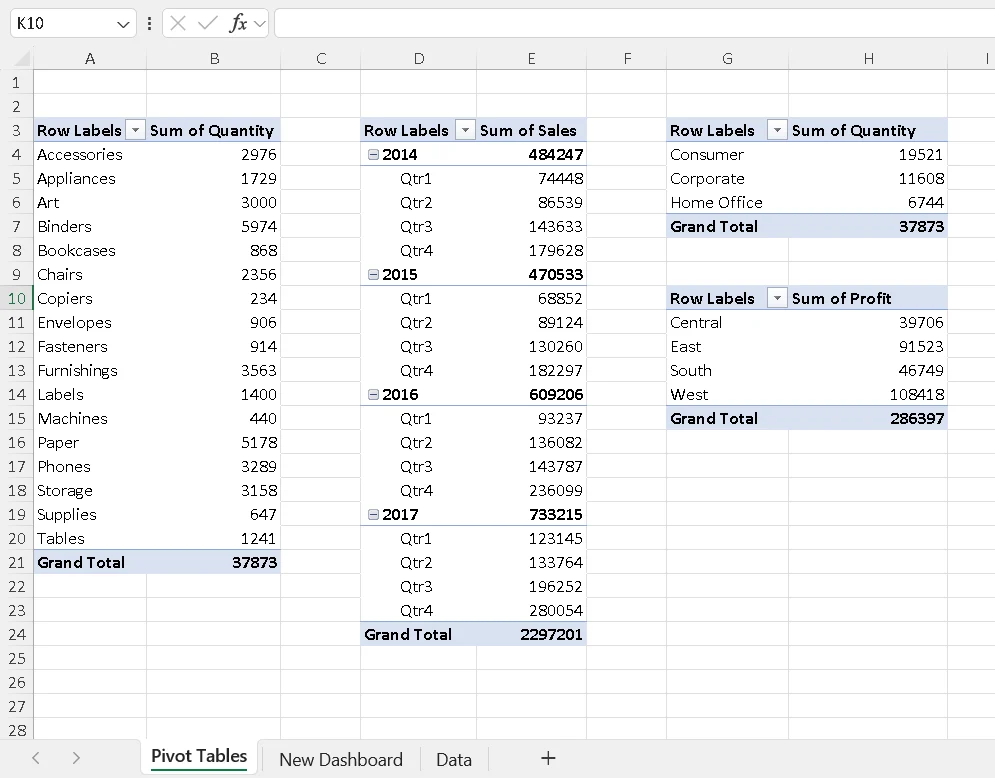
Pivot Tables
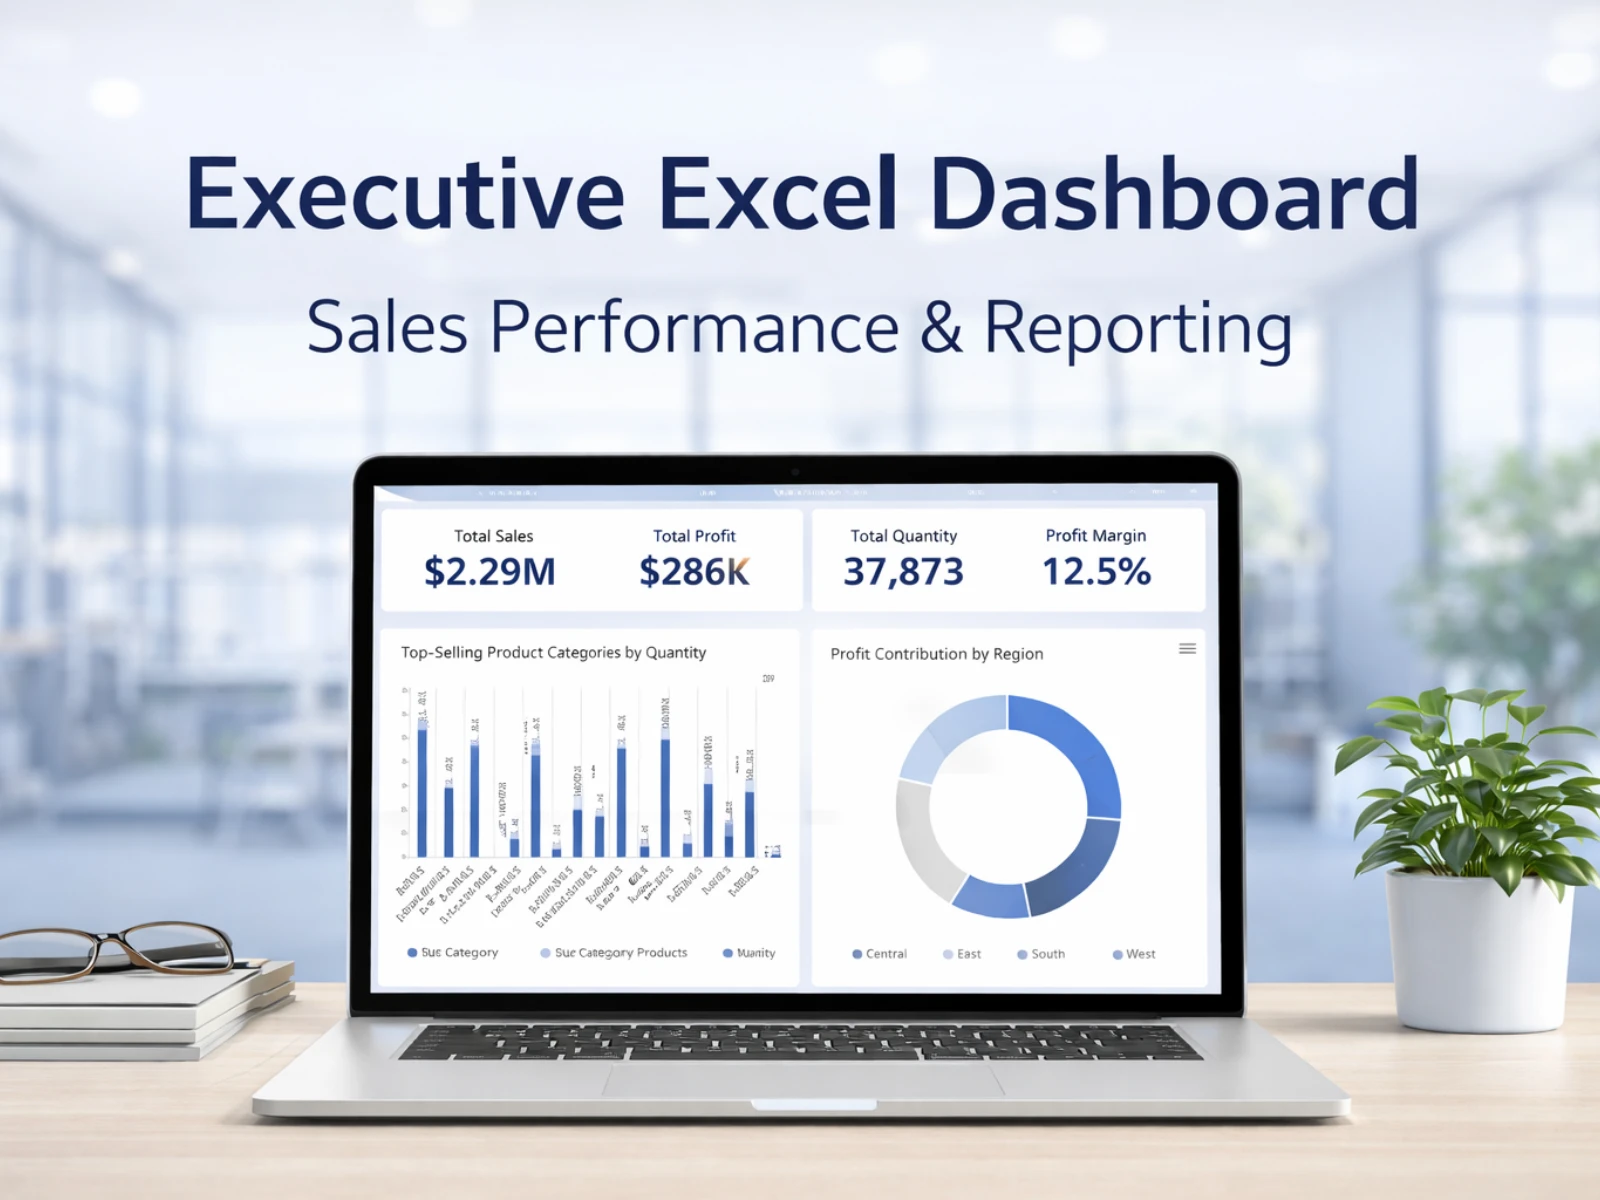
Dashboard Design & Features
An executive-friendly Excel dashboard was built using pivot charts and slicers to allow dynamic filtering and exploration.
Key features include:
Sub-category-wise quantity analysis
Year and quarter-based sales trends
Segment-wise quantity distribution
Region-wise profit analysis
Interactive slicers for:
Shipping mode
Customer segment
Region
The dashboard updates automatically when filters are applied, allowing stakeholders to explore scenarios without modifying formulas or source data.
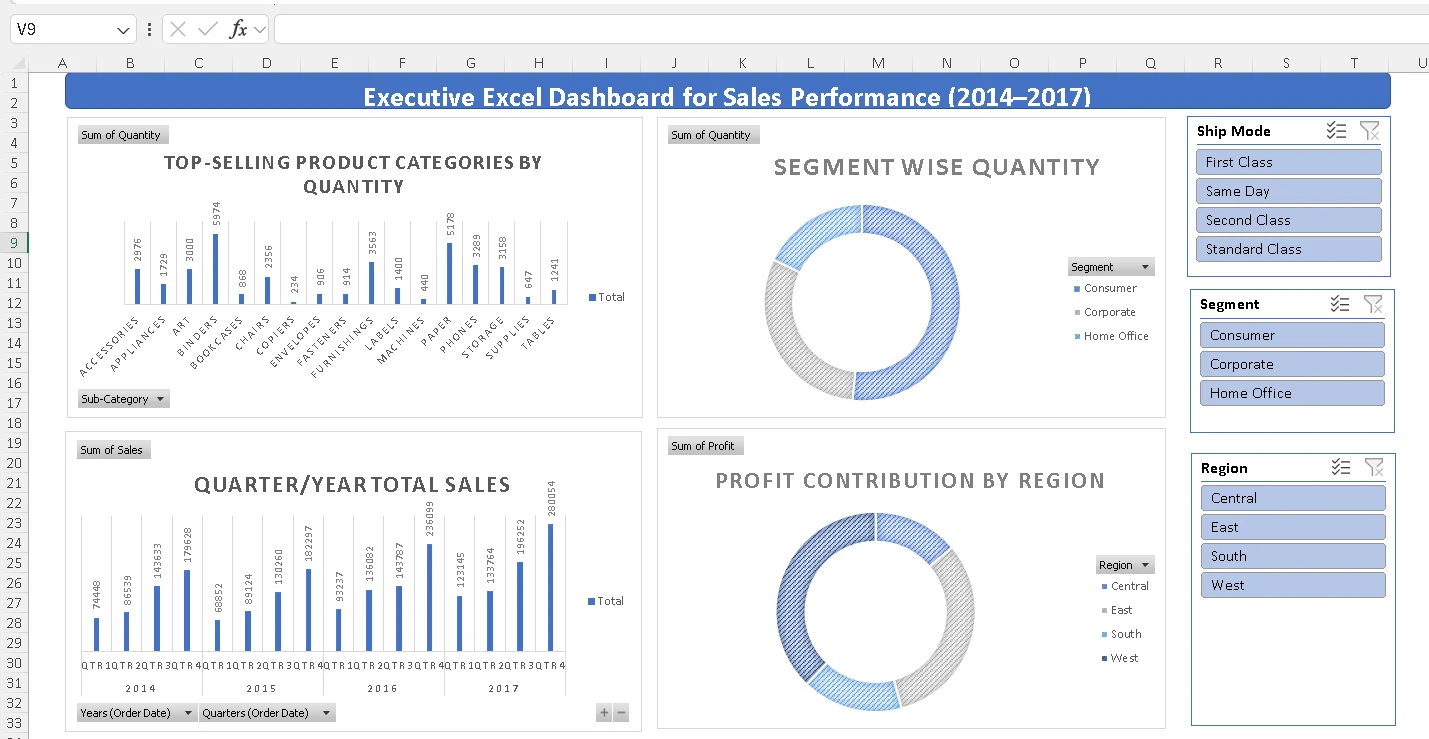
Sales Dashboard
Business Value Delivered
This solution replaced static, manual reports with a self-serve reporting tool that:
Reduced reporting time from hours to seconds
Improved visibility into regional and segment performance
Enabled faster, data-driven decision-making
Provided a clean, professional reporting format suitable for leadership reviews
The dashboard can be reused for ongoing monthly reporting with minimal maintenance.
Tools & Skills Used
Microsoft Excel
Data Cleaning & Structuring
Pivot Tables & Pivot Charts
Interactive Dashboards
Business Reporting & Analysis
Use Case
Ideal for:
Business owners
Operations managers
Sales leadership teams
Analysts needing recurring Excel-based reporting