Turning messy Excel data into an interactive dashboard 📊 In...
Geethasree Naguboina
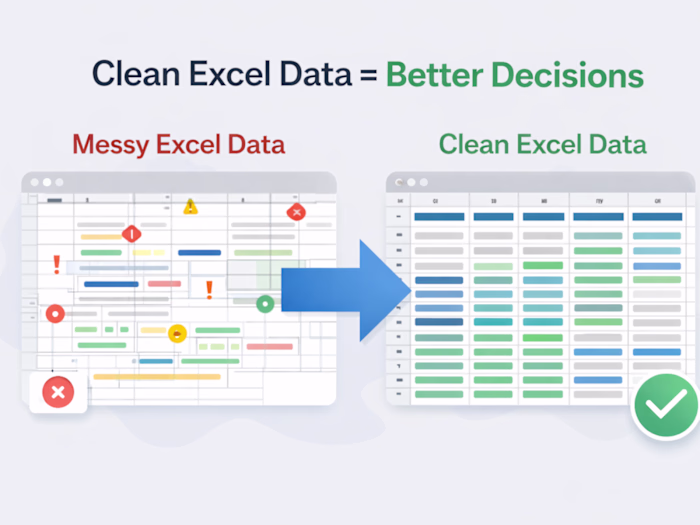
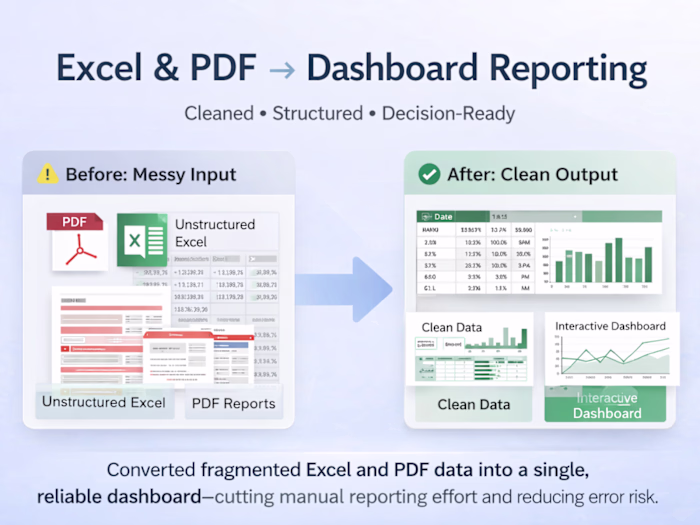
Turning messy Excel data into an interactive dashboard 📊
In my latest Excel case study, I worked with a raw, unstructured dataset (8,700+ rows) and focused on doing the fundamentals right:
• Cleaned inconsistent time, date, and text values
• Structured the data for accurate analysis
• Built pivot tables with day, month, and time logic
• Added slicers and conditional formatting for interactivity
No fancy tools — just solid Excel workflows that make data reliable and easy to explore.
This is exactly how I approach real client data:
clean first → structure next → visualize last.
👉 Full case study is live on my profile.
Like this project
Posted Jan 16, 2026
Turning messy Excel data into an interactive dashboard 📊 In my latest Excel case study, I worked with a raw, unstructured dataset (8,700+ rows) and focused ...