Optimizing Data Engineering Pipeline for Streamlined Processing
Pratik Srivastava
Client Overview
Our client, a prominent multinational corporation in the manufacturing sector, was seeking a robust solution to manage and analyze their vast operations data. Previously, they were relying on manual processes and Excel spreadsheets, which were time-consuming and prone to errors. The lack of a unified view of their operations was a significant hurdle in their decision-making process.
Problem
The client was dealing with a complex array of data sources, each containing crucial information about different aspects of their operations. The manual handling of data using Excel was not only inefficient but also failed to provide the comprehensive insights they needed. The situation was further complicated by the diverse nature of their operations, which included various machine types, material items, orders, and budget distributions. This complexity made it challenging to consolidate and analyze the data effectively.
Approach
Understanding the gravity of the client's problem, we embarked on a mission to design a multi-page dashboard that could handle the complexity of the data while providing a user-friendly interface. We leveraged advanced data visualization techniques to present the data in an easy-to-understand format.
Solution
The solution was a comprehensive 3-page Power BI dashboard that transformed the way the client viewed their operations. Each section of the dashboard served a specific purpose:
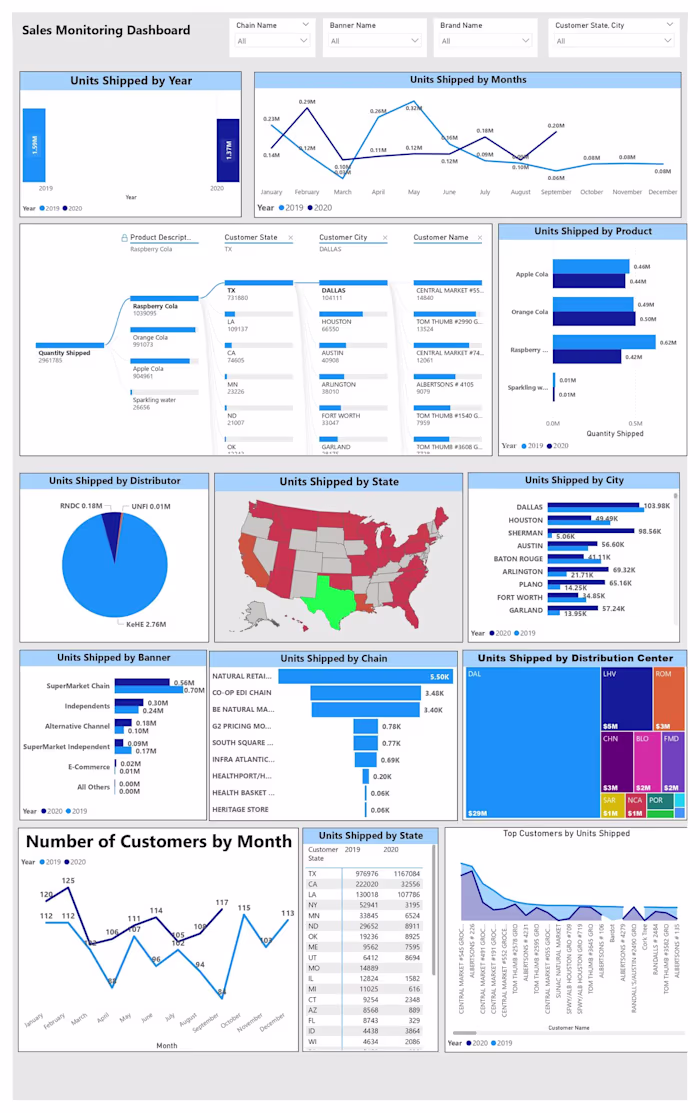
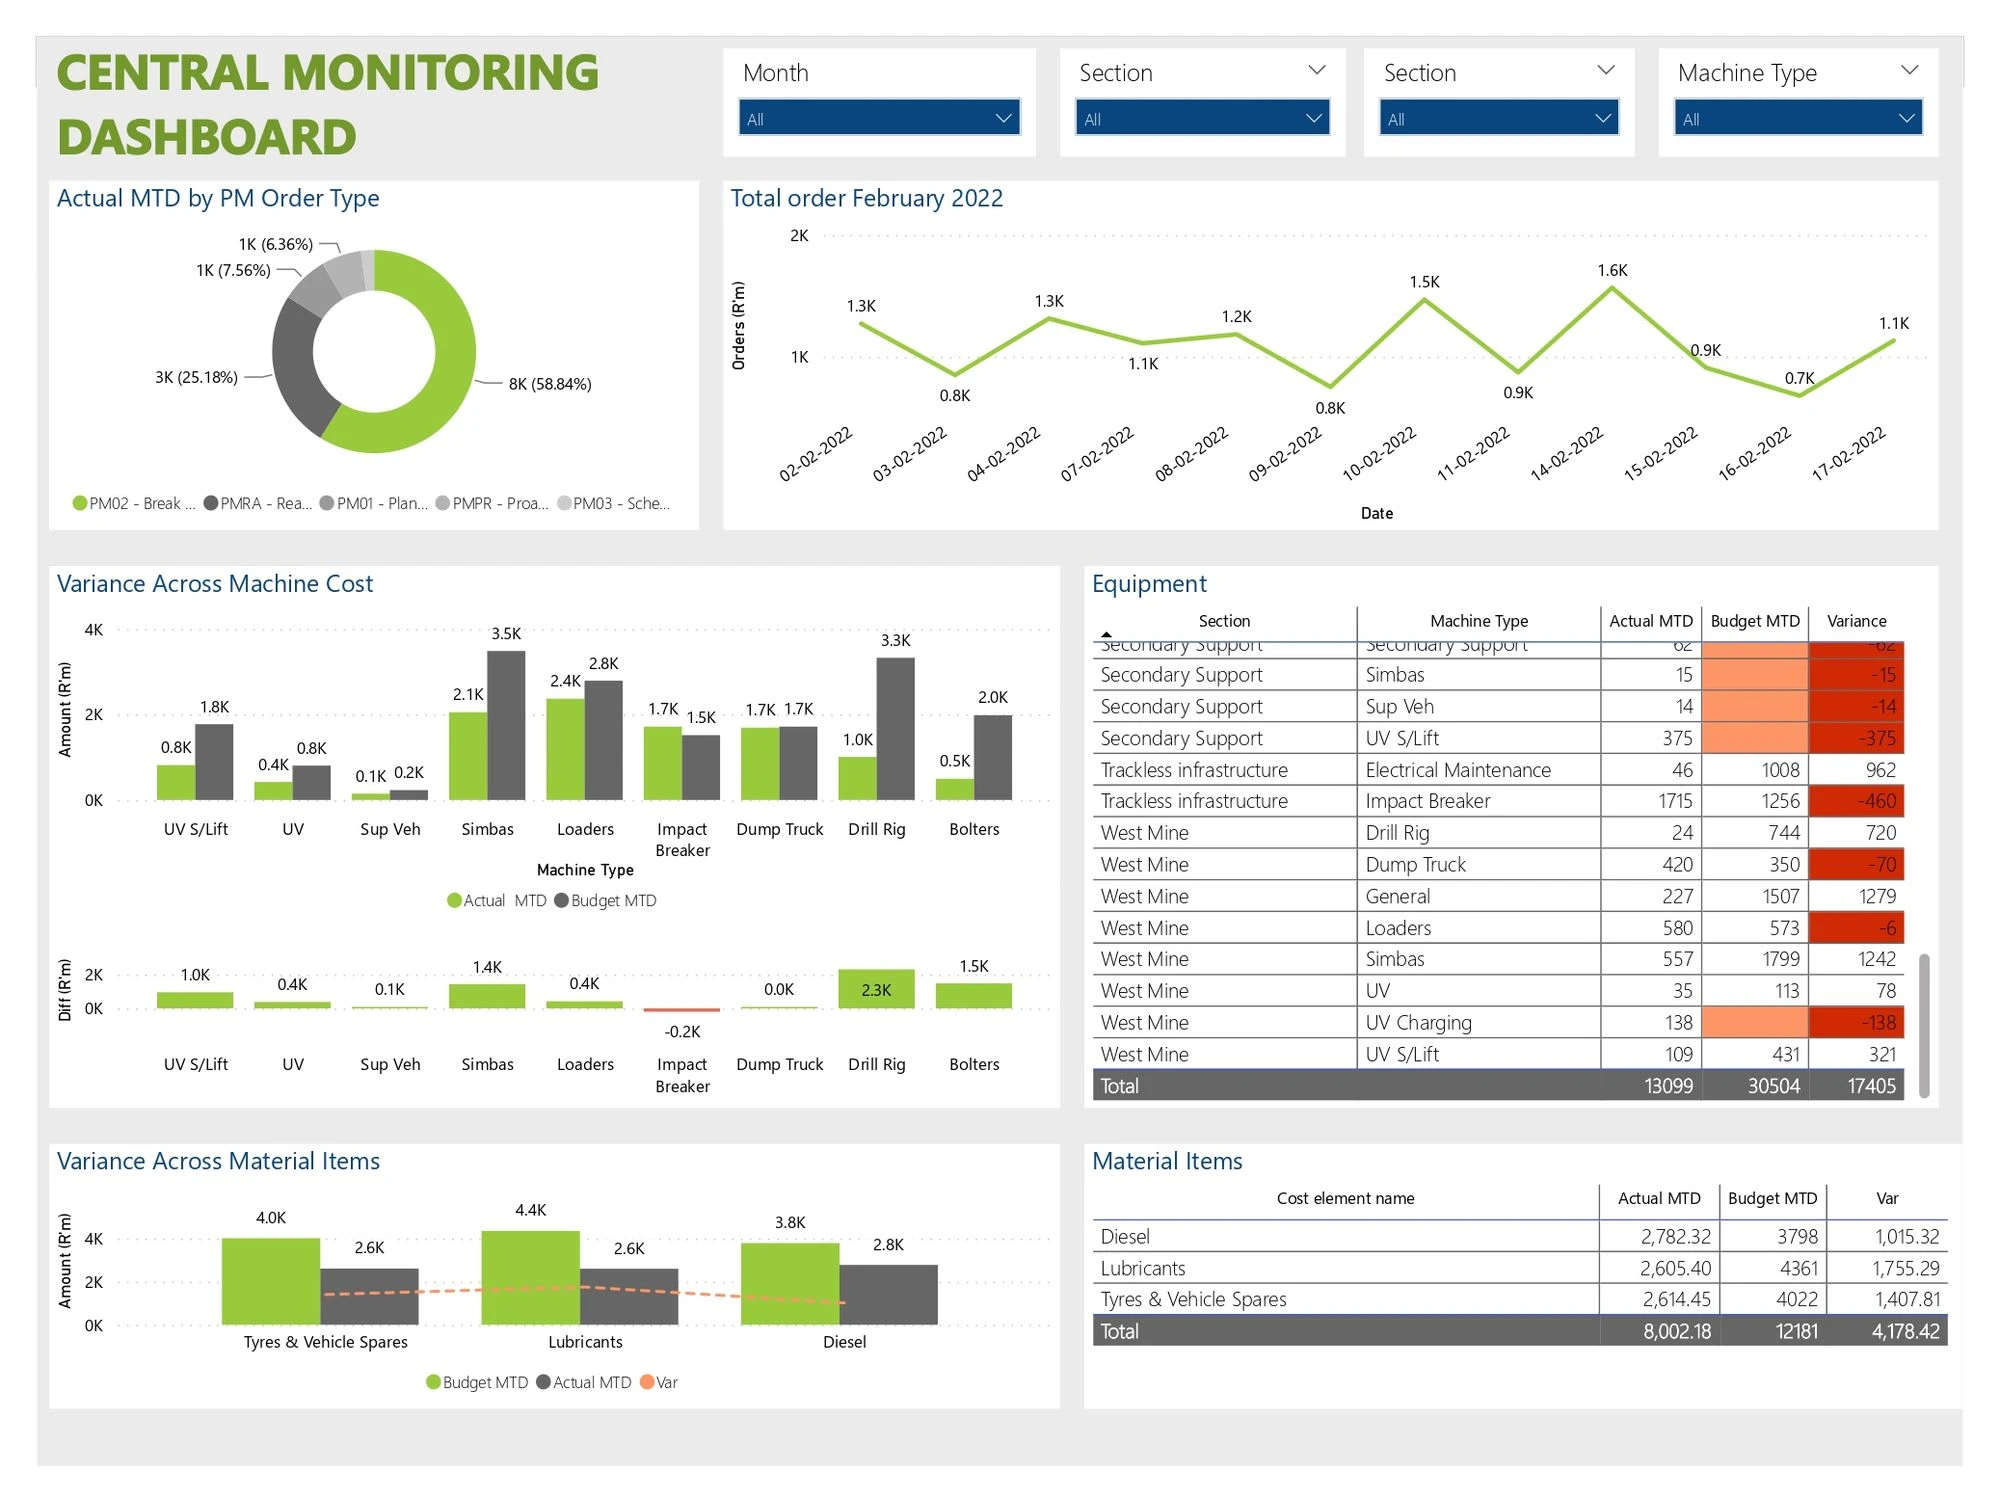
Overview: This section replaced the tedious task of manually collating data from different sources, providing a unified view of the Actual MTD, Budget MTD, Variance, and Machine Type.
Variance Across Machine Cost: This section enabled the client to identify cost inefficiencies across different machine types, leading to more informed budgeting decisions.
Total Order for a given period: This section eliminated the need for manual order tracking, providing an automated and accurate overview of the total orders for a given period.
Variance Across Material Items: This section helped the client to manage their resources more effectively by highlighting the variance across different material items.
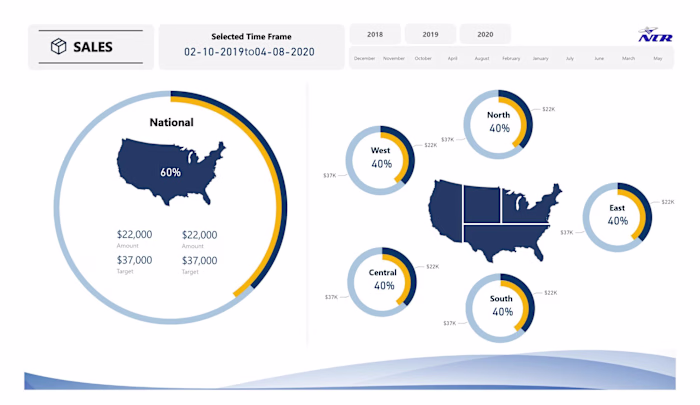
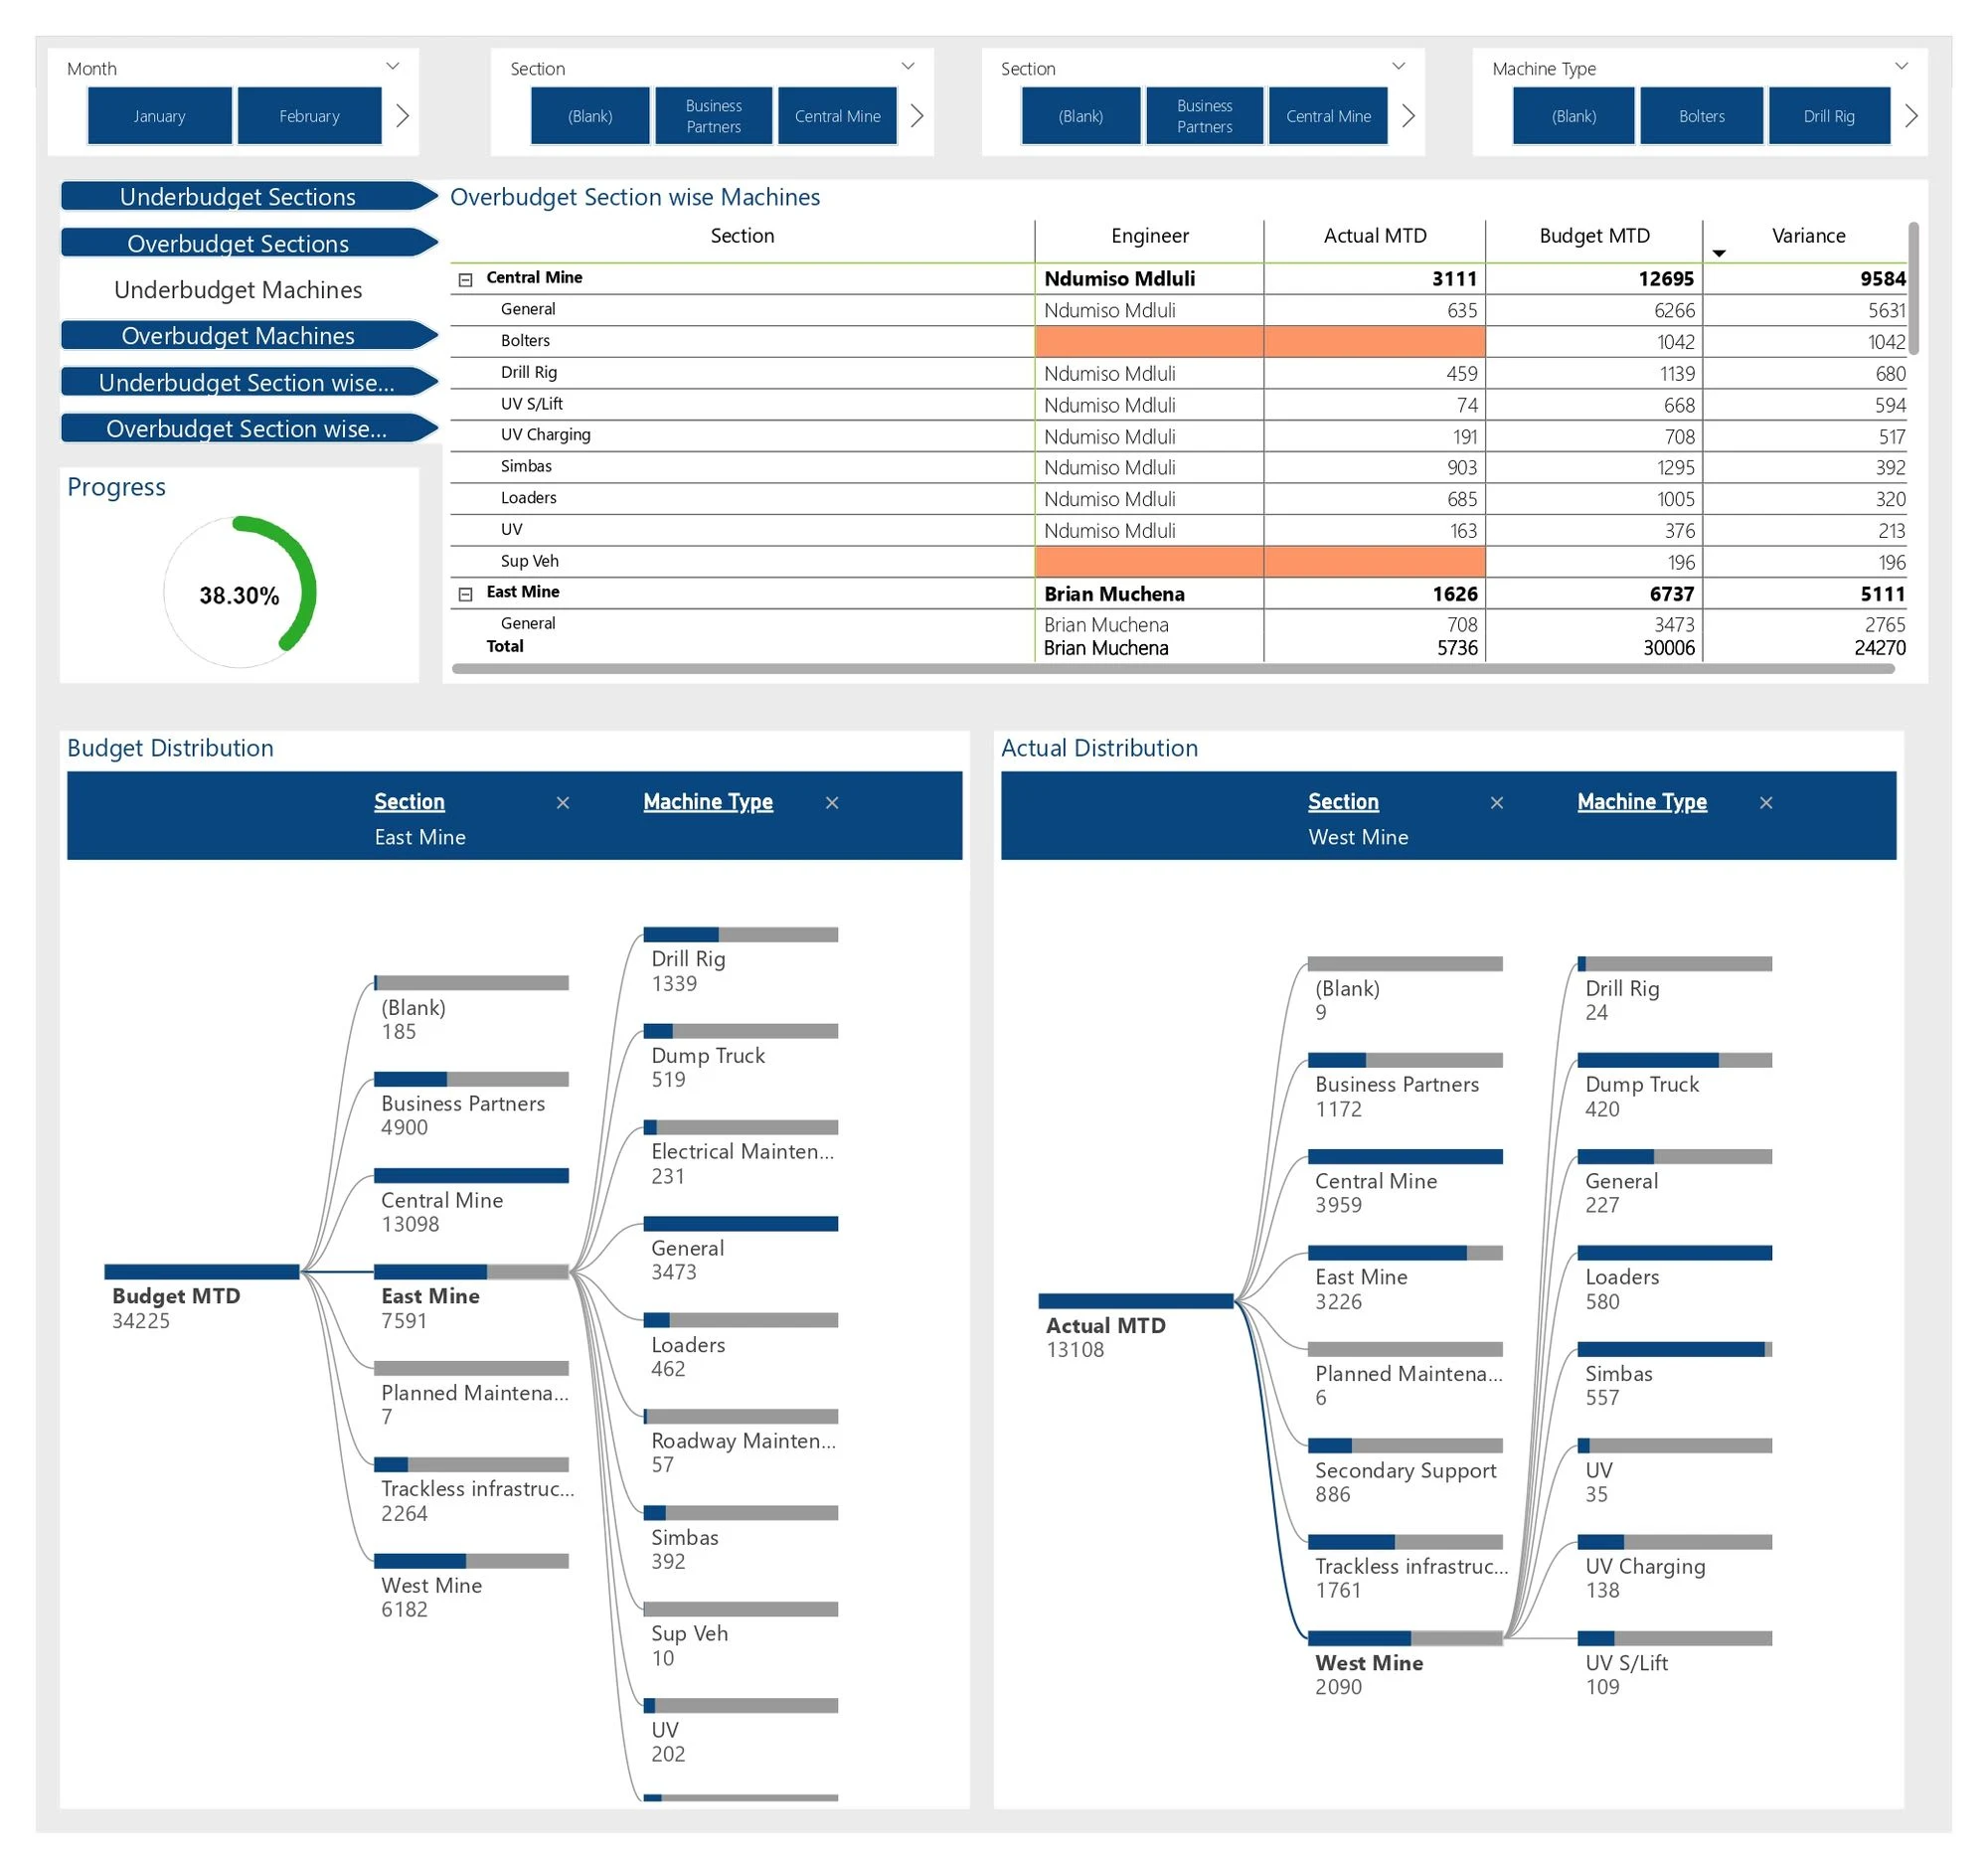
Progress: This section provided real-time updates on the progress made by different sections and engineers, enabling the client to identify areas for improvement and optimize their operations.
Budget Distribution: This section provided a clear picture of the budget distribution across different sections and machine types, aiding in financial planning and resource allocation.
Machine Type: This section offered a detailed breakdown of the actual distribution of machine types, providing insights into operational efficiency and resource utilization.
Result
The implementation of the Power BI dashboard revolutionized the client's operations. The client could now easily navigate through the multi-page dashboard and quickly understand the state of their business. The dashboard has become an indispensable tool for the client, enabling them to monitor their performance and make data-driven decisions. Despite the complexity of the project, the end product met the client's needs and significantly improved their operational efficiency.
Like this project
Posted Apr 18, 2024
I had streamlined a complex data engineering pipeline, improving efficiency and reducing processing time by 30%.
Likes
0
Views
31