E-commerce Website Analytics
Pratik Srivastava
Our client, a prominent US-based e-commerce company, was seeking a comprehensive solution to monitor and analyze their website traffic and user behavior. They wanted to understand the patterns and trends in these metrics to inform their marketing strategies and improve their website's performance.
Problem
The e-commerce company was grappling with a vast amount of data from their website, but they lacked a robust system to track, analyze, and visualize this data. They needed a comprehensive solution that would not only consolidate and present this data in a clear, understandable format but also seamlessly integrate with their website.
Approach
To address this challenge, we decided to implement a full-stack solution involving Google Analytics, Google Tag Manager, and Looker. Our approach involved the following steps:
Google Analytics and Google Tag Manager Integration: We started by integrating Google Analytics and Google Tag Manager with the client's website. This involved setting up the tracking code on the website, configuring the tracking parameters in Google Analytics, and setting up various tags and triggers in Google Tag Manager.
Data Collection and Preparation: With Google Analytics and Google Tag Manager successfully integrated, we were able to collect a vast amount of data about user demographics, user behavior, and e-commerce metrics. We used Google Tag Manager to clean and transform the data, ensuring it was in a suitable format for analysis.
Data Modeling: We created a data model to define the relationships between different data points. This model served as the foundation for our dashboard.
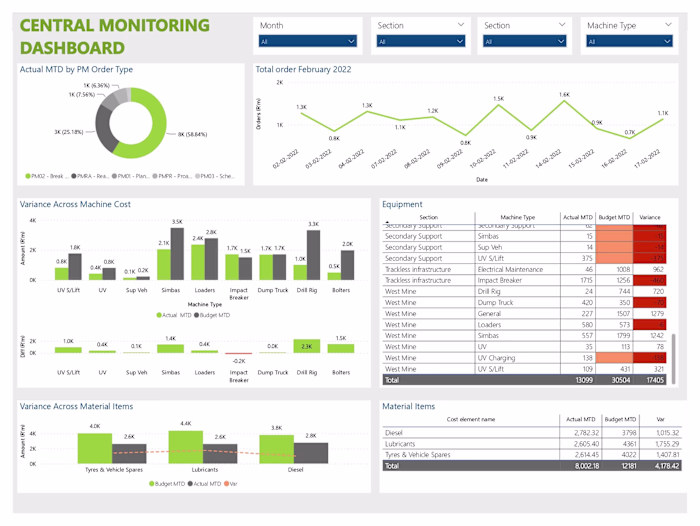
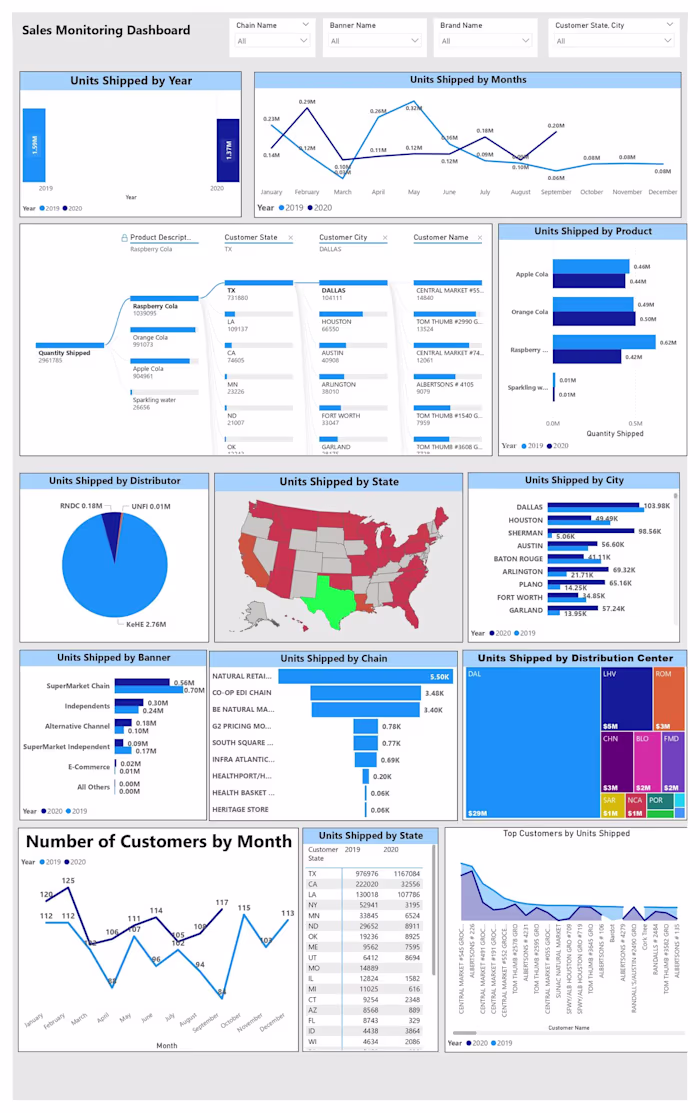
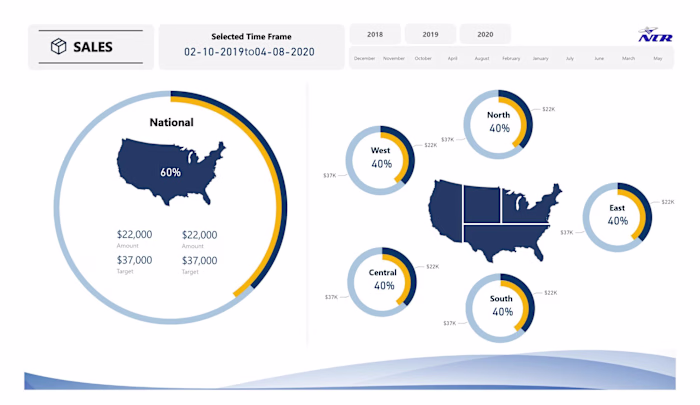
Dashboard Development: We designed and developed a Looker dashboard that would effectively visualize the data and provide the insights the client was looking for.
Solution
The Looker dashboard we created served as a powerful tool for the e-commerce company in their quest to understand their website traffic and user behavior. It provided a comprehensive overview of their Google Analytics data, visualizing complex data in an accessible and understandable way. This allowed the client to identify patterns and trends in these metrics, and use this information to inform their marketing strategies and improve their website's performance.
Result
The Looker dashboard was a success. The client reported a 10% increase in user engagement and a 15% increase in e-commerce conversion rate after implementing changes based on insights from the dashboard. Furthermore, the seamless integration of Google Analytics and Google Tag Manager with their website has streamlined their data collection and analysis process, making it easier for them to monitor their website's performance and make data-driven decisions.
Like this project
Posted May 11, 2021
Website analytics solution that provided the e-commerce company with powerful insights, leading to an increase in user engagement and a 15% rise in conversions