Enhancing Data Visualization for Retail Sales Analysis
Pratik Srivastava
Client Overview
Our client, a prominent US-based retail company, was seeking a comprehensive solution to monitor and analyze their sales data. They wanted to understand the patterns and trends in these metrics to inform their sales strategies and improve their overall performance.
Problem
The retail company was grappling with a vast amount of sales data stored in a cloud server, but they lacked a robust system to track, analyze, and visualize this data. They needed a comprehensive solution that would not only consolidate and present this data in a clear, understandable format but also provide an automated and real-time monitoring system.
Approach
After several discussions with the client's stakeholders to understand their requirements, we proposed a solution involving Power BI. Our approach involved the following steps:
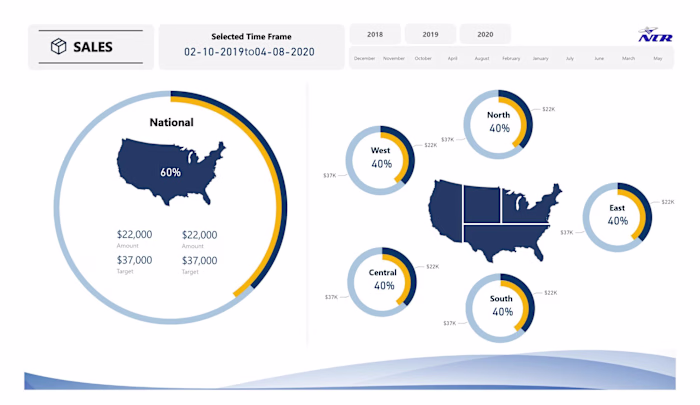
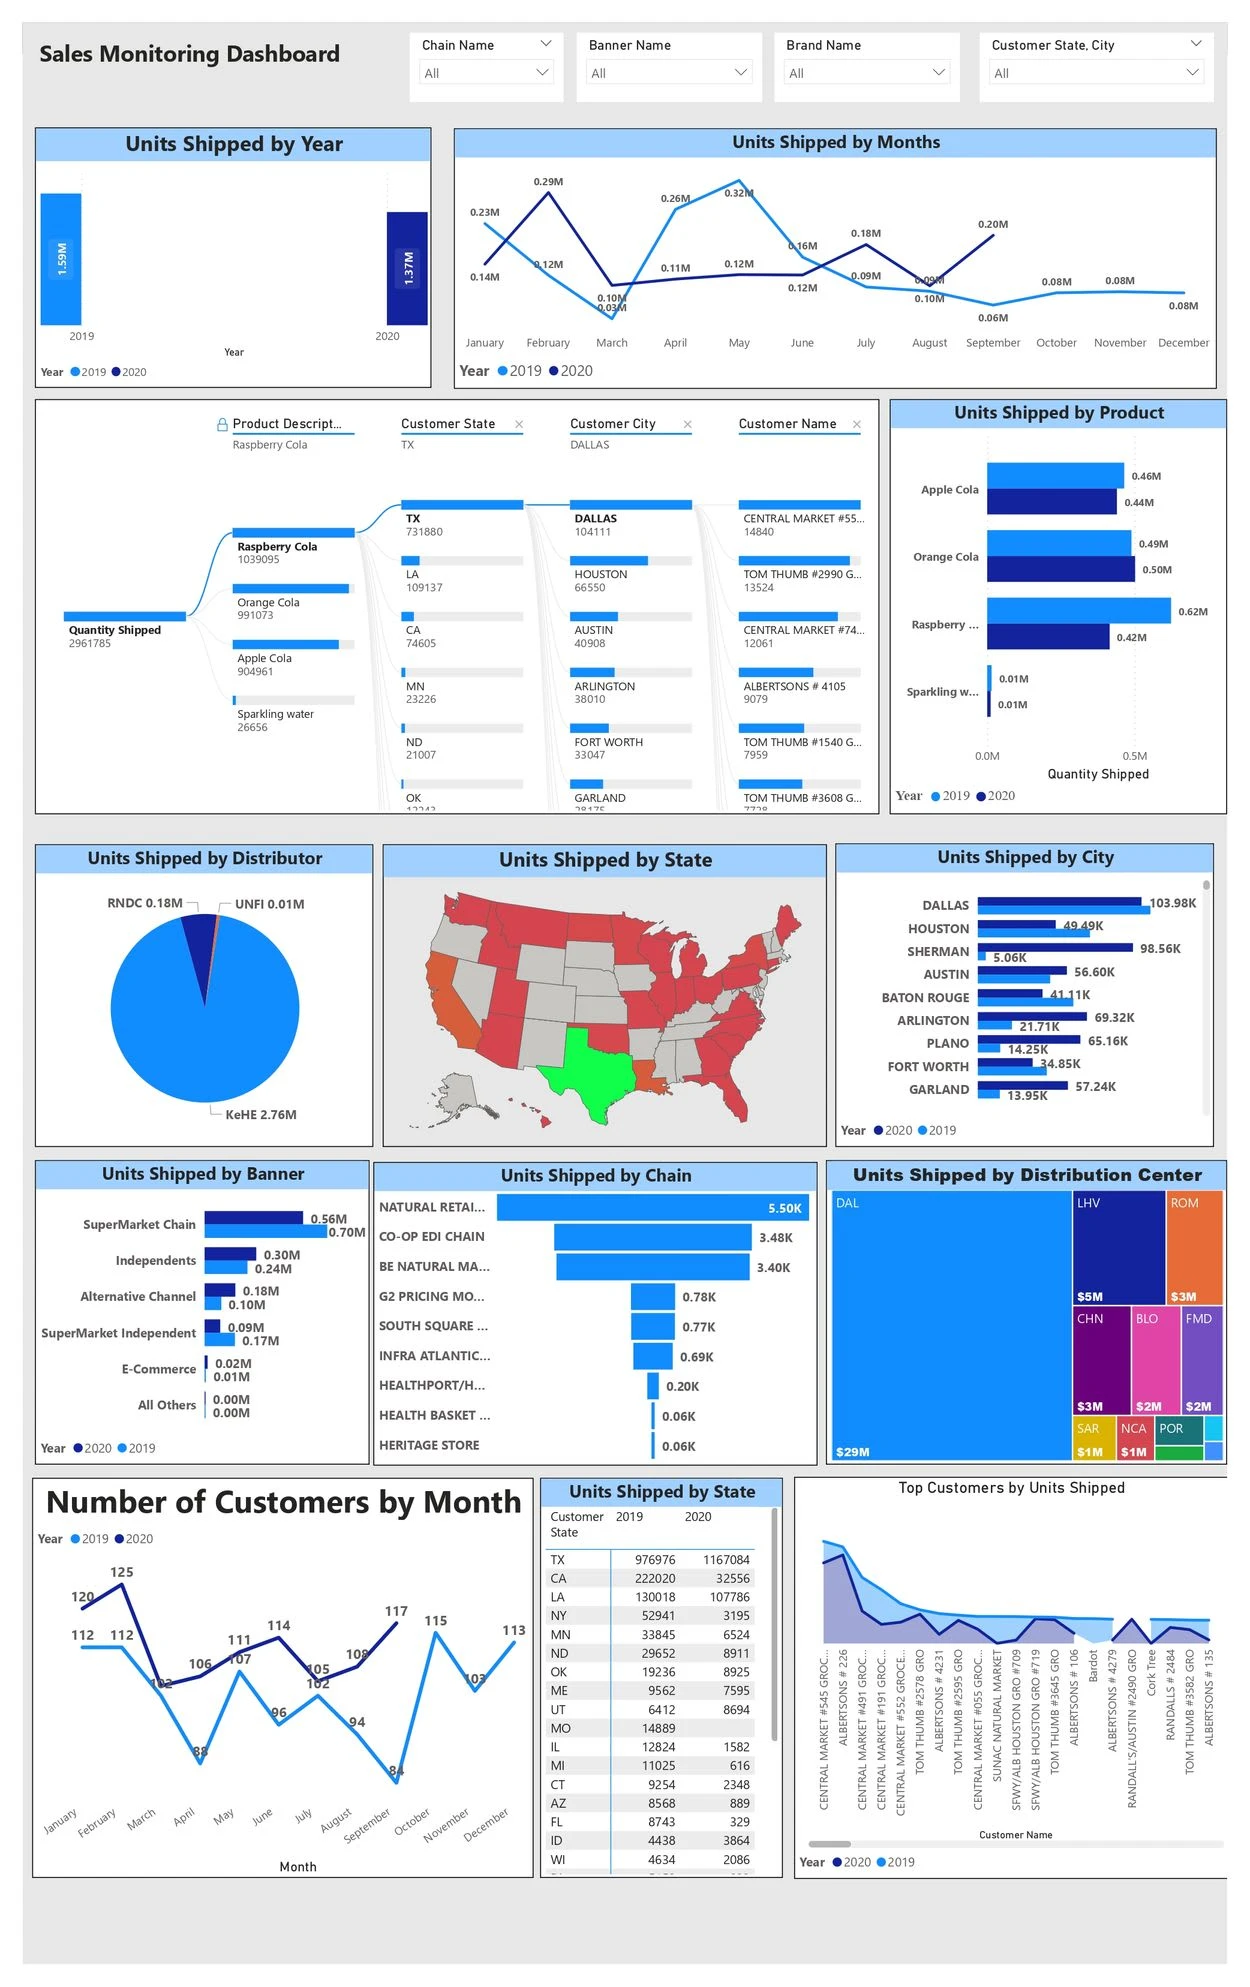
Data Collection and Preparation: We started by setting up an automated process to extract the sales data from the client's cloud server every hour. This data was comprehensive, including details about units shipped by year, month, distributor, product, state, city, and customer.
Data Modeling: We created a data model to define the relationships between different data points. This model served as the foundation for our dashboard.
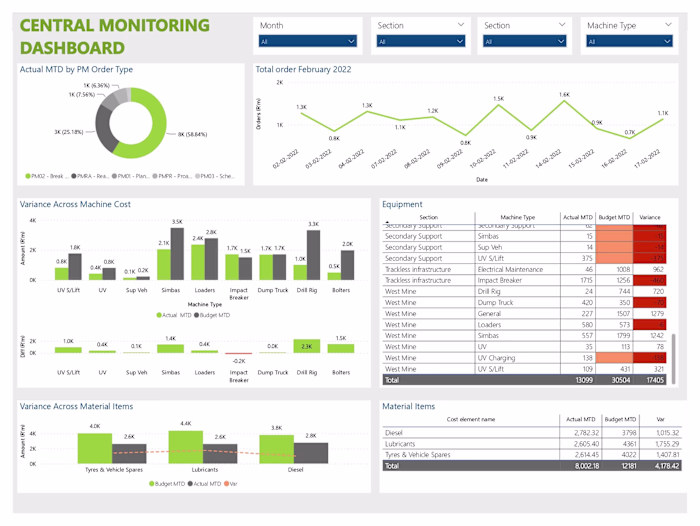
Dashboard Development: We designed and developed a Power BI dashboard that would effectively visualize the data and provide the insights the client was looking for.
Solution
The Power BI dashboard we created served as a powerful tool for the retail company in their quest to understand their sales shipping data. It provided a comprehensive overview of their data, visualizing complex data in an accessible and understandable way. This allowed the client to identify patterns and trends in these metrics, and use this information to inform their sales strategies and improve their overall performance.
Result
The Power BI dashboard and the automated data extraction process were a success. The client reported the following improvements:
A 15% increase in dispatch efficiency, as the real-time monitoring system allowed them to quickly identify and respond to sales trends.
An overall improvement in the data collection and analysis process, as the seamless integration of Power BI with their cloud server made it easier for them to monitor their shipping data and make data-driven decisions.
Like this project
Posted Apr 18, 2024
I had successfully created interactive dashboards to visualize and analyze retail sales data, providing actionable insights for decision-making.
Likes
0
Views
23