
Table of Contents
Project Details
This project is mainly about querying a music store an then use the output of the queries and transform it into a CSV file and take that sheet into excel to get some visually appealing results from some very basic charts yet very meaningful.
So much important concepts from SQL where used in the project.
I used PostgreSQL and used the Entity Relationship Diagram (ERD) of the database to complete the project.
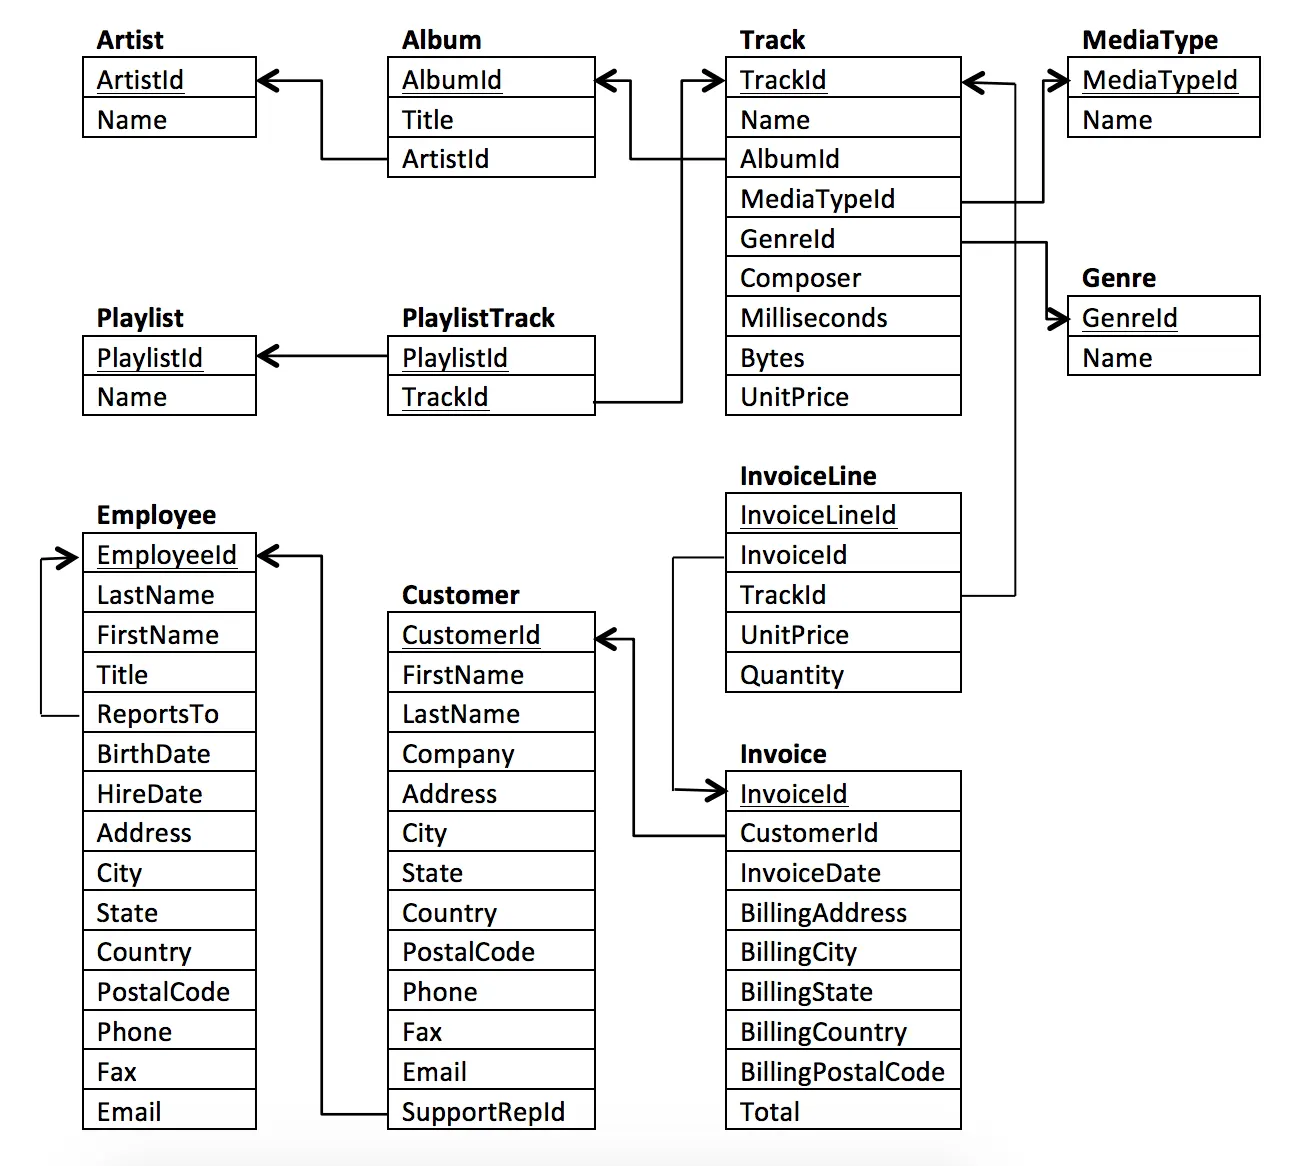
Entity Relationship Diagram (ERD) of the database
Queries and Visuals
Query #1
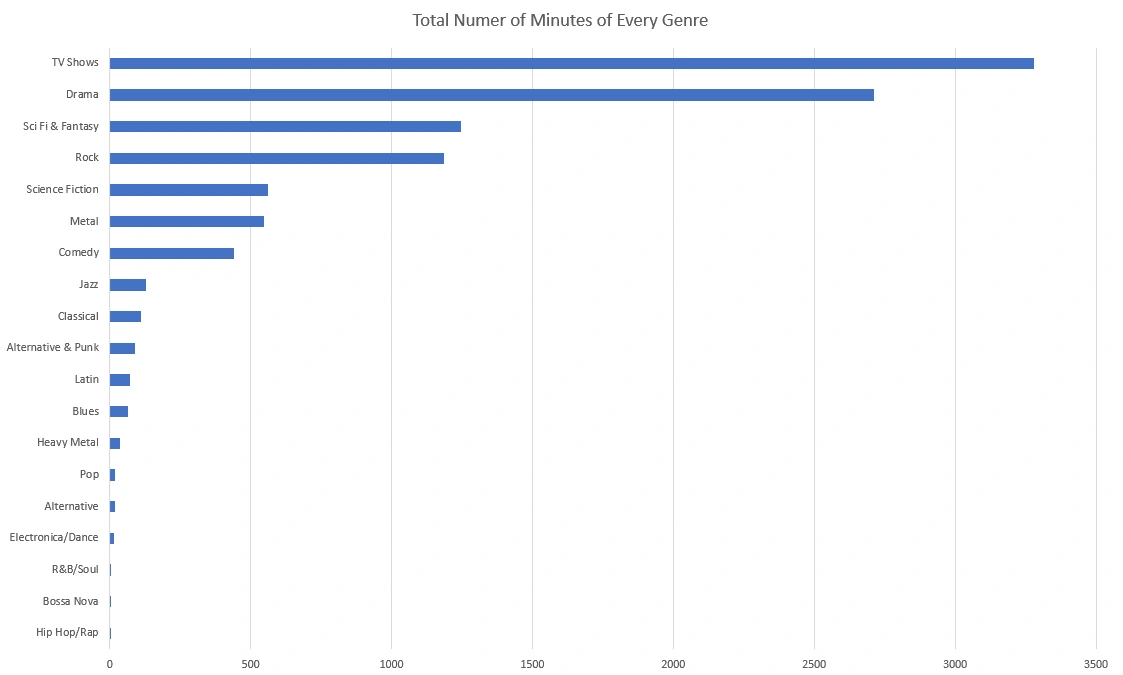
total number of minutes of sold genres in the store
We can notice that the longest (by total minutes) genres are related to movies and TV shows like Science Fiction, Sci-Fi & Fantasy, Drama, and TV Shows.
Another thing that can be noticed is that even though a genre like Rock has a much greater number of tracks than a genre like Sci-Fi & Fantasy and Drama, the total minutes for them is higher as their tracks tend to be longer than Rock tracks.
Query #2
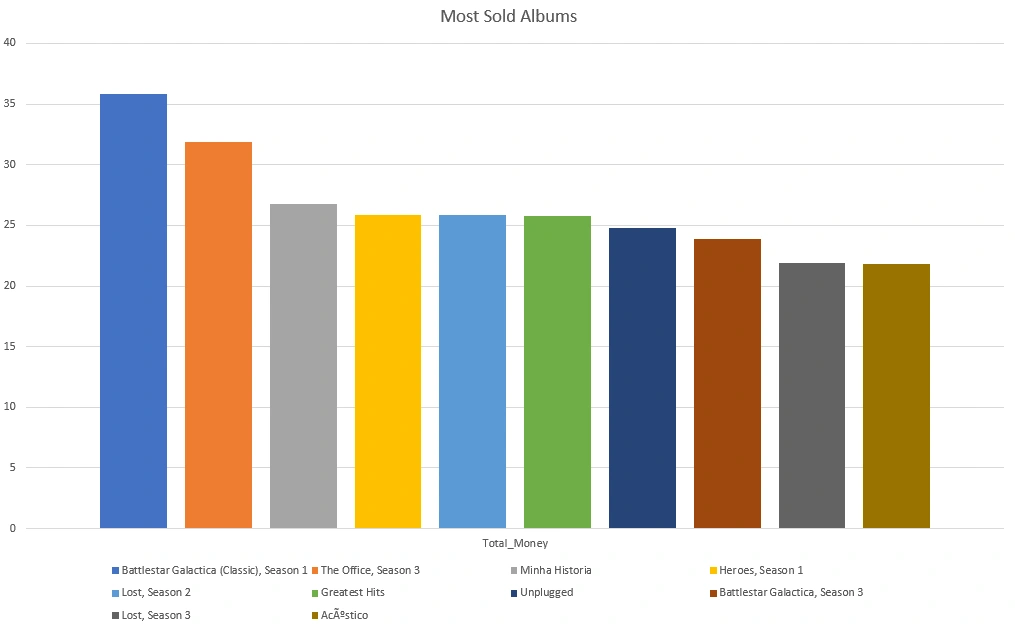
Most sold albums from the store
Using Query 2 to get the most sold albums by the store and then limiting the results to only 10 raws to just see clearly by a bar chart the 10 most sold.
We can clearly notice that the “Battlestar Galactica (Classic), Season 1“ album is the most sold by the store with a total earning of 35.82 $.
Query #3
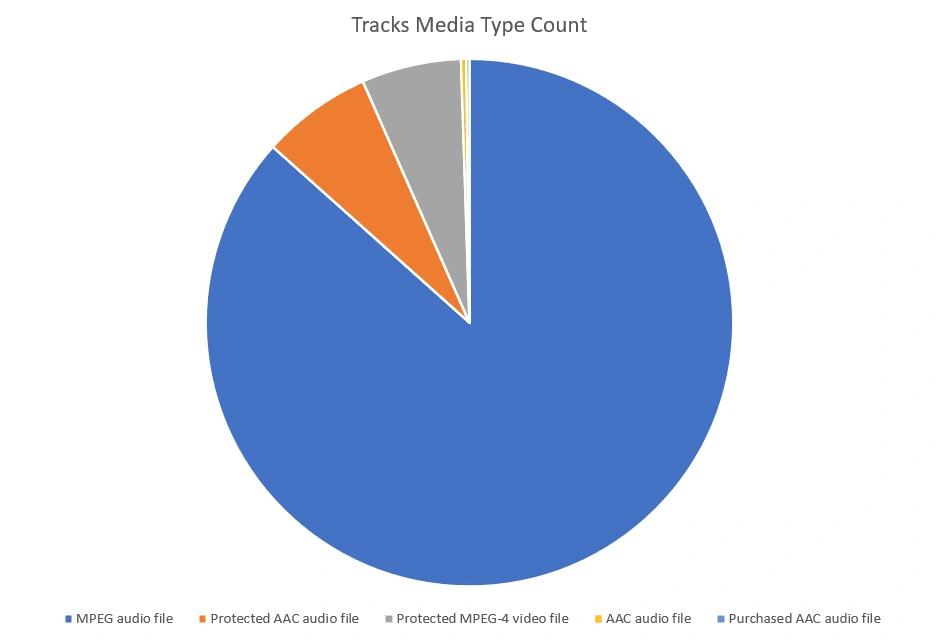
Media Type of Sold Tracks
From this Pie Chart, we notice two things
MPEG audio file is the most popular media type used by more than 85 % of the customers.
The AAC audio file and Purchased AAC audio files are rarely ordered from the store and they can be considered outliers.
Query #4
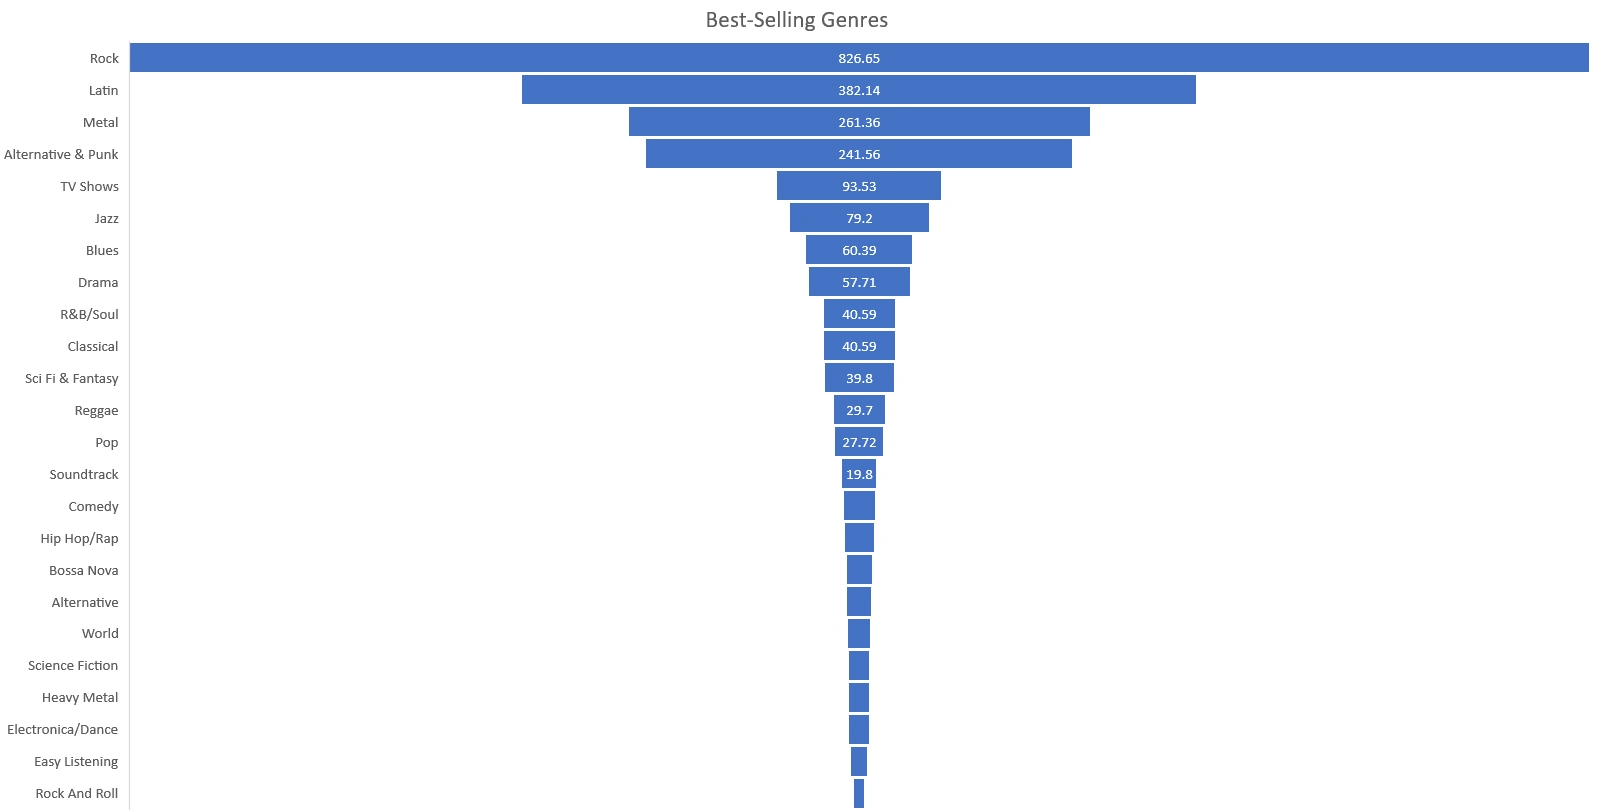
Best-Selling Genres
We can see that Rock is the most sold genre and hence the most popular one too. We can also notice that more than 60 % of the earnings of the store come from the top 4 genres (Rock, Latin, Metal, and Alternative & Punk).
0 likes · 23 views · Jan 30, 2023
Querying a music store database to get some insights from it and take the output into a CSV file to visualize it and get meaningful results from the database.

