What Lies Beyond Data 📊
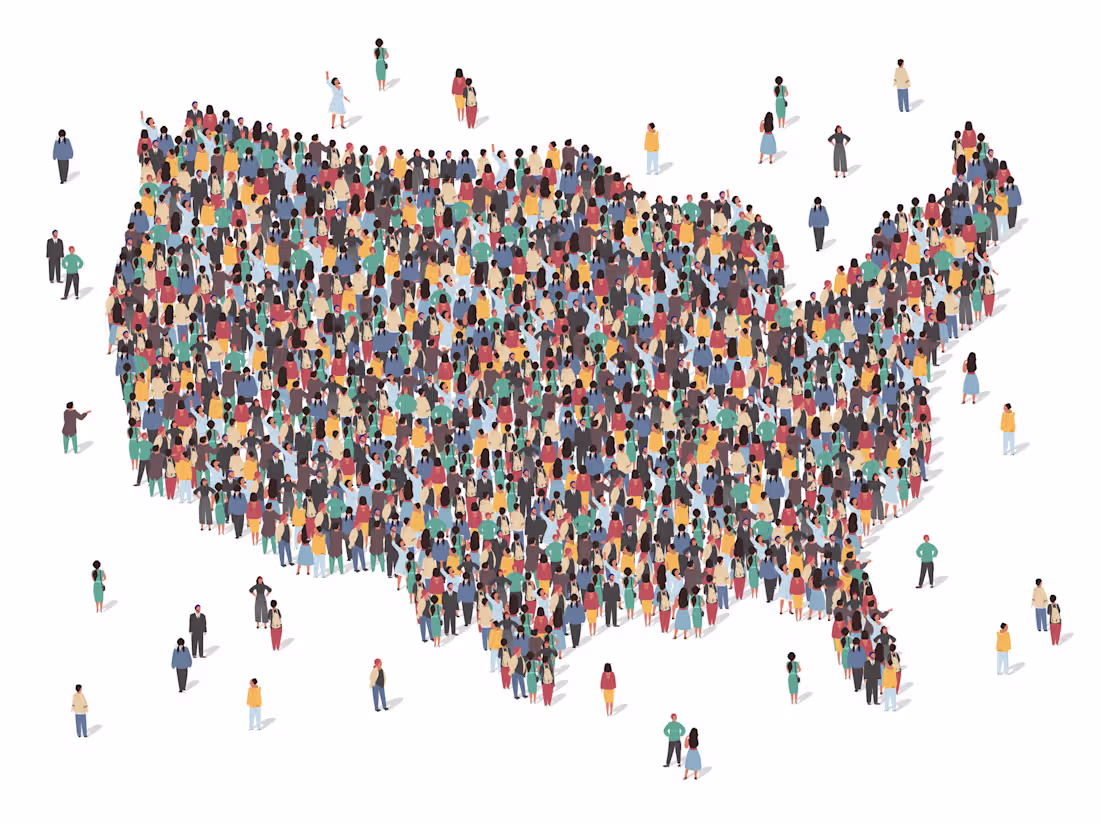
US Census Demographic Data

A visual analysis of US Population using US Census Data from 2015. The dashboard summarizes a ton of information just with few clicks.

Data Analyst
Data Visualizer
Microsoft Excel
Tableau

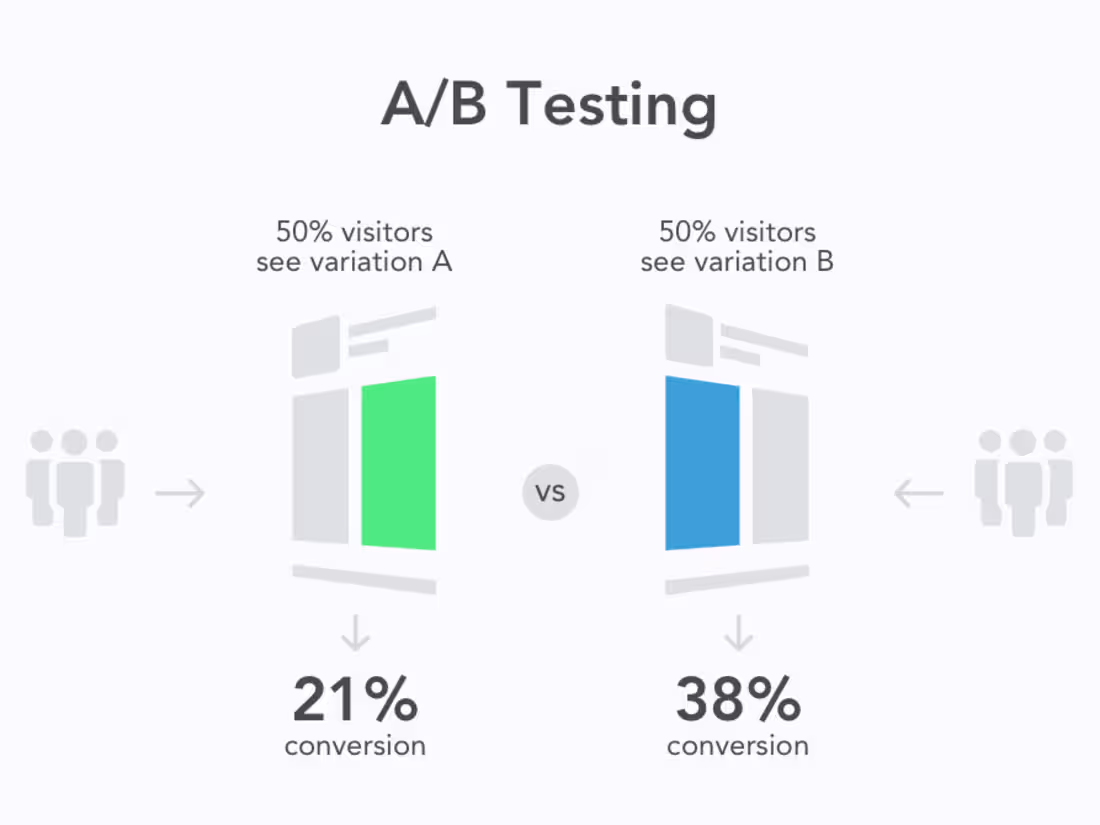
Analyzing AB Test Results

Using Python and Jupyter Notebook to do extensive analytics to assist the client in deciding whether to launch their new webpage or stick with the old one.

Data Analyst
Data Engineer
Data Visualizer
Jupyter
pandas
Python

Radar Chart
Radar Chart

A Dashboard that contains a very complex and challenging visual of a radar chart that can be applied to so many different metrics.

Data Analyst
Data Visualizer
Microsoft Excel
Tableau

Youtube Campaign Performance

Visualizing results of a youtube campaign using Tableau to create a dashboard of all KPIs of concern.

Data Analyst
Data Visualizer
Microsoft Excel
Tableau

Questionnaire Results Analysis

creating some helpful charts and visualizations by analyzing survey findings, which would then be added to Power Point to create a presentation.

Data Analyst
Data Visualizer
Google Slides
Microsoft Excel
Microsoft PowerPoint

Query a Digital Music Store Database

Querying a music store database to get some insights from it and take the output into a CSV file to visualize it and get meaningful results from the database.

Data Analyst
Data Engineer
Data Visualizer
Microsoft Excel
PostgreSQL