Azure End-to-End Data Pipeline Design
Ronald Muguna
Azure End-to-End Data Pipeline Design
Overview
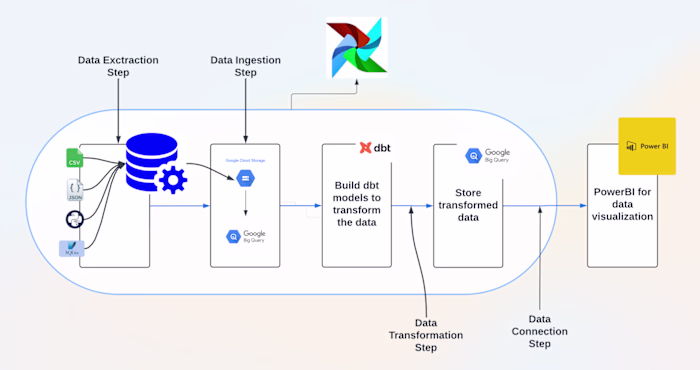
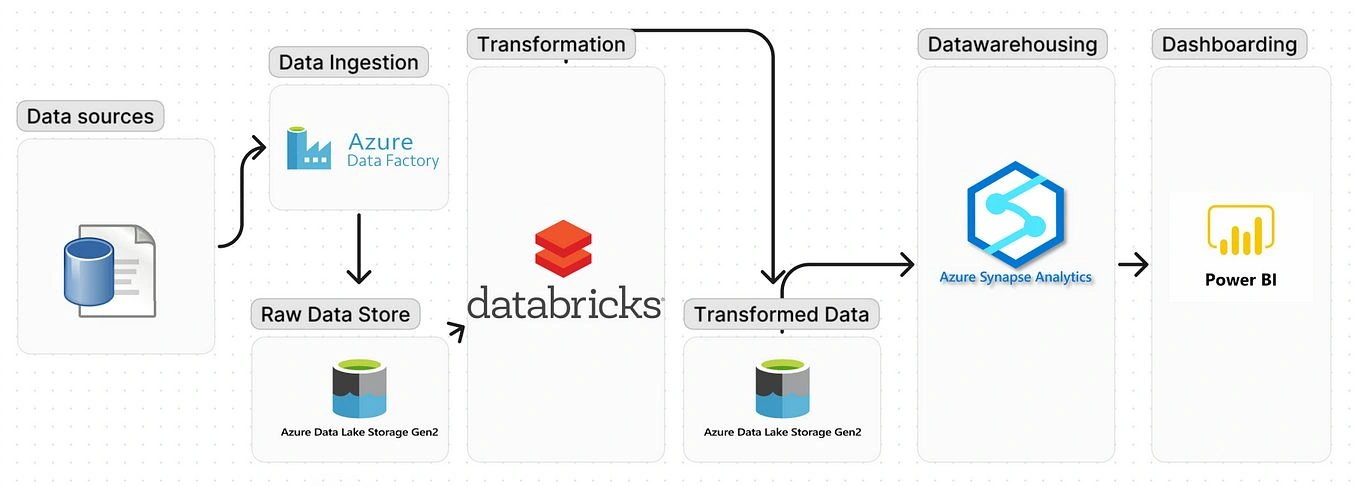
This project demonstrates the design and implementation of an end-to-end data pipeline using Azure services. The pipeline ingests, stores, processes, and visualizes data from an on-premise SQL Server to provide actionable insights through Power BI dashboards.
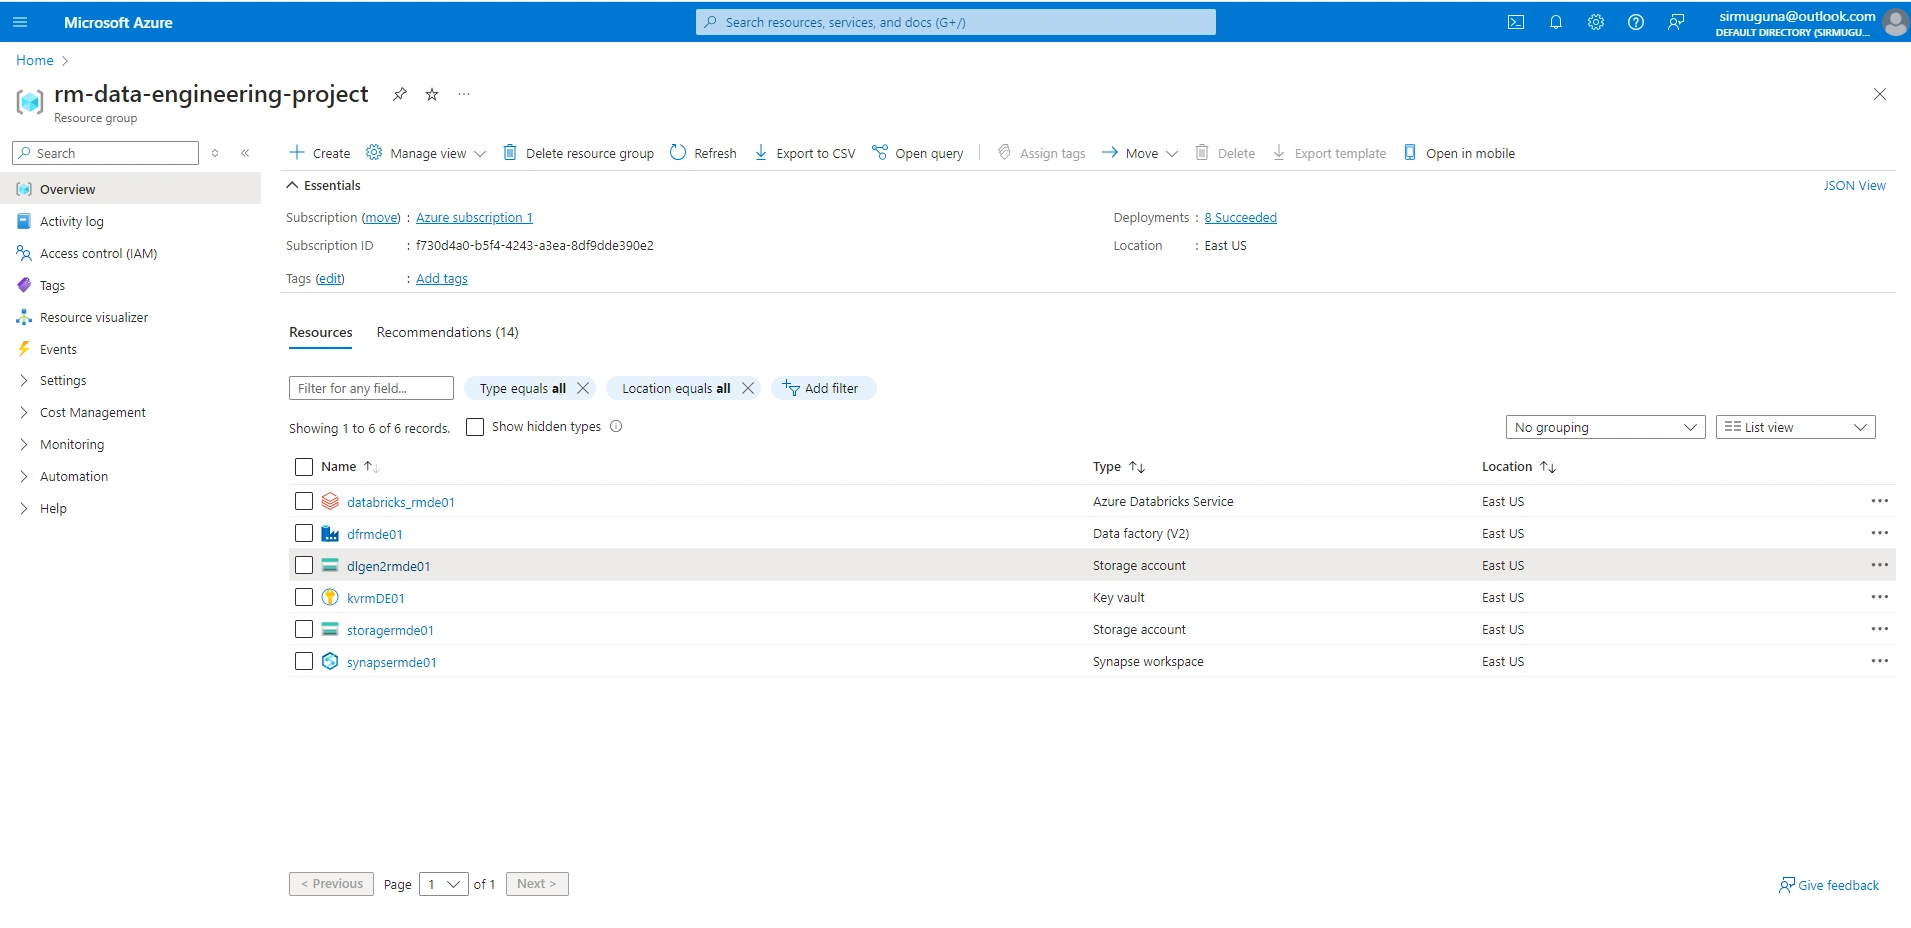
Create a Resource Group
Check the requirements.txt file for detailed step by step guide.
Data Download
Objective: Download and restore the AdventureWorksLT2022 sample database to a local on-premises SQL Server.
Steps:
Download the database backup from AdventureWorksLT2022.bak.
Restore the
.bak file to your local SQL Server instance.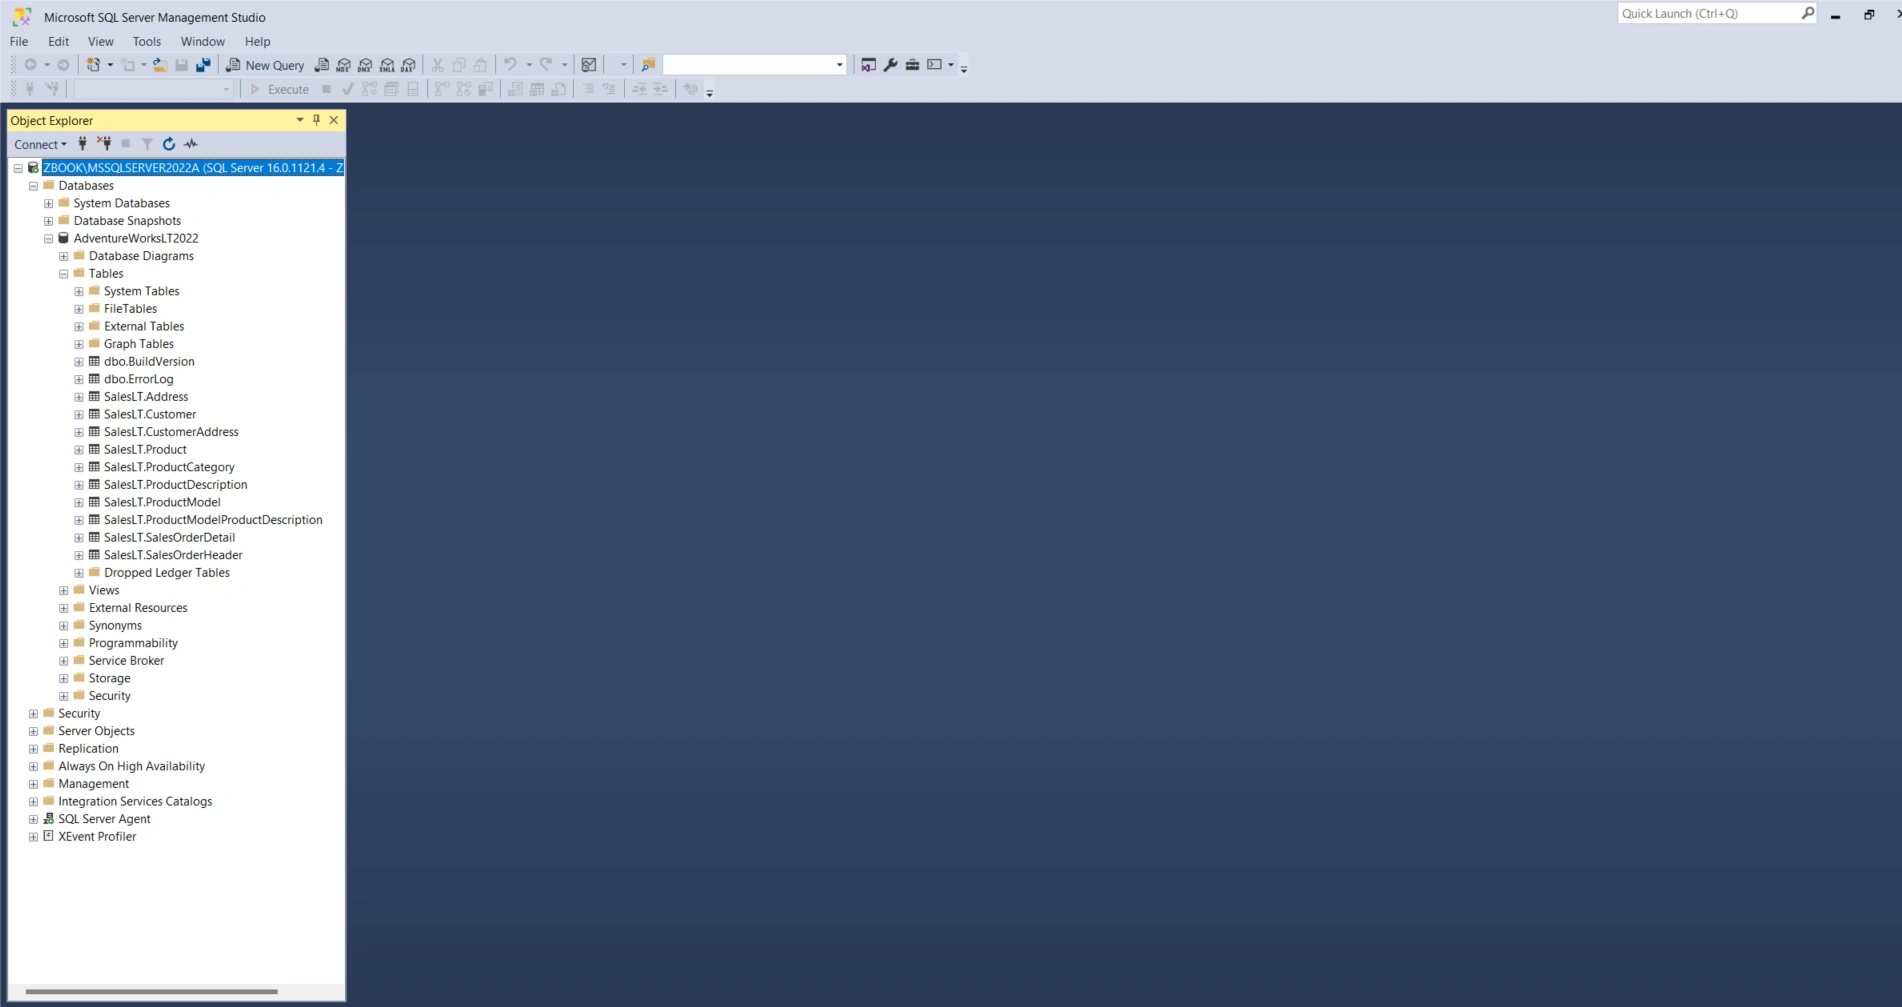
1. Data Ingestion
Tool: Azure Data Factory (ADF)
Tool: Azure Data Lake Storage (ADLS)
Objective: Store the raw data in a centralized, scalable data lake for long-term storage.
Steps:
Create a Data Lake Storage Gen2 account.
Organize the data in the data lake under containers named
bronze, silver, and gold.Store the raw CSV files extracted from SQL Server in the
bronze container.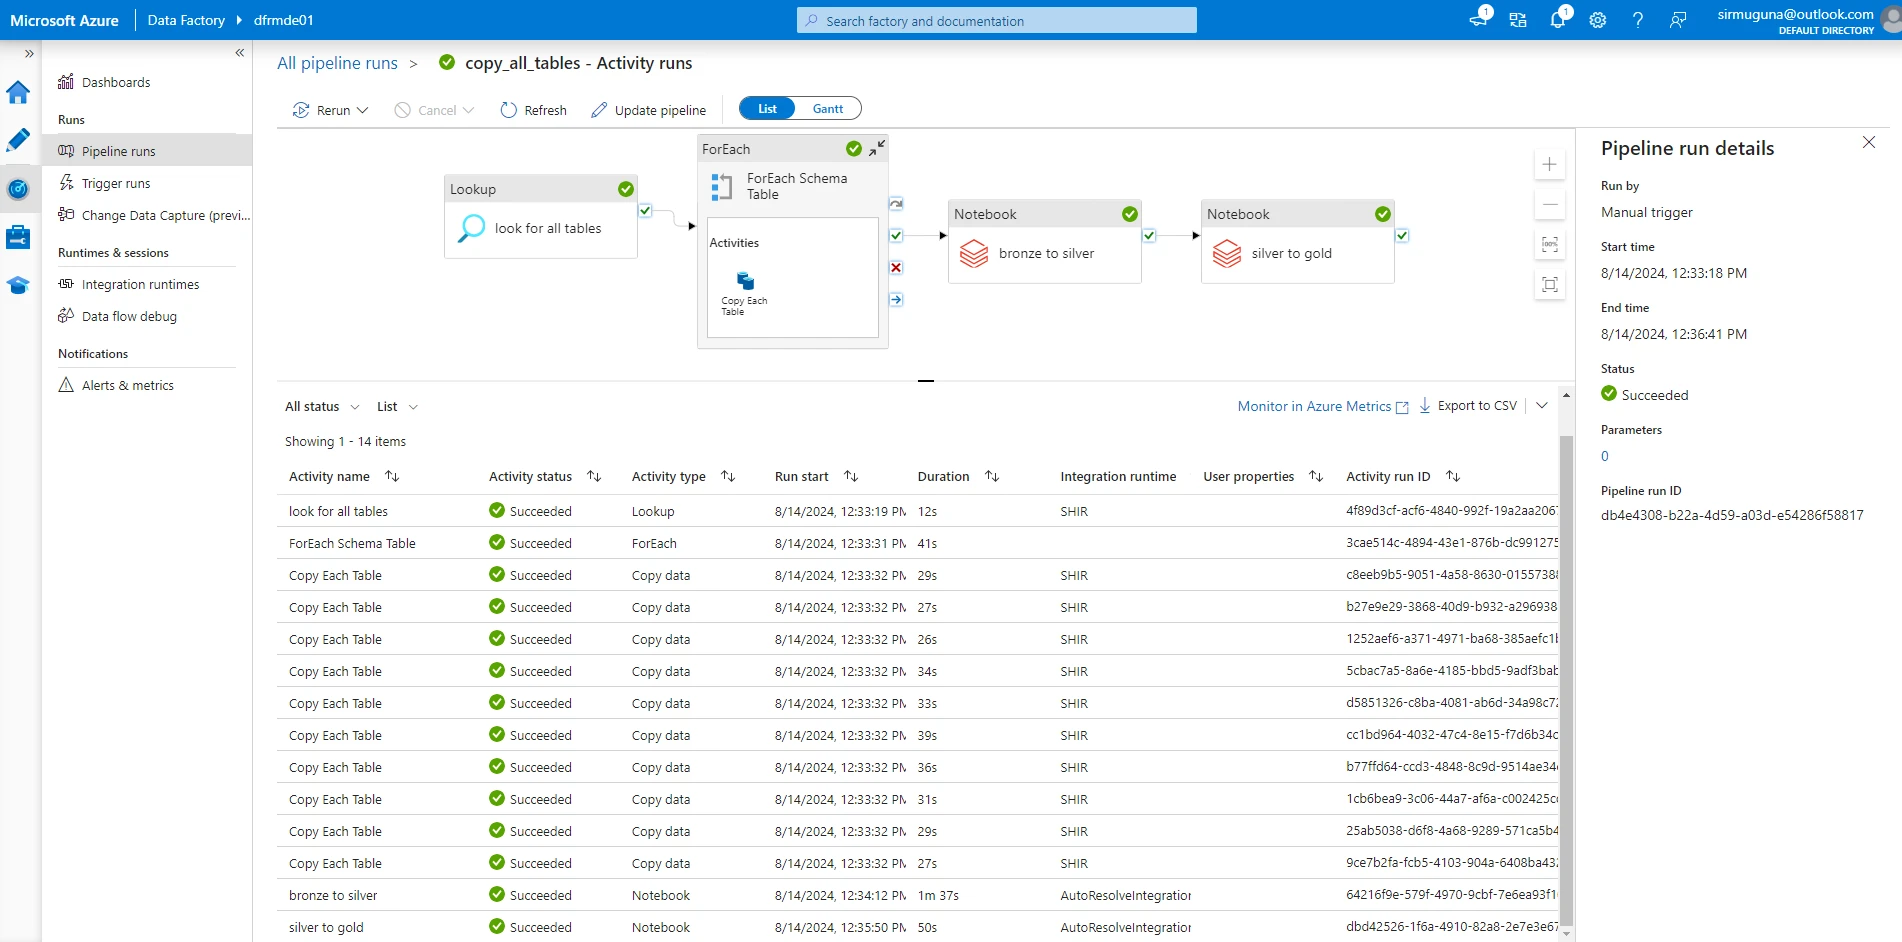
2. Data Storage (Raw Data)
Tool: Azure Data Lake Storage (ADLS)
Tool: Azure Data Lake Storage (ADLS)
Objective: Store the raw data in a centralized, scalable data lake for long-term storage.
Steps:
Create a Data Lake Storage Gen2 account.
Organize the data in the data lake under containers named
bronze, silver, and gold.Store the raw CSV files extracted from SQL Server in the
bronze container.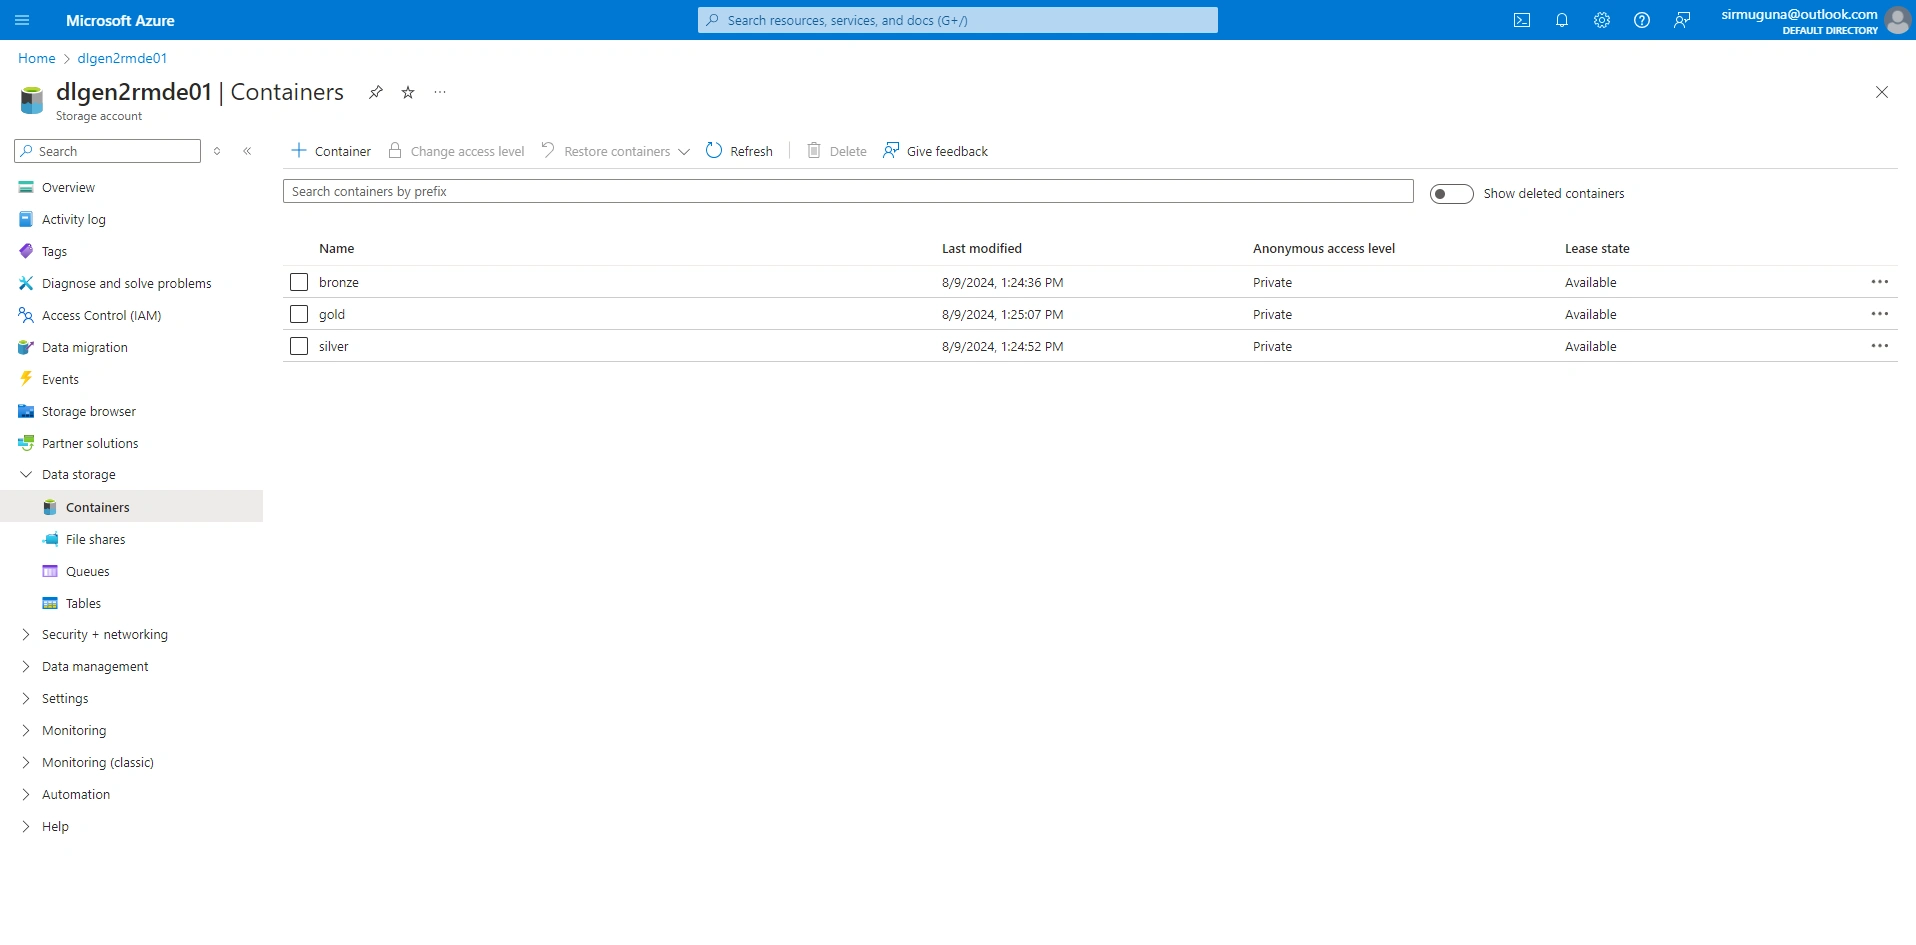
3. Data Processing
Tool: Azure Databricks
Tool: Azure Databricks
Objective: Clean, transform, and prepare the data for analysis.
Layers:
Bronze Layer: Mount raw parquet files.
Silver Layer:
First transformation: Convert all date columns to
datetime format.Store the transformed data.
Gold Layer:
Second transformation: Remove the
rowguid column, rename all columns to lowercase and snake case.Store the final processed data.
Steps:
Create Databricks notebooks for each layer.
Perform the transformations as described.
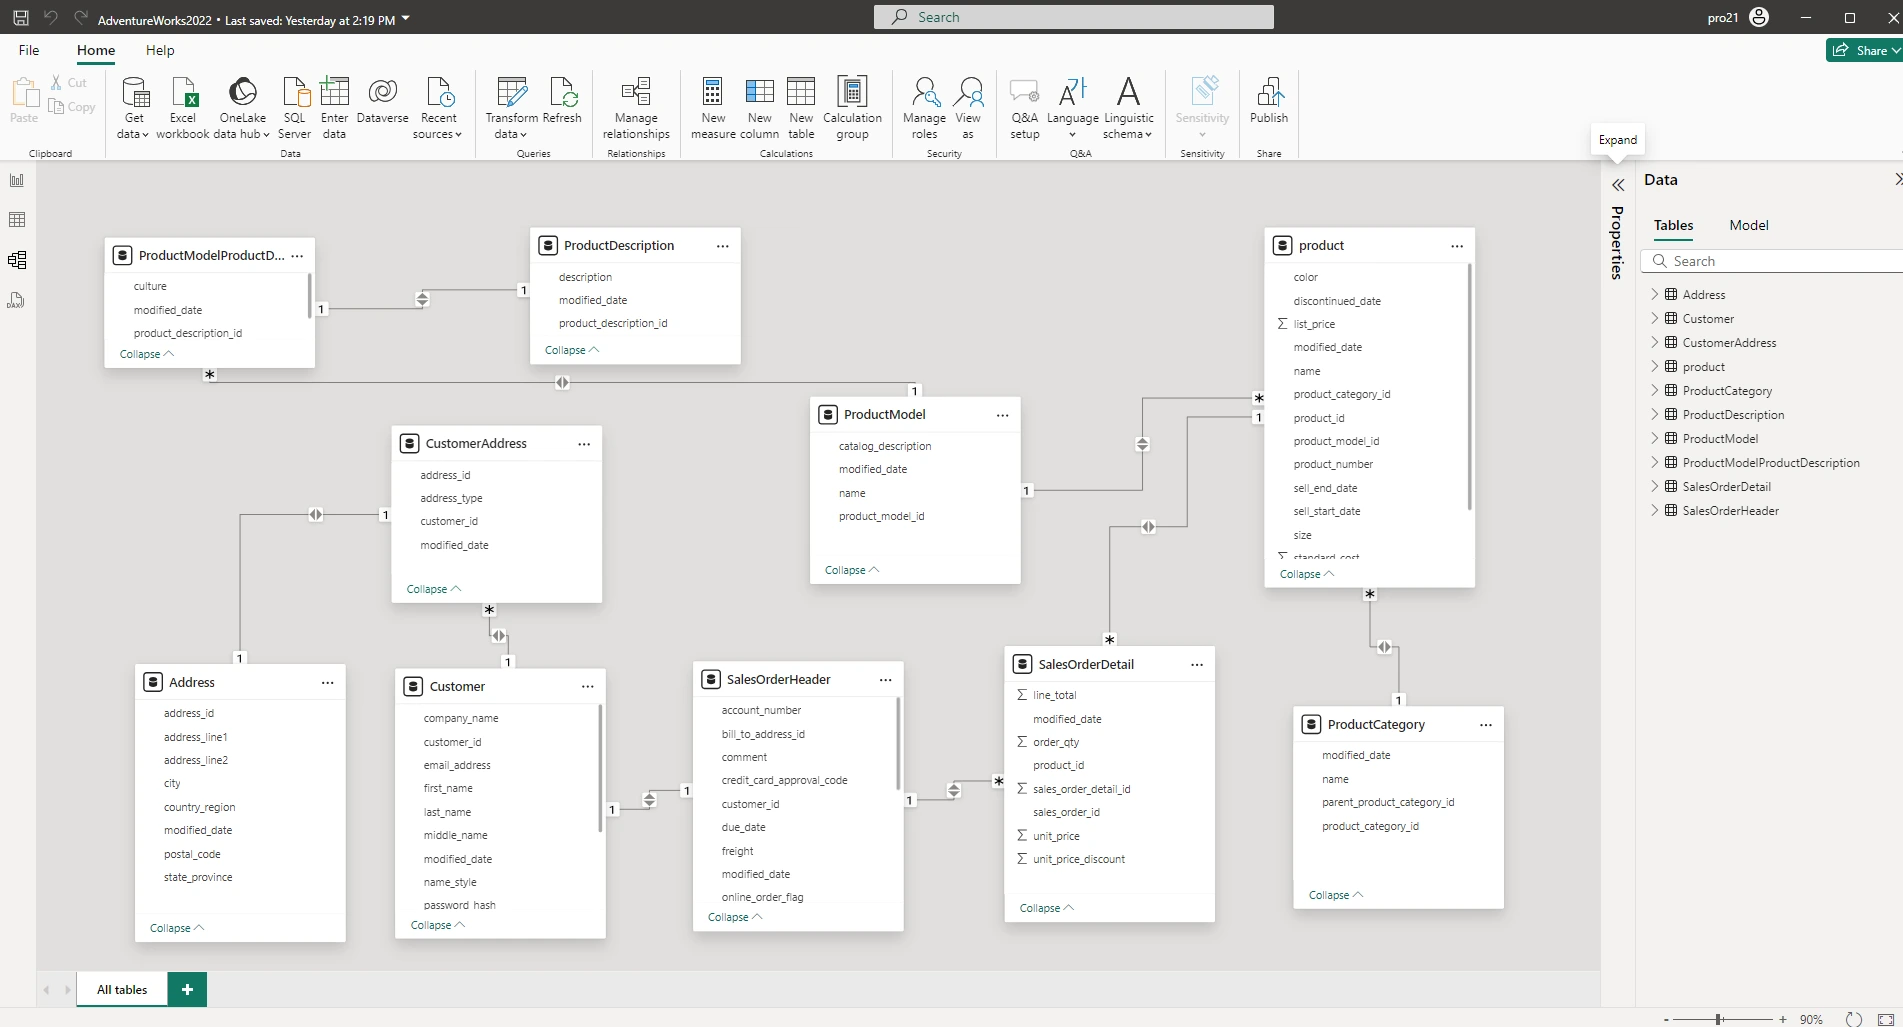
4. Data Storage (Processed Data)
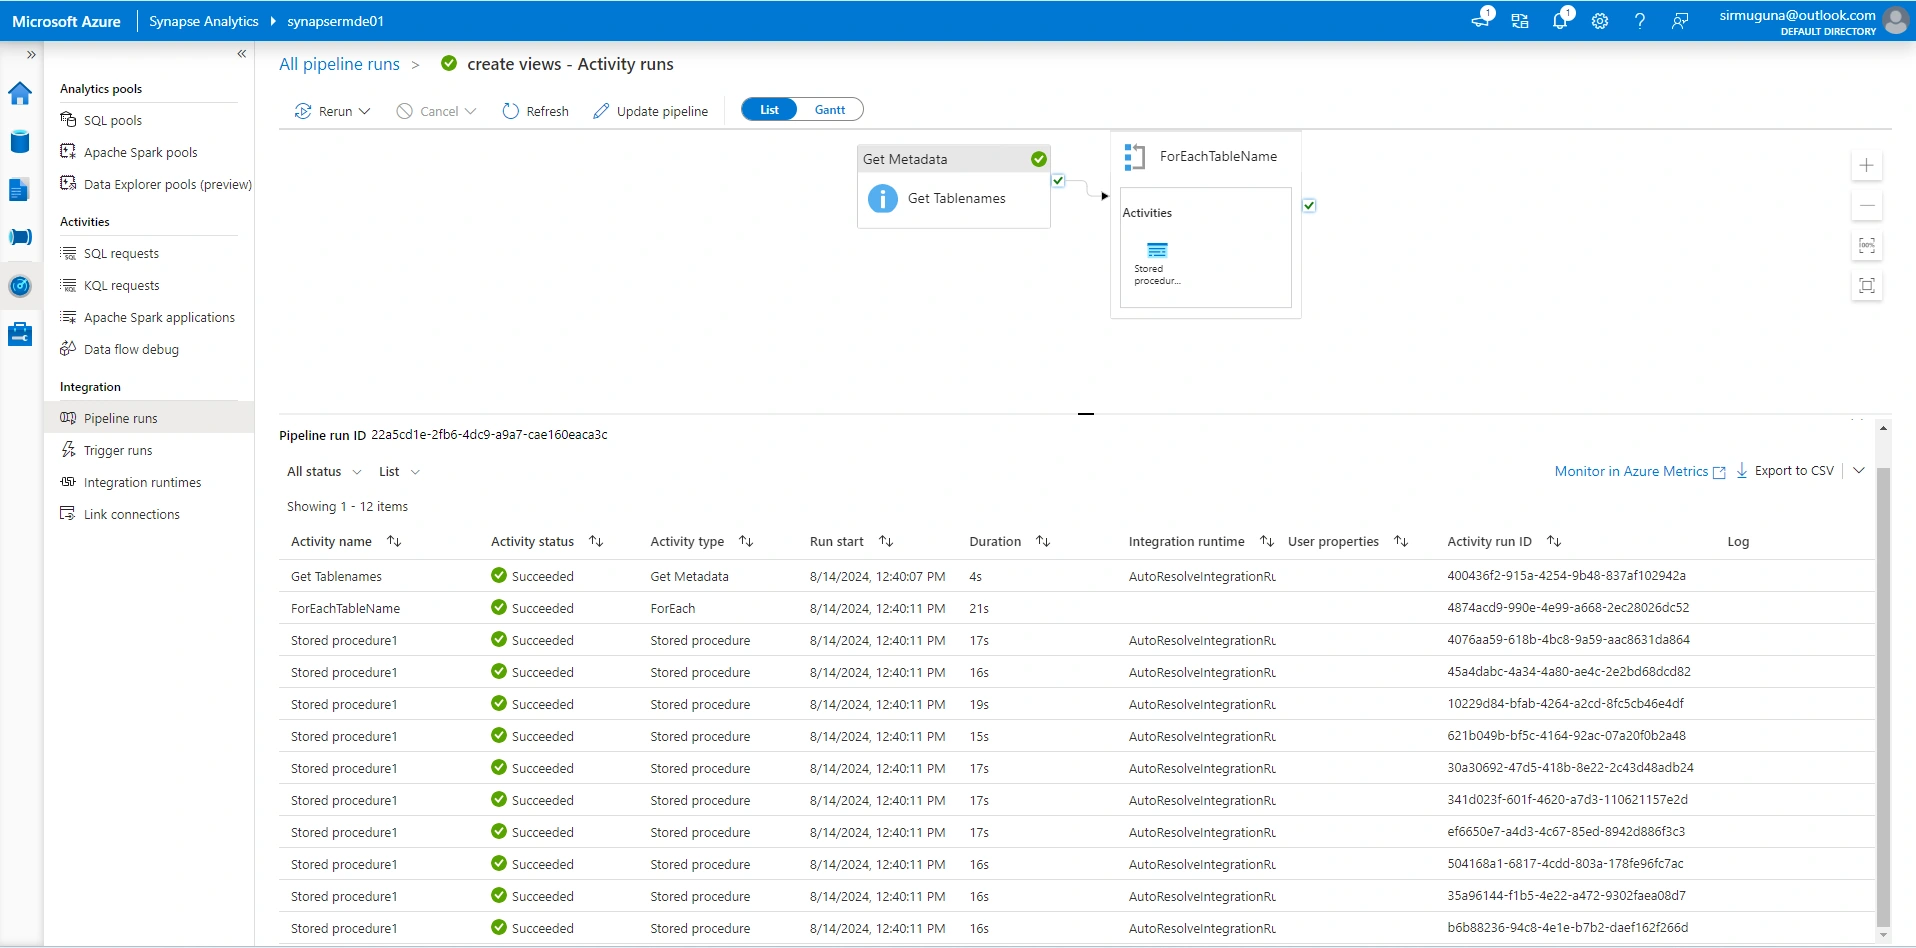
Tool: Azure Synapse Analytics
Tool: Azure Synapse Analytics
Objective: Store and manage the processed data for efficient querying and analysis.
Steps:
Load the final processed data from the
gold layer into Azure Synapse Analytics.Create Synapse views for the cleaned and aggregated data.
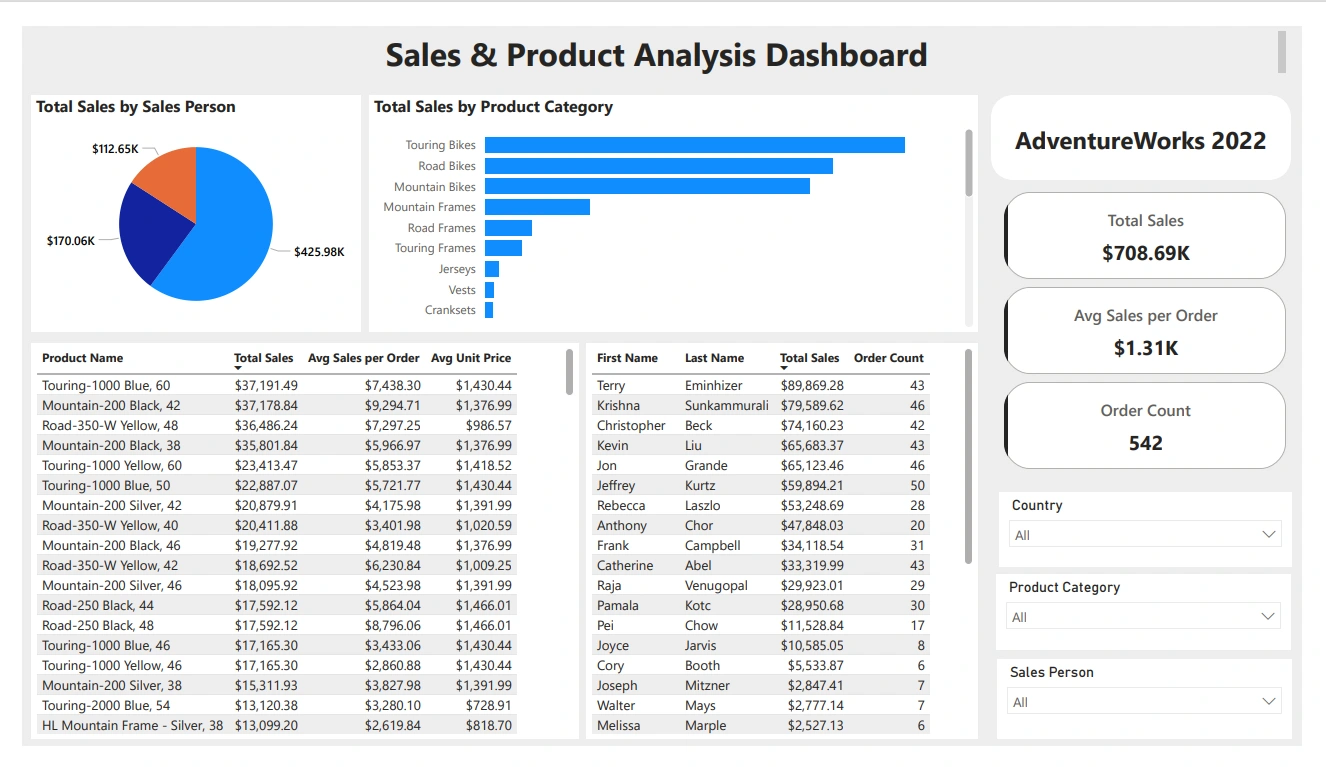
5. Data Visualization
Check the AdventureWorks2022.pbix file
Tool: Power BI
Tool: Power BI
Objective: Create interactive dashboards and reports for data analysis.
Steps:
Connect Power BI to Azure Synapse Analytics.
Build dashboards to visualize daily, weekly, and monthly sales trends.
Automate the data refresh process in Power BI after ADF triggers the Databricks jobs and loads data into Synapse.
Like this project
Posted Jan 23, 2025
Contribute to Sir-Muguna/azure-end-to-end-data-pipeline development by creating an account on GitHub.