Sir-Muguna/end-to-end-airflow-data-pipeline

Uber Data Pipeline and Analysis
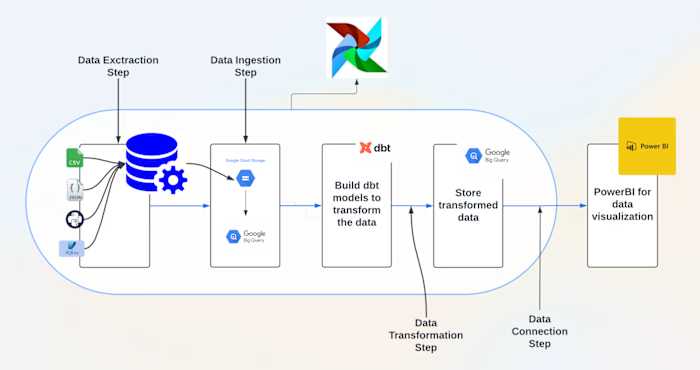
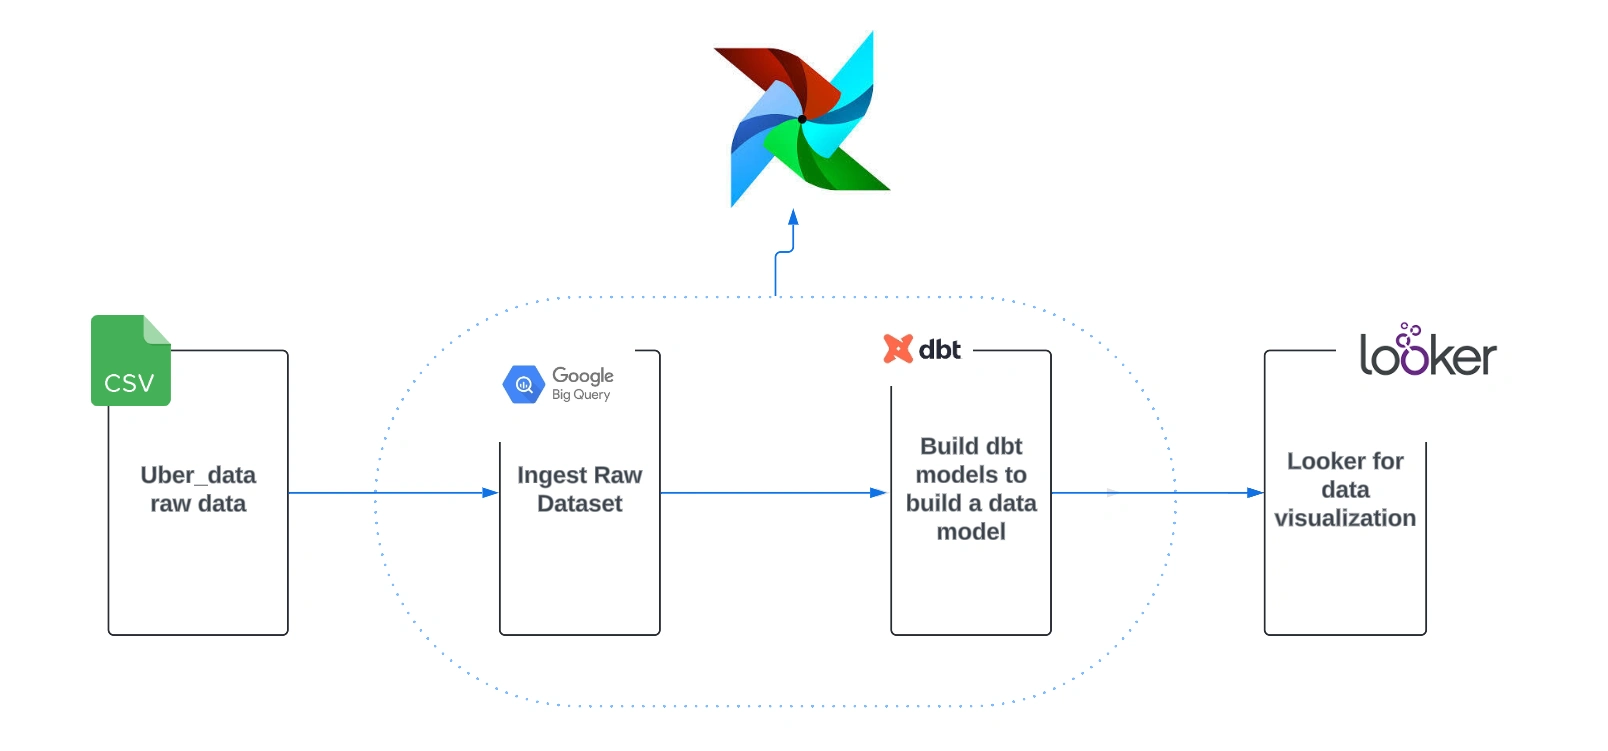
This repository contains an end-to-end data pipeline for processing and analyzing Uber trip data. The pipeline ingests raw data, transforms it using Apache Airflow, and loads it into BigQuery for further analysis. The project also includes data modeling with dbt and an interactive dashboard for data visualization.
Dataset
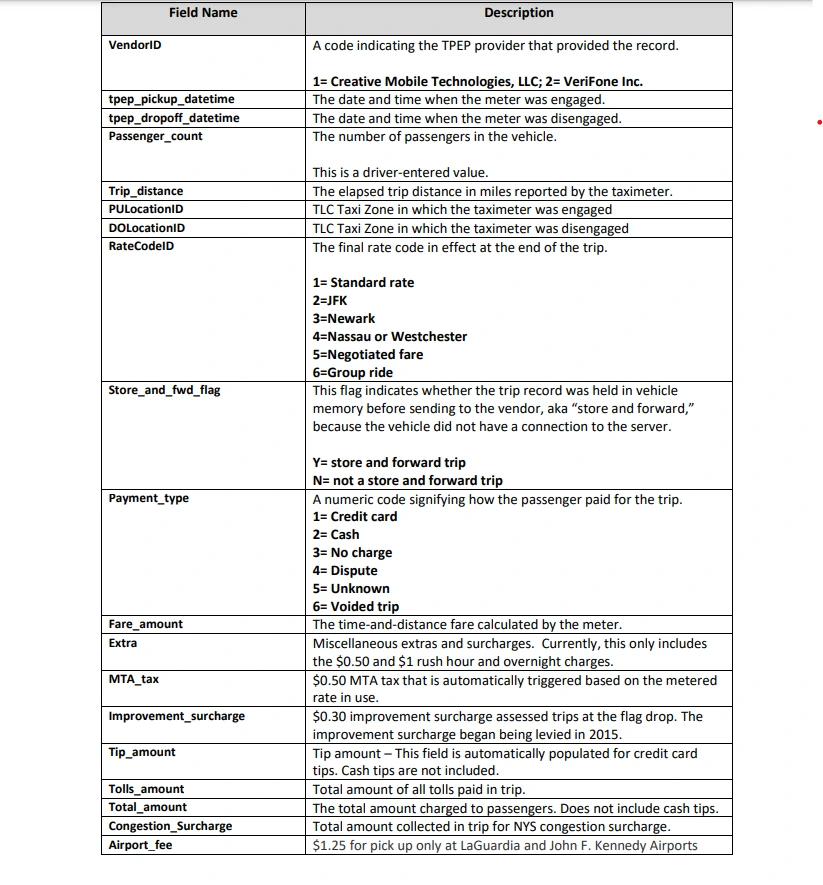
The dataset used in this project describes yellow taxi trip data in New York City. You can download the dataset from the following link:
For additional data dictionaries or a map of the TLC Taxi Zones, please visit the NYC TLC website.
Data Modeling
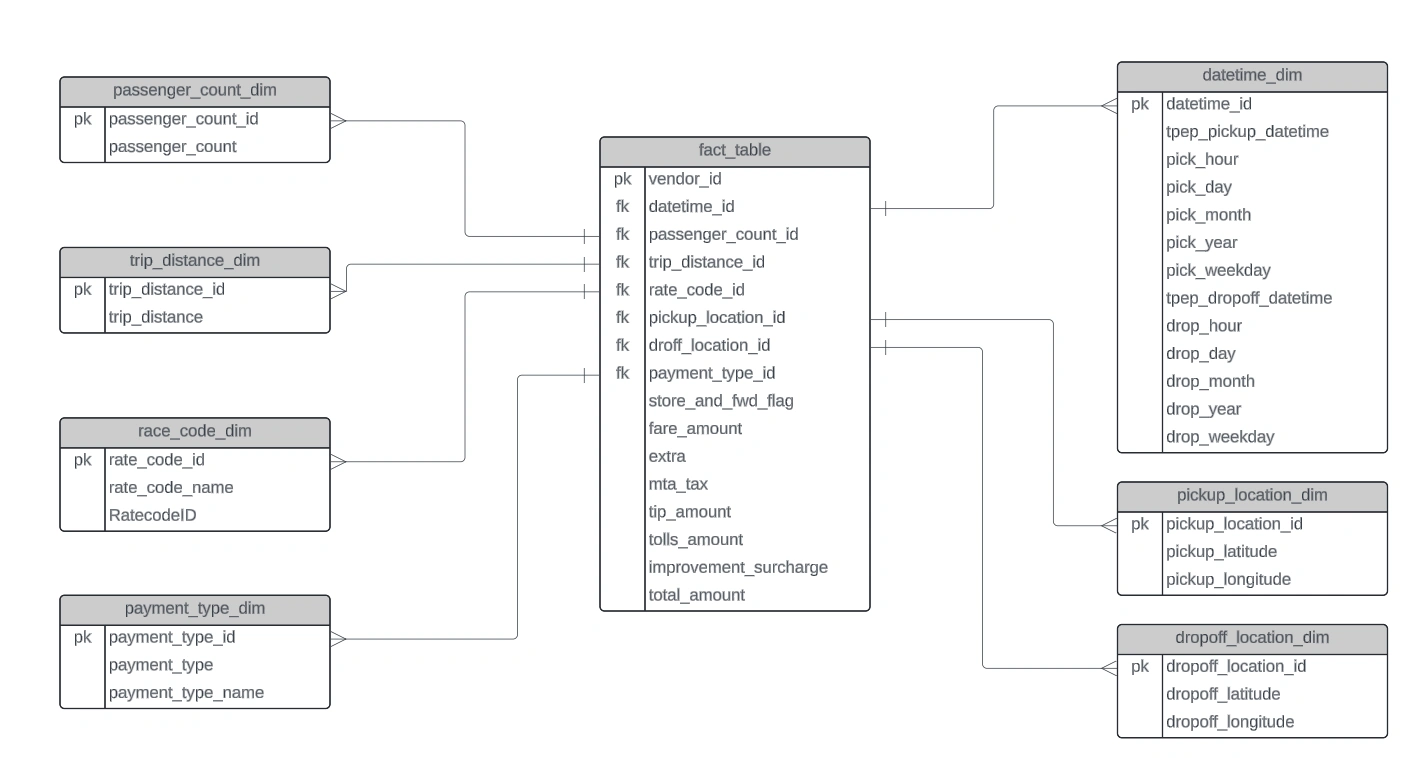
The data model for the project includes various fact and dimension tables created using dbt:
Prerequisites
To run this project, ensure you have the following installed:
Docker
Astro CLI
Google Cloud (GC) account
Setup Steps
Docker Configuration
Update Dockerfile: Ensure your Dockerfile uses the following base image:
Restart Airflow using
astro dev restart.Dataset Preparation
Download the dataset:
Store the CSV file in
include/dataset/uber_data.csv.Update requirements.txt:
Add
apache-airflow-providers-google.Restart Airflow.
Google Cloud Setup
Create a GCS bucket:
Name:
<your_name>.Create a service account:
Name:
<your_name>.Grant admin access to GCS and BigQuery.
Generate and save the service account key as
include/gcp/service_account.json.Set up Airflow connection:
Airflow → Admin → Connections.
ID:
gcp.Type:
Google Cloud.Keypath:
/usr/local/airflow/include/gcp/service_account.json.Test the connection.
Airflow DAG Creation
Create the DAG:
Test the task:
Create an empty Dataset:
Test the connection:
Load file into BigQuery:
Test the task:
🏆 Data loaded into the warehouse!
Build SQL dbt Models
Run dbt models:
Add the SQL dbt models.
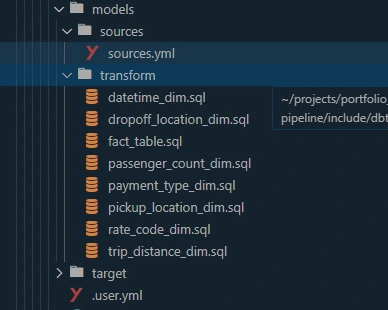
Verify that the tables exist with data in BigQuery.
Add dbt task:
Create DBT_CONFIG:
Test dbt task:
Run the pipeline:
Check the Airflow UI to verify the TaskGroup transform with the models.
Trigger the DAG to run the pipeline and create dbt model tables in BigQuery.
Dashboard
A simple interactive dashboard will be created on Looker for data analysis.
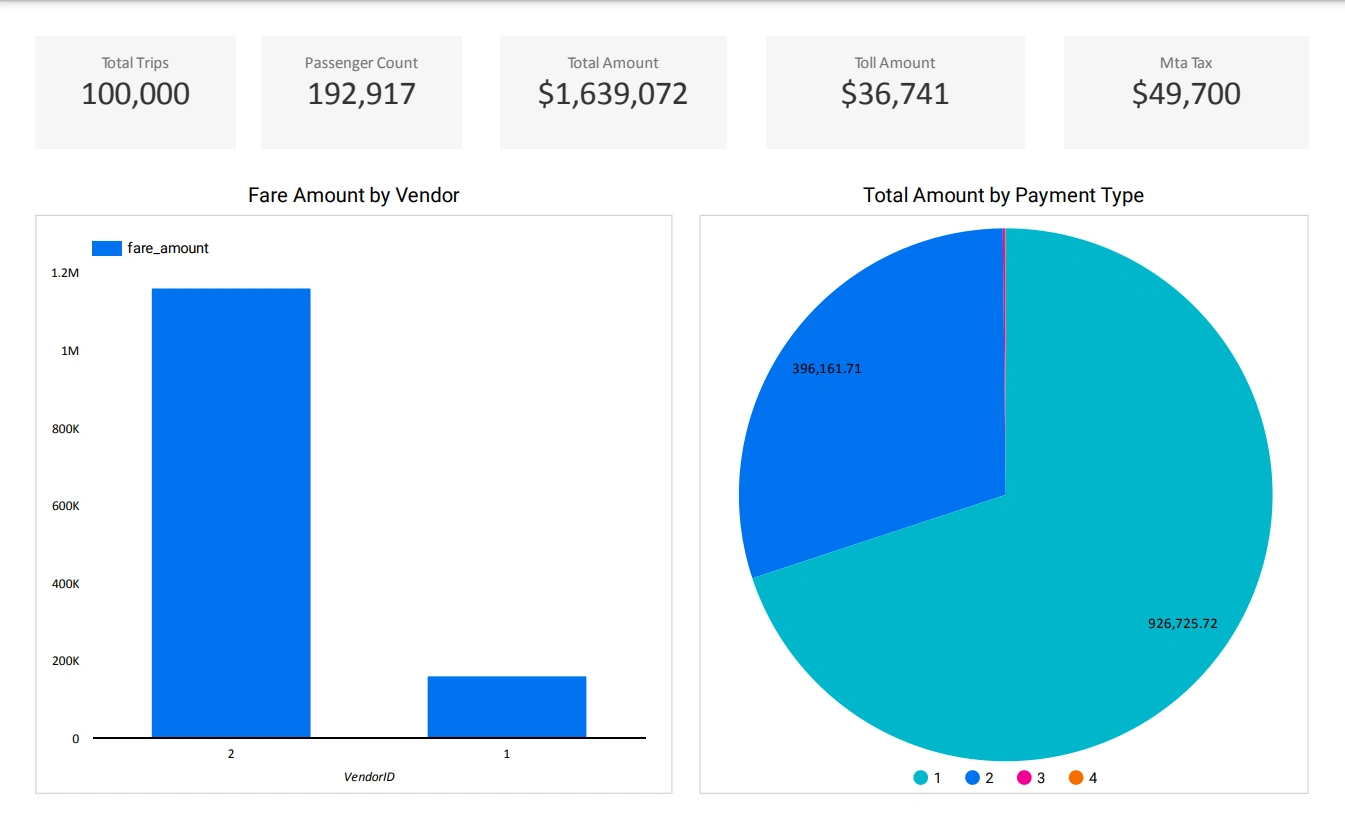
0 likes · 13 views · Jan 23, 2025
Contribute to Sir-Muguna/end-to-end-airflow-data-pipeline development by creating an account on GitHub.