Sales & Profit Dashboard in Tableau
Amy Frank
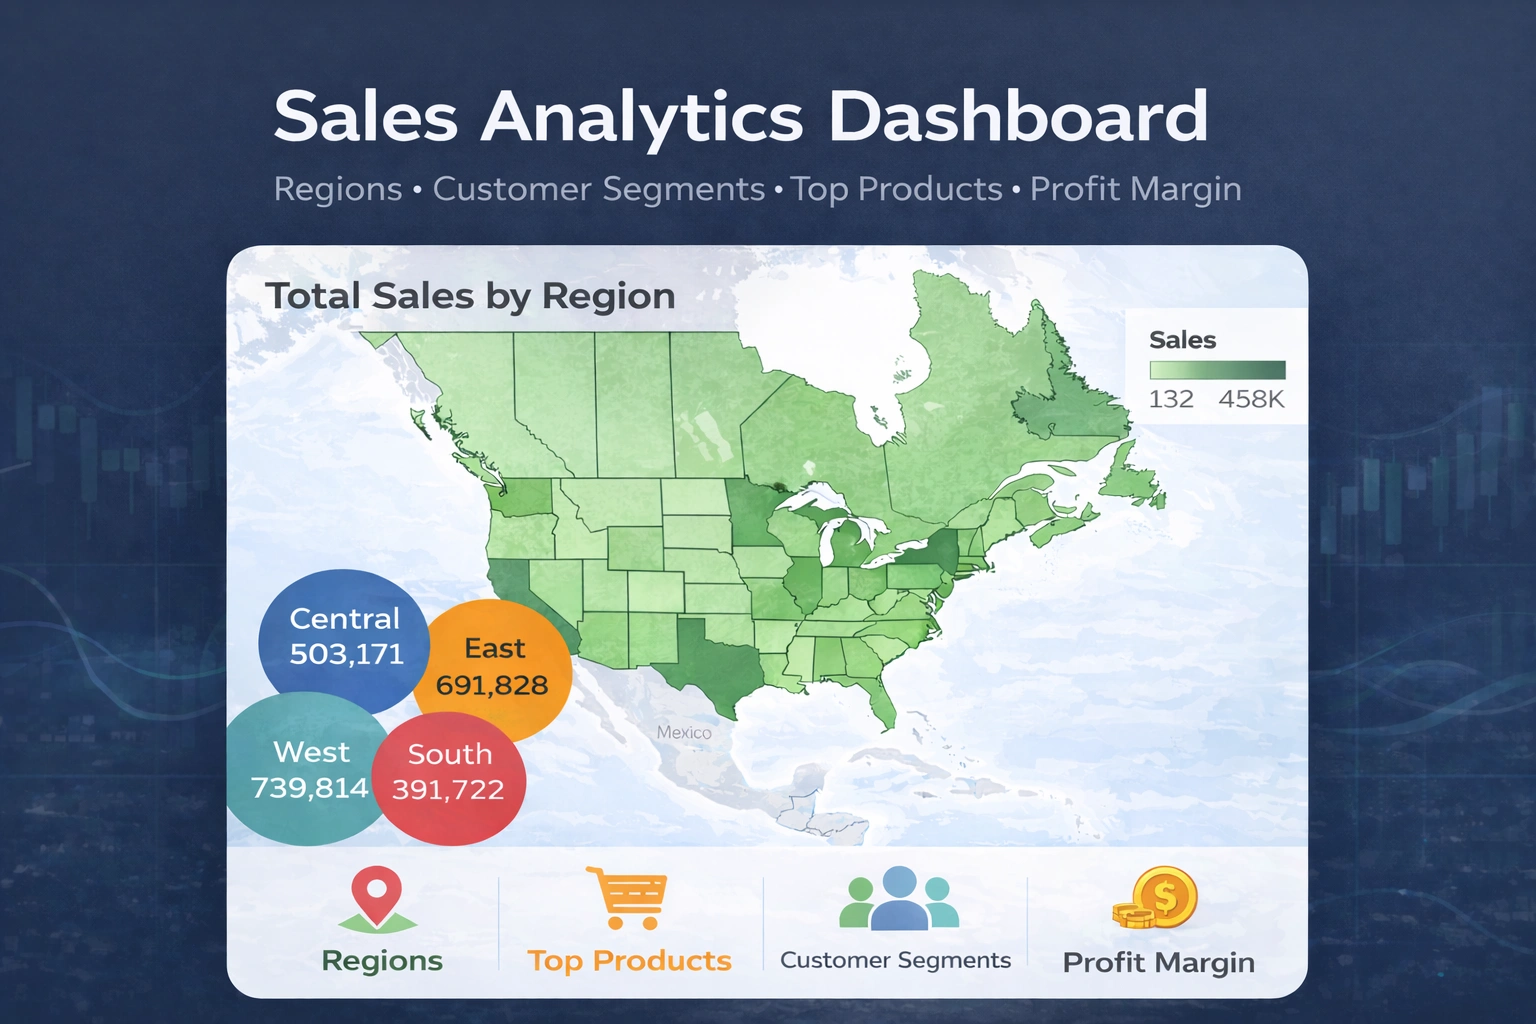
Sales Analytics Dashboard: Regions, Segments, Products & Profit
Overview
This dashboard was designed to help teams move beyond surface-level revenue tracking and understand where profitability is actually coming from and where it’s being lost.
Instead of just reporting sales, it connects revenue, profit, margin, customer segments, and geography into one clear view so decision-makers can quickly identify performance gaps and opportunities.
Who This Is For
Small to mid-sized businesses, operators, or consultants who:
Track sales but lack visibility into profitability drivers
Need to understand which segments or regions are truly performing
Want a clear, visual way to support pricing, marketing, or expansion decisions
What This Dashboard Enables
Identify high-revenue but low-margin areas
Compare performance across regions, states, and customer segments
Track sales vs. profit trends over time
Spot margin leakage and volatility
Understand seasonal patterns and demand cycles
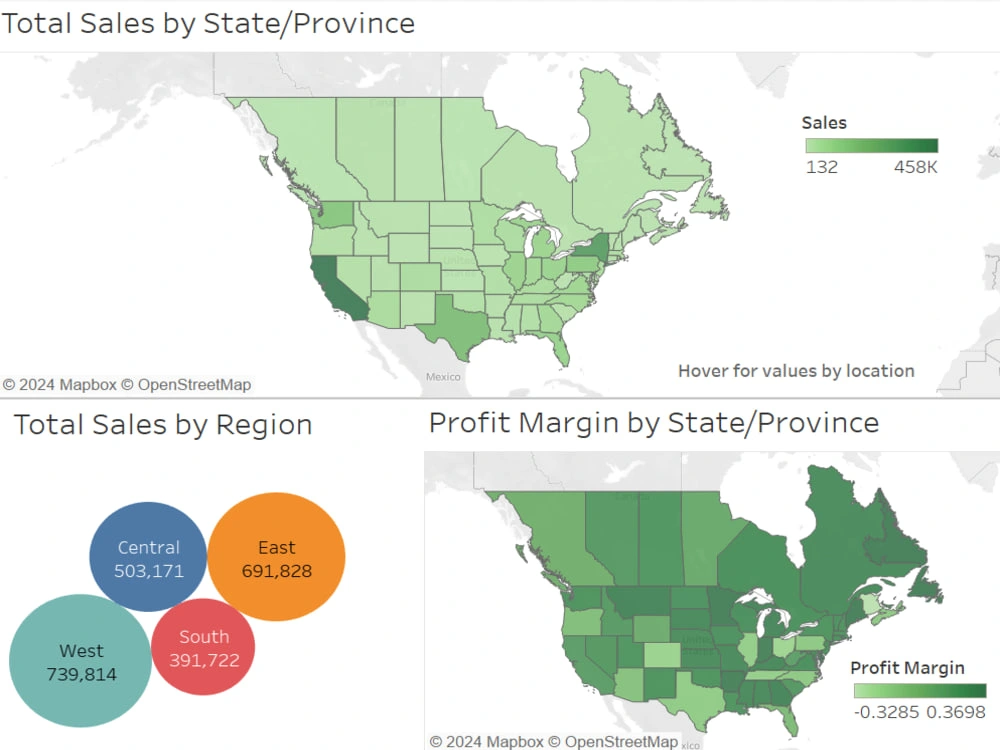
Sales and profit performance across regions and states, highlighting revenue concentration vs. margin strength.
Key Insights
Revenue growth did not consistently translate to profit
Sales trended upward, but profit fluctuated significantly, indicating potential issues with pricing, cost control, or discounting.
High-performing regions were not always high-margin
Some states generated strong revenue while underperforming in profit margin, highlighting inefficiencies or cost imbalances.
Customer segments behaved very differently
Corporate and Home Office segments maintained more stable margins, while Consumer showed multiple dips below zero, suggesting higher cost-to-serve or aggressive discounting.
Seasonality impacts both revenue and profitability
Clear spikes across specific months indicate predictable demand cycles that could inform inventory, staffing, or campaign timing.
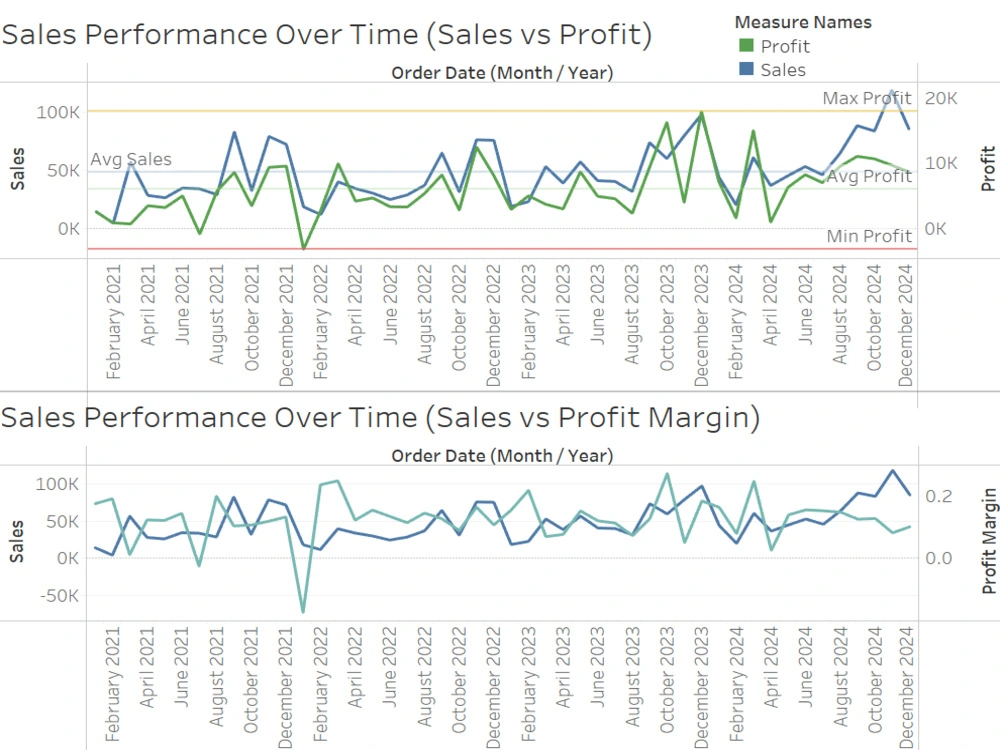
Sales vs. profit over time, revealing volatility and seasonal patterns.
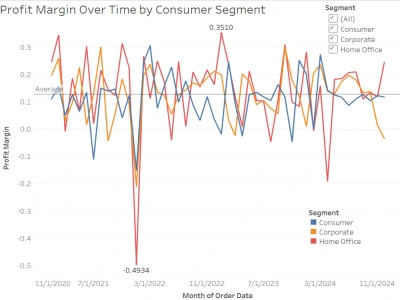
Profit margin by customer segment, showing differences in profitability across groups.
My Approach
Cleaned and structured raw data to ensure consistency across sources
Built calculated fields for profit and margin analysis
Designed an interactive Tableau dashboard focused on decision-making, not just reporting
Used Python to explore trends and validate findings
Added benchmarks and annotations to highlight what matters vs. what’s noise
Tools Used
Tableau, Python, Excel
How This Could Be Applied
This type of dashboard can be adapted for:
E-commerce businesses tracking product-level profitability
Service businesses analyzing client or segment performance
Multi-location businesses comparing regional efficiency
Like this project
Posted Jan 4, 2026
Sales dashboard revealing revenue, profit, and margin drivers across regions, segments, and products to support smarter decisions.