Yoga Studio Capacity & Demand Snapshot
Amy Frank
Yoga Studio Operations & Demand Snapshot
Six-Month Systems Review
Prepared by: Amy Frank
Overview
This project analyzes six months of yoga studio attendance and scheduling data to evaluate how effectively the studio is using its class capacity. The goal of the review is to understand where demand is strongest, where capacity is being wasted, and how class formats and instructor schedules are influencing overall performance.
The output gives studio leadership clear, data-driven visibility into where demand is being constrained, where capacity is being wasted, and what operational levers matter most.
What Was Analyzed
The snapshot is based on six months of studio activity, covering:
181 total classes
2,408 total student visits
All class formats
All instructors
All time-of-day windows
The analysis focuses on three core dimensions:
Demand by class type
Demand by time of day
Instructor utilization
Overall Studio Performance
Studio-wide demand and fill-rate overview across class formats and instructors.
Across all classes, the studio averaged 63.4% seat utilization.
This means that roughly one-third of available class capacity went unused over the six-month period.
This does not suggest low interest in the studio. It indicates that demand is unevenly distributed across the schedule.
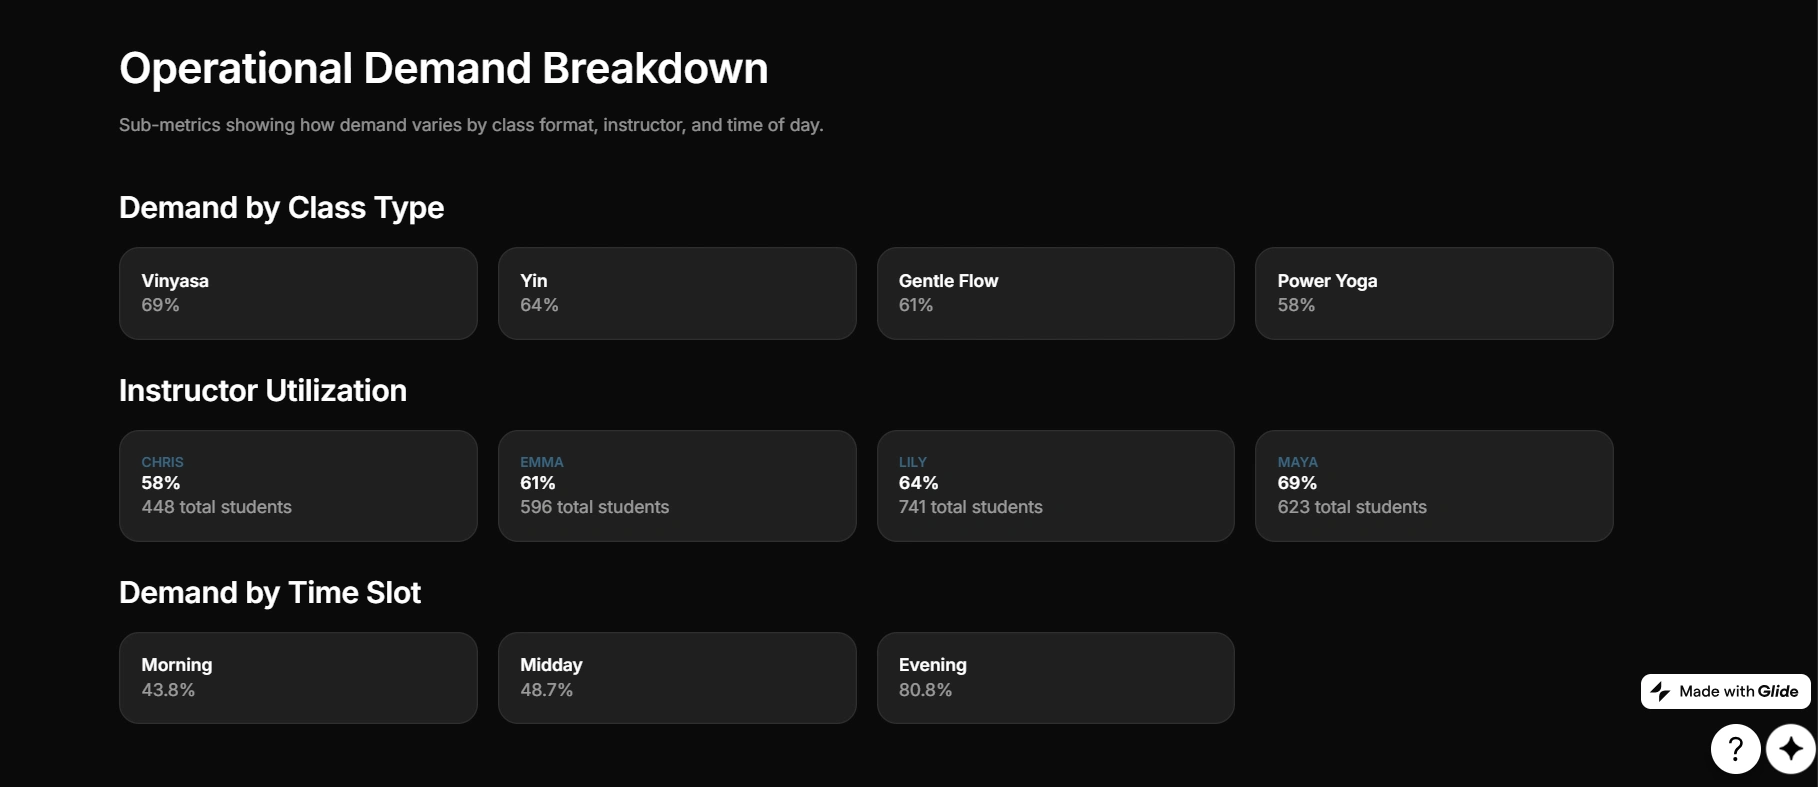
Demand by Time of Day
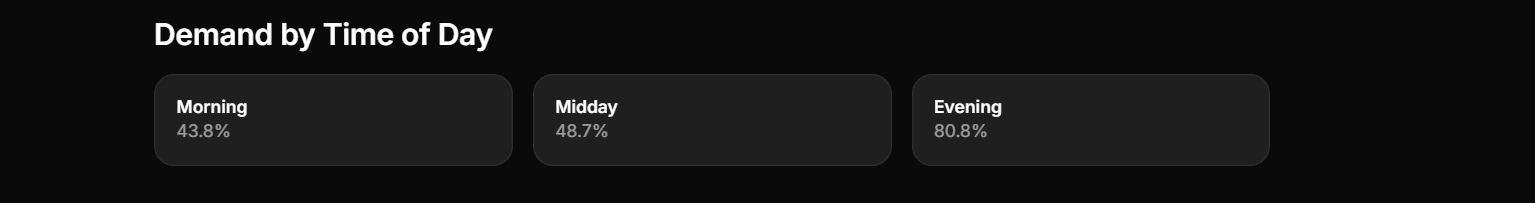
Average fill rate by time of day showing strong evening demand and undertilized morning and midday slots.
Average fill rate by time slot:
Evening: 80.8%
Midday: 48.7%
Morning: 43.8%
Evening classes operate near capacity, while morning and midday classes consistently run less than half full. This imbalance suggests that demand is being constrained during peak hours while lower-demand time slots continue to absorb fixed operating costs.
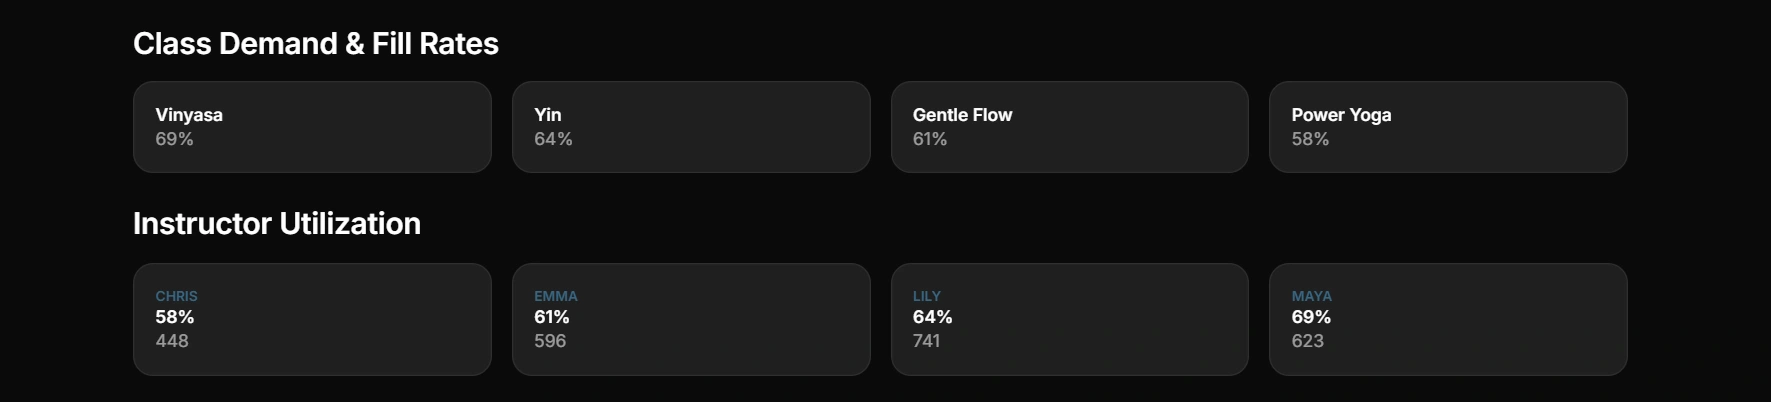
Demand by Class Type
Average fill rate by format:
Vinyasa: 69%
Yin: 64%
Gentle Flow: 61%
Power Yoga: 58%
Vinyasa and Yin demonstrate the strongest demand. Power Yoga and Gentle Flow underperform relative to the rest of the schedule. This suggests the current class mix may not be optimally aligned with student preferences.
Instructor Utilization
Instructor performance based on class fill rates and total students:
Maya: 69% fill rate, 623 students
Lily: 64% fill rate, 741 students
Emma: 61% fill rate, 596 students
Chris: 58% fill rate, 448 students
Maya and Lily consistently teach higher-demand classes, while Chris’s classes run with more empty seats. This pattern points to scheduling placement rather than instructor quality.
Key Operational Insights
The studio has strong underlying demand, but that demand is not evenly distributed across time slots, class formats, or instructors.
High-performing classes and instructors are concentrated in limited windows, while lower-demand classes occupy capacity during less optimal times. This leads to artificial sell-outs in some areas and wasted capacity in others.
Why This Matters
When demand and scheduling are misaligned, studios experience:
Missed revenue in peak windows
Underutilized instructors
Empty seats during low-demand periods
Lower revenue per class than the market supports
This snapshot makes those patterns visible so decisions can be made deliberately rather than by intuition.
What This Snapshot Provides
This deliverable provides:
Objective performance visibility
Demand and capacity patterns
Instructor and class utilization insight
A clear operational baseline
It does not include schedule changes, pricing changes, or implementation.
It is designed to support better decision-making.
Note: This project uses a representative sample dataset to demonstrate how a yoga studio’s operations and class demand can be analyzed and visualized.
Like this project
Posted Jan 17, 2026
Analyzed six months of attendance and scheduling data to surface demand and capacity mismatches and support more deliberate operational decisions.
Likes
0
Views
7