Salesforce Sales Cloud Setup for Pipeline & Deal Tracking

Amy Frank


Salesforce Performance Overview
Salesforce Sales Ops Dashboard (Case Study)
Overview
I set up a Salesforce Sales Cloud environment that gives small teams clear, reliable visibility into their sales pipeline.
The system tracks opportunities from first contact through closed won, automatically calculates revenue, and displays three core KPIs on a single sales performance dashboard.
This gives founders and sales leads immediate insight into how their pipeline is performing.
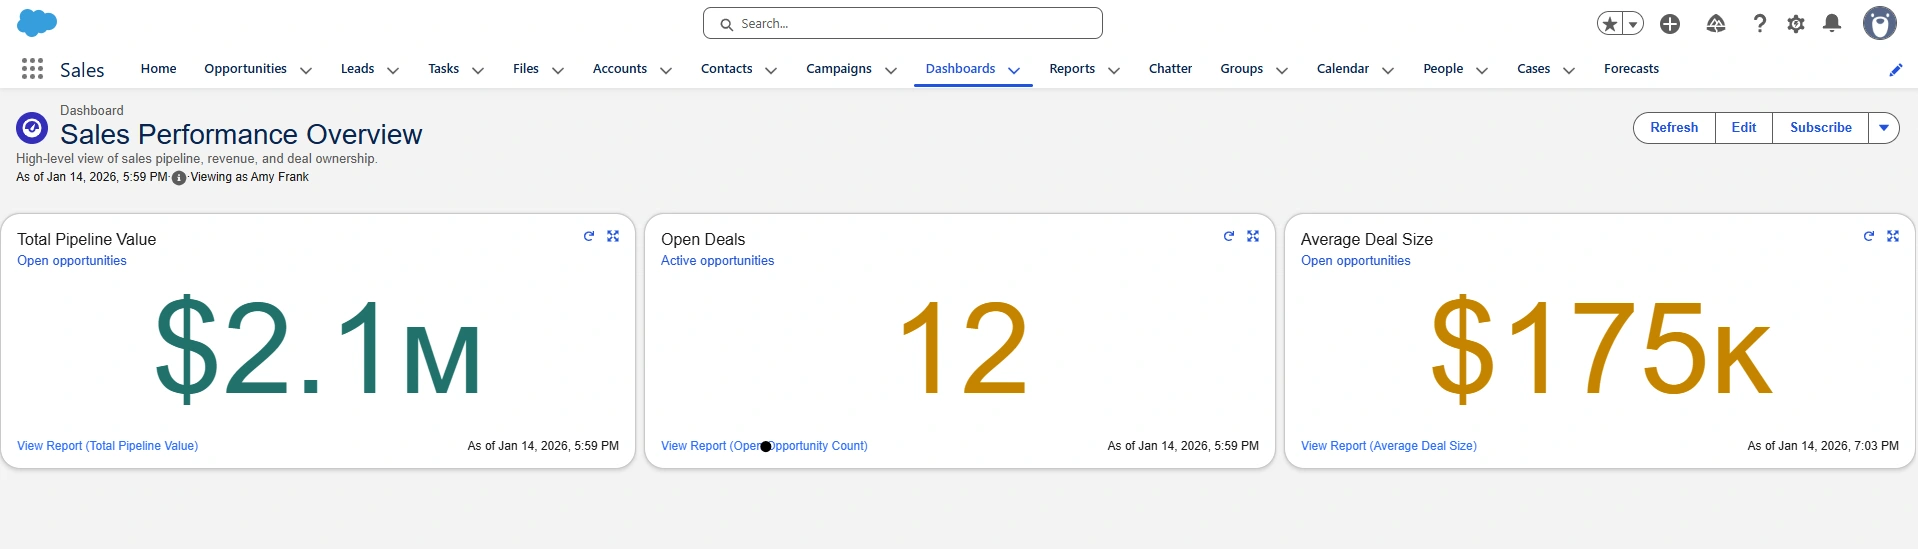
Sales Performance Overview dashboard showing live pipeline KPIs
Sales Performance Overview Dashboard
This is the executive dashboard that leadership sees when they log in.
It shows three core metrics:
Total Pipeline Value
Open Deals
Average Deal Size
These KPIs update automatically as opportunities move through the pipeline, giving a real-time view of sales health.
The Problem
Before this setup, the sales team did not have a structured way to track leads and opportunities or see how deals were progressing through the pipeline. Sales activity and revenue potential were not visible in one place, making it difficult for leadership to understand what was actually happening in sales.
This Salesforce setup was designed to create a clean, consistent system for tracking deals and turning that activity into clear, real-time reporting.
What Was Built
This Salesforce setup includes:
A standardized Opportunity pipeline with defined sales stages
Revenue tracking using Opportunity Amount and Close Date
Three KPI reports for pipeline value, deal count, and deal size
One executive Sales Performance dashboard
Automatic activity tracking through Salesforce Chatter
Together, this creates a clean, reliable sales reporting foundation for a small team.
How Sales Data Flows Through the System
Sales reps work inside Salesforce by updating their opportunities. When deal amounts, stages, or close dates change, Salesforce automatically recalculates the underlying reports and updates the dashboard.
This ensures leadership always sees accurate, up-to-date pipeline metrics without spreadsheets or manual reporting.
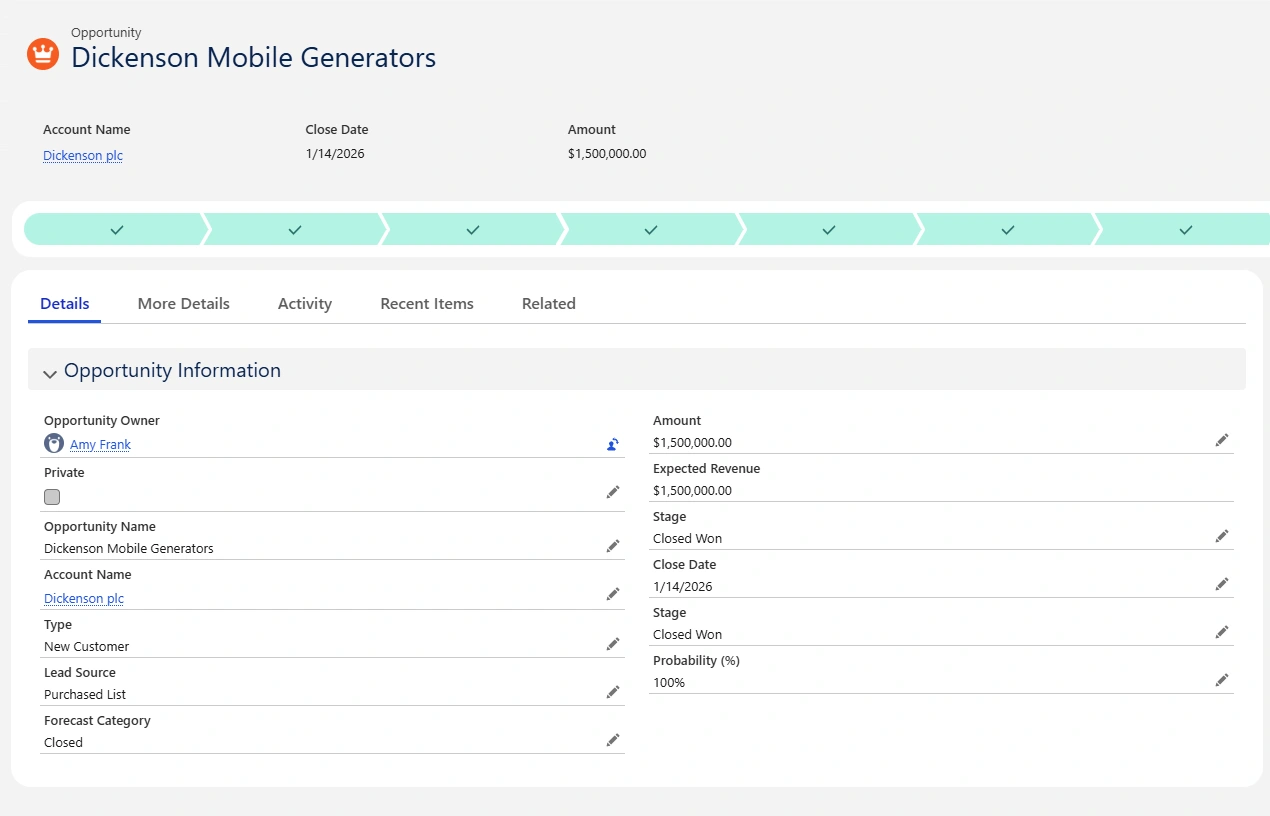
Opportunity record with deal amount, stage, and close date
Opportunity Record
This shows an individual opportunity inside Salesforce, including:
Deal name
Deal amount
Sales stage
Close date
Pipeline progress
This is the data that drives all reporting and dashboards.
Live Activity and Audit Trail
Every important change to an opportunity is logged automatically. This creates transparency and allows sales leaders to see when deals were updated or closed.
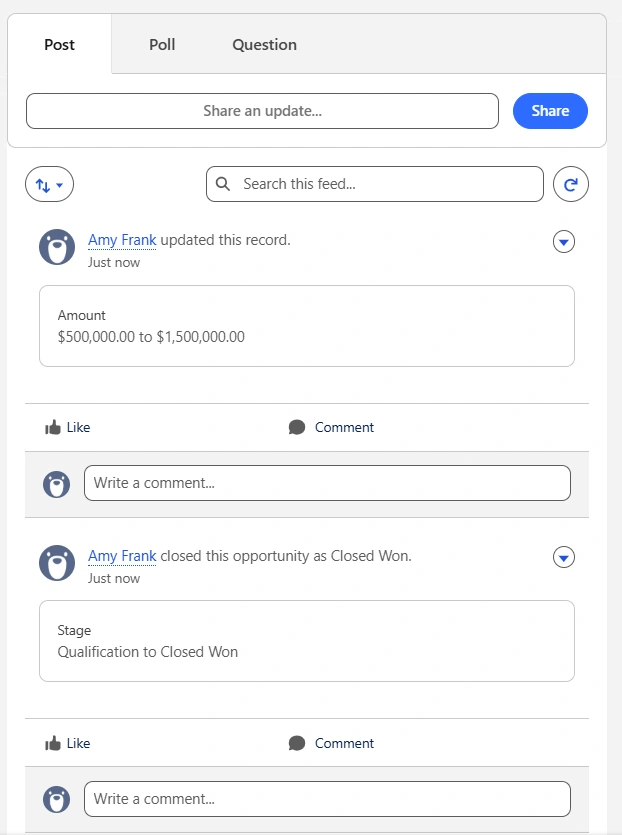
Chatter activity tracking deal updates and closed-won status
Chatter Activity Feed
This shows real-time tracking of:
Deal amount changes
Stage updates
Closed-won activity
This provides accountability and trust in the numbers shown on the dashboard.
Pipeline Visibility
Beyond the top-level KPIs, Salesforce also shows how deals are distributed across the pipeline so teams can see where opportunities are progressing or getting stuck.
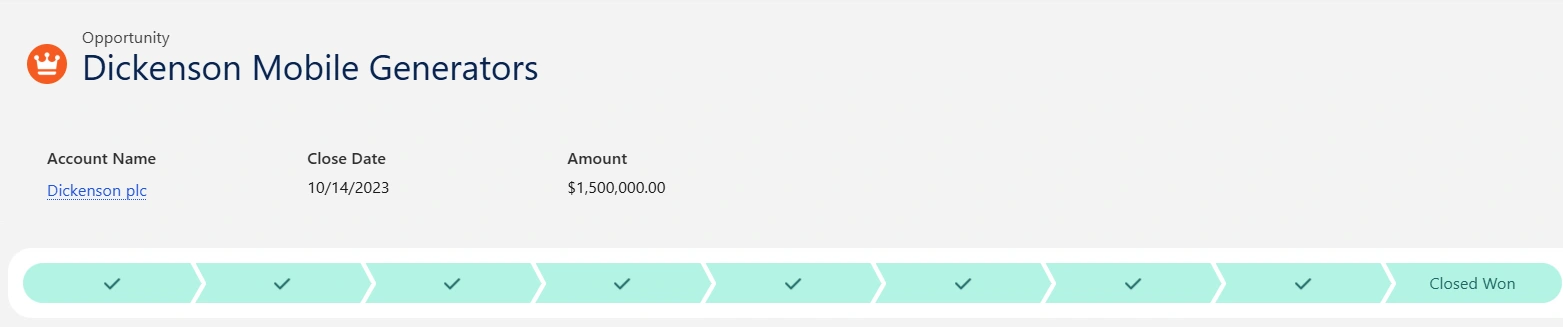
Sales pipeline grouped by stage
Sales Pipeline View
This shows opportunities grouped by stage, giving a clear picture of how deals are moving through the funnel.
What This Setup Delivers
With this Salesforce configuration in place, a founder or sales lead can:
See total pipeline value in one place
Know how many opportunities are currently active
Understand whether the team is working on larger or smaller deals
Rely on the numbers because they update automatically as sales activity changes
This creates a clear, shared view of sales performance across the team.
Next Steps
If you are setting up Salesforce for the first time and want a clear, reliable way to track leads, opportunities, and pipeline performance, feel free to reach out.
I am happy to talk through what a setup like this could look like for your team.
Like this project
Posted Jan 15, 2026
Configured Salesforce to track leads, opportunities, and revenue with live pipeline and deal reporting for a small sales team.
Likes
0
Views
3