
Ask an AI for any stock metric — and get the proof with it. I led product design for Radar by Tijoristack: investors describe any company KPI in plain words (subscribers, ARPU, capacity utilisation) and Radar reads annual reports to return a dated, sourced snapshot.
What went into it:
• Research with investors and analysts. The insight: nobody acts on an AI number they can't trace.
• A guided "Add a metric" flow where the AI restates what it understood before tracking anything.
• Snapshots as a timeline of events, with a source chip on every claim. Shipped with Tijoristack's dev team — live at tijoristack.ai/radar
From annual reports to a tracked metric in one question
Radar lets investors describe any company KPI in plain words, then reads filings and reports for them and returns a dated, sourced snapshot. I led the product design for Tijoristack, from research to the shipped web and mobile experience.
Client: Tijoristack
Industry: Fintech · AI equity research for investors and analysts
Product : Radar: custom stock-market metrics with AI snapshots
Scope: Research, flows, wireframes, web + mobile UI, build support
Role: Lead product designer, working with Tijoristack's developers
Status: Shipped and live
Timeline: 4 Weeks
The problem
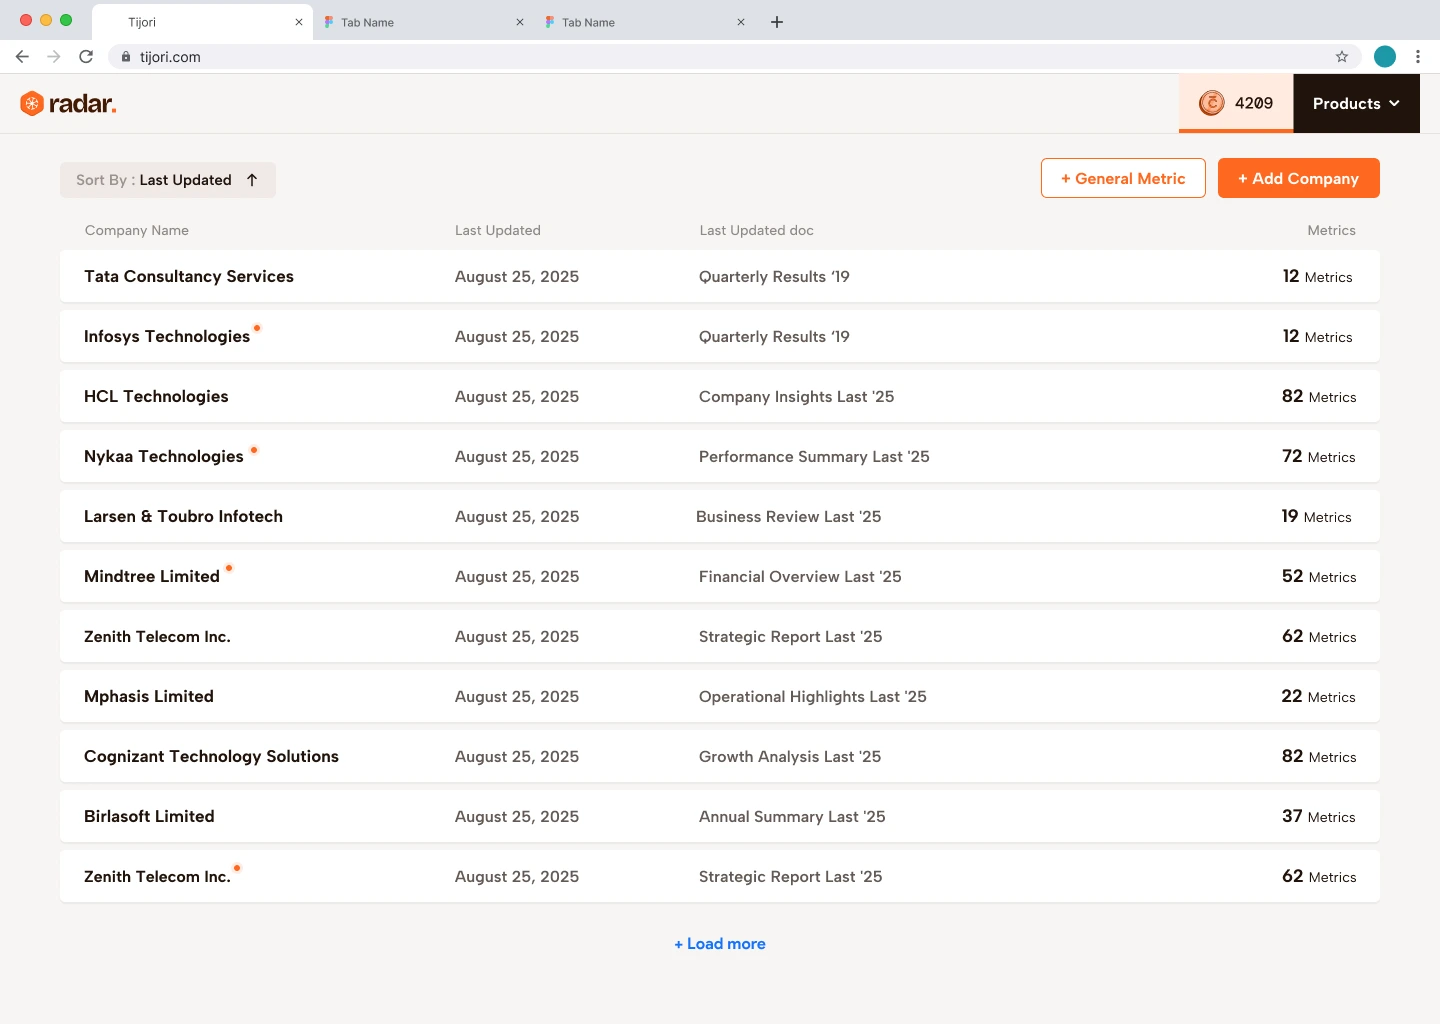
Screeners give everyone the same ratios: P/E, ROE, revenue growth. The numbers that actually move a stock are company-specific: subscribers for a telecom, ARPU, occupied-bed revenue for a hospital, capacity utilisation for a manufacturer. Finding them means digging through annual reports, earnings calls and investor decks, quarter after quarter, then rebuilding the story by hand. Radar's job was to let an investor ask for any metric and get it back, with dates and sources they can trust.
Users and the insight
Radar serves retail investors who research their own stocks, and analysts at funds and advisory firms who track a watchlist every quarter. Research with users and Tijoristack's founders kept landing on one point: investors won't act on an AI number they can't trace back to a filing. Speed mattered less than proof.
That shifted the brief from "generate an answer" to "show your work". Every snapshot carries its source, every event its date, and the AI restates what it understood before it starts tracking anything.
Approach
Listen. Sessions with investors, analysts and the Tijoristack team on how they track company KPIs today: spreadsheets, PDF annual reports, saved earnings-call notes.
Map the two core jobs. "Add a metric I care about" and "Understand what's happening with it." Flows and wireframes for both before any visual design.
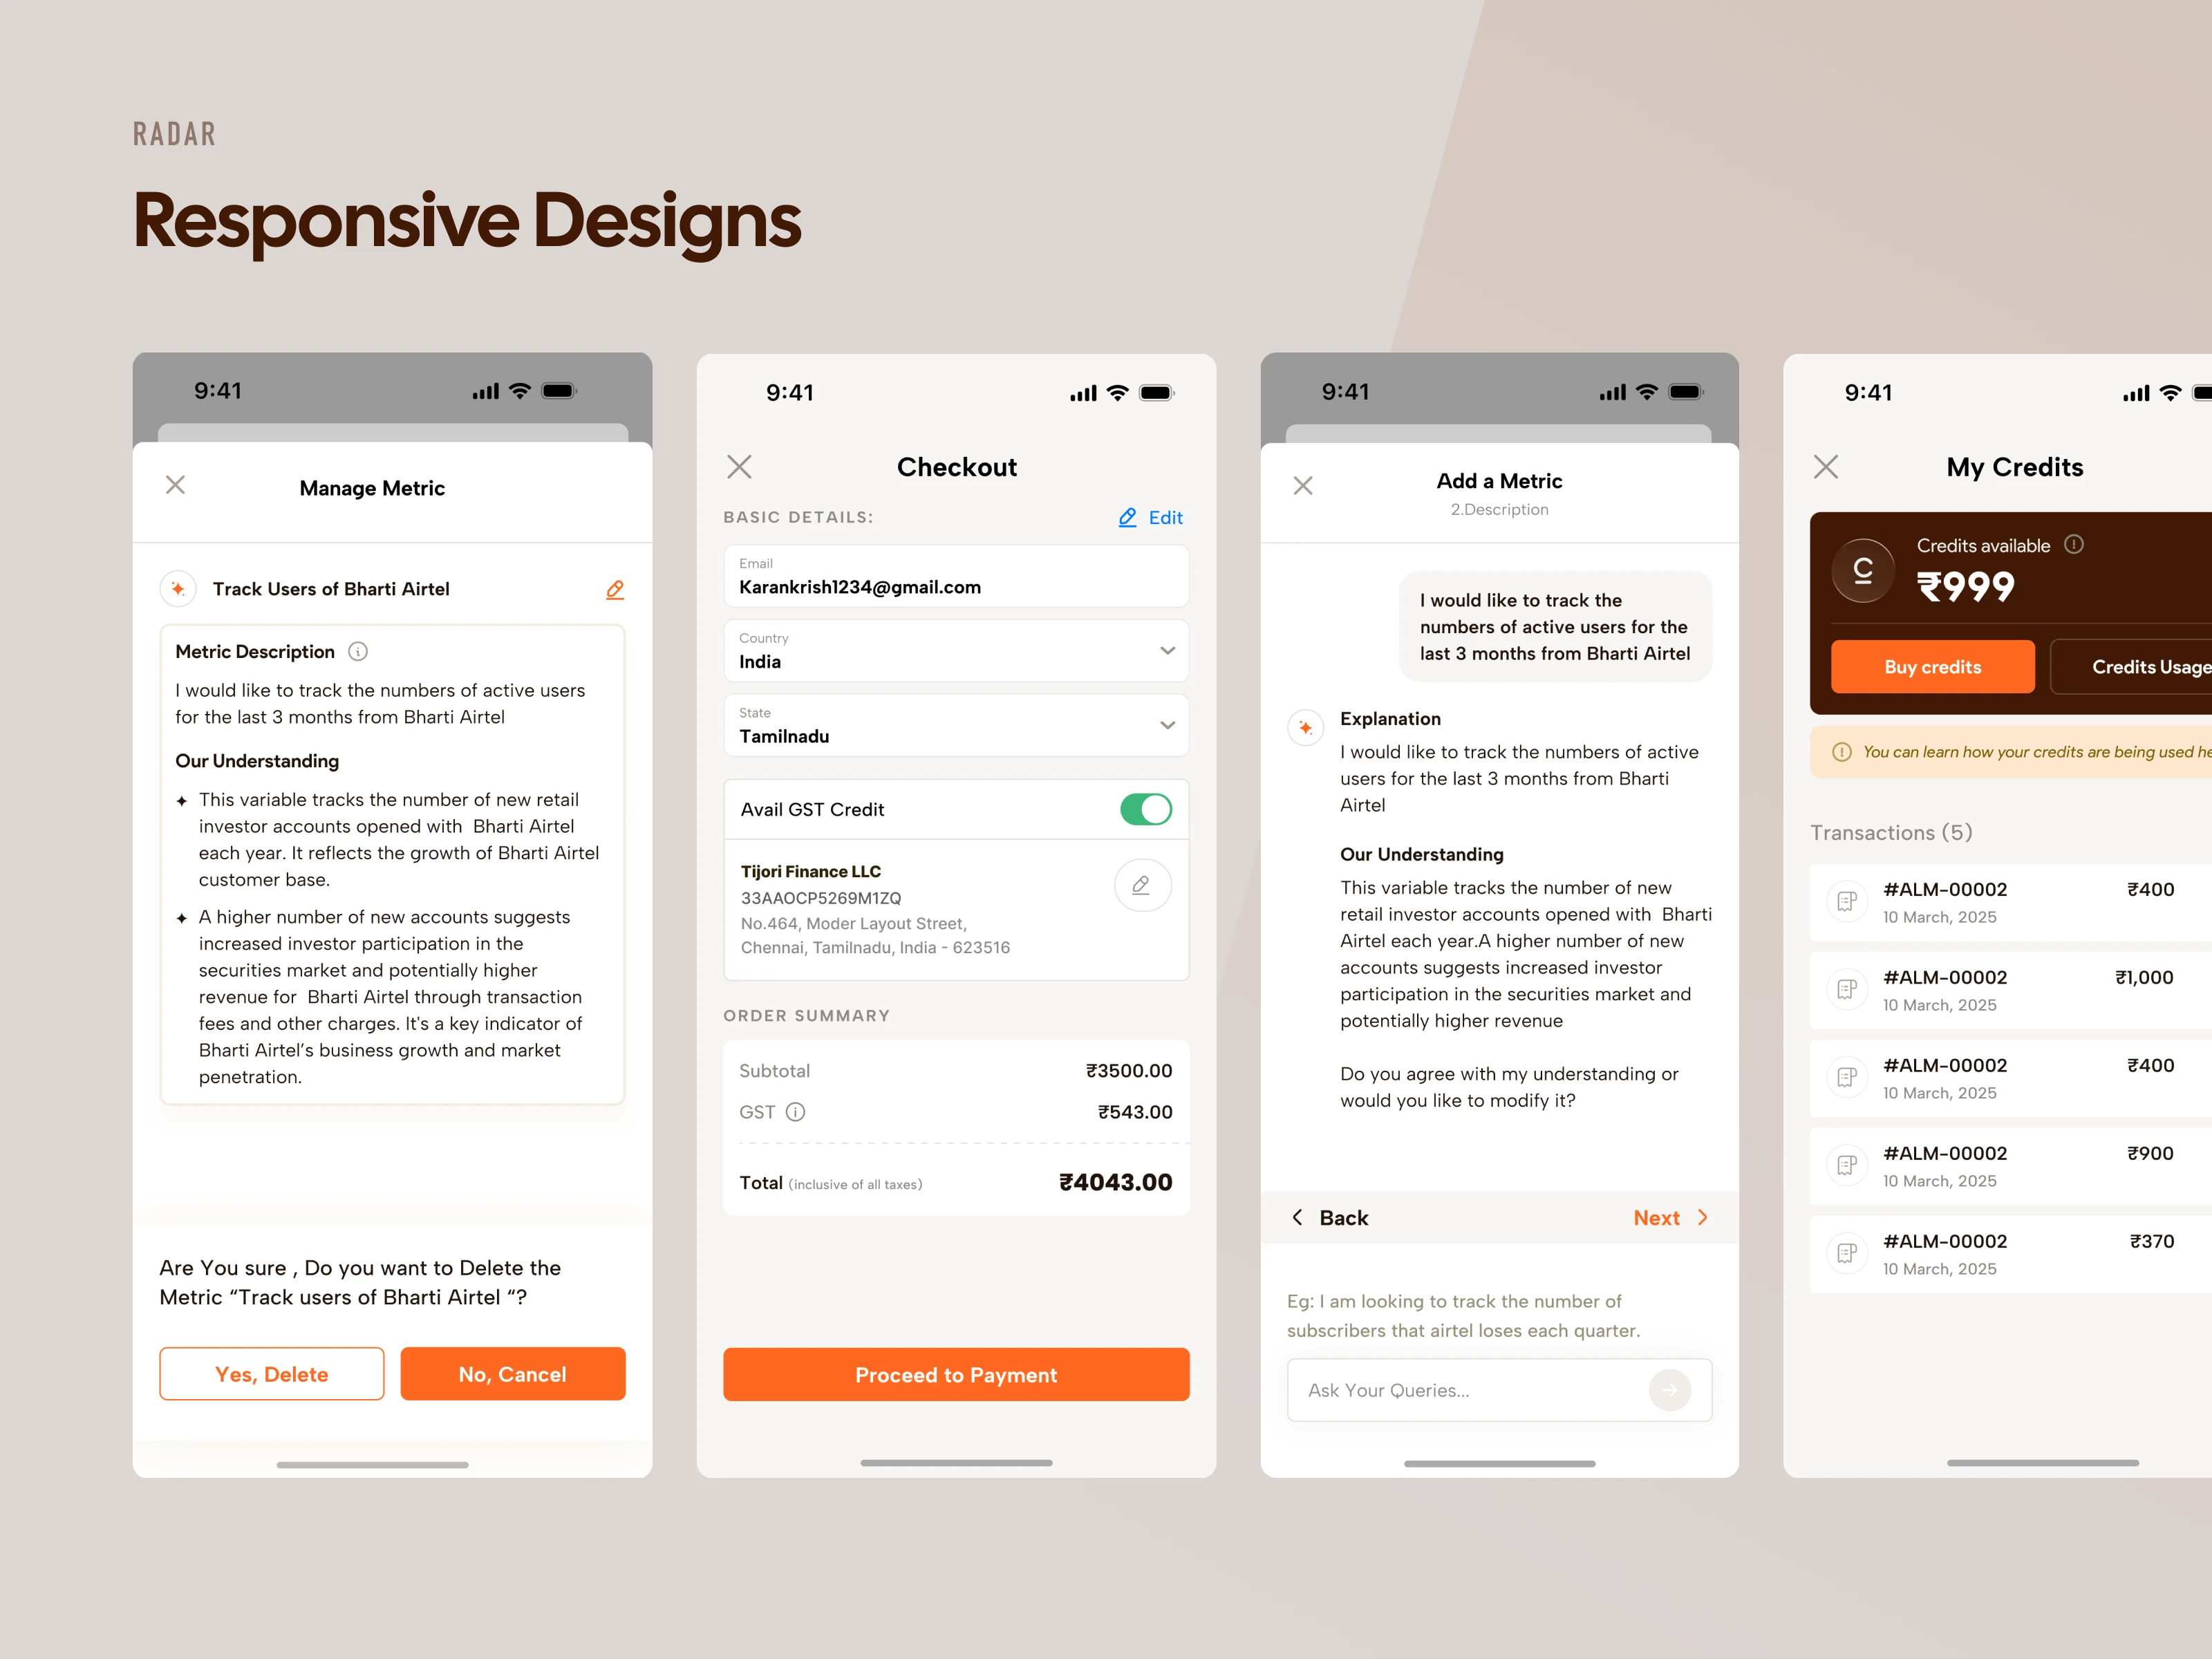
Design for two moments. Desktop for deep reading of a snapshot; mobile for quickly adding a metric in a guided, conversational flow.
Build with the devs. Worked alongside Tijoristack's engineers through implementation, adjusting components as real AI output replaced placeholder copy.
Key design decisions
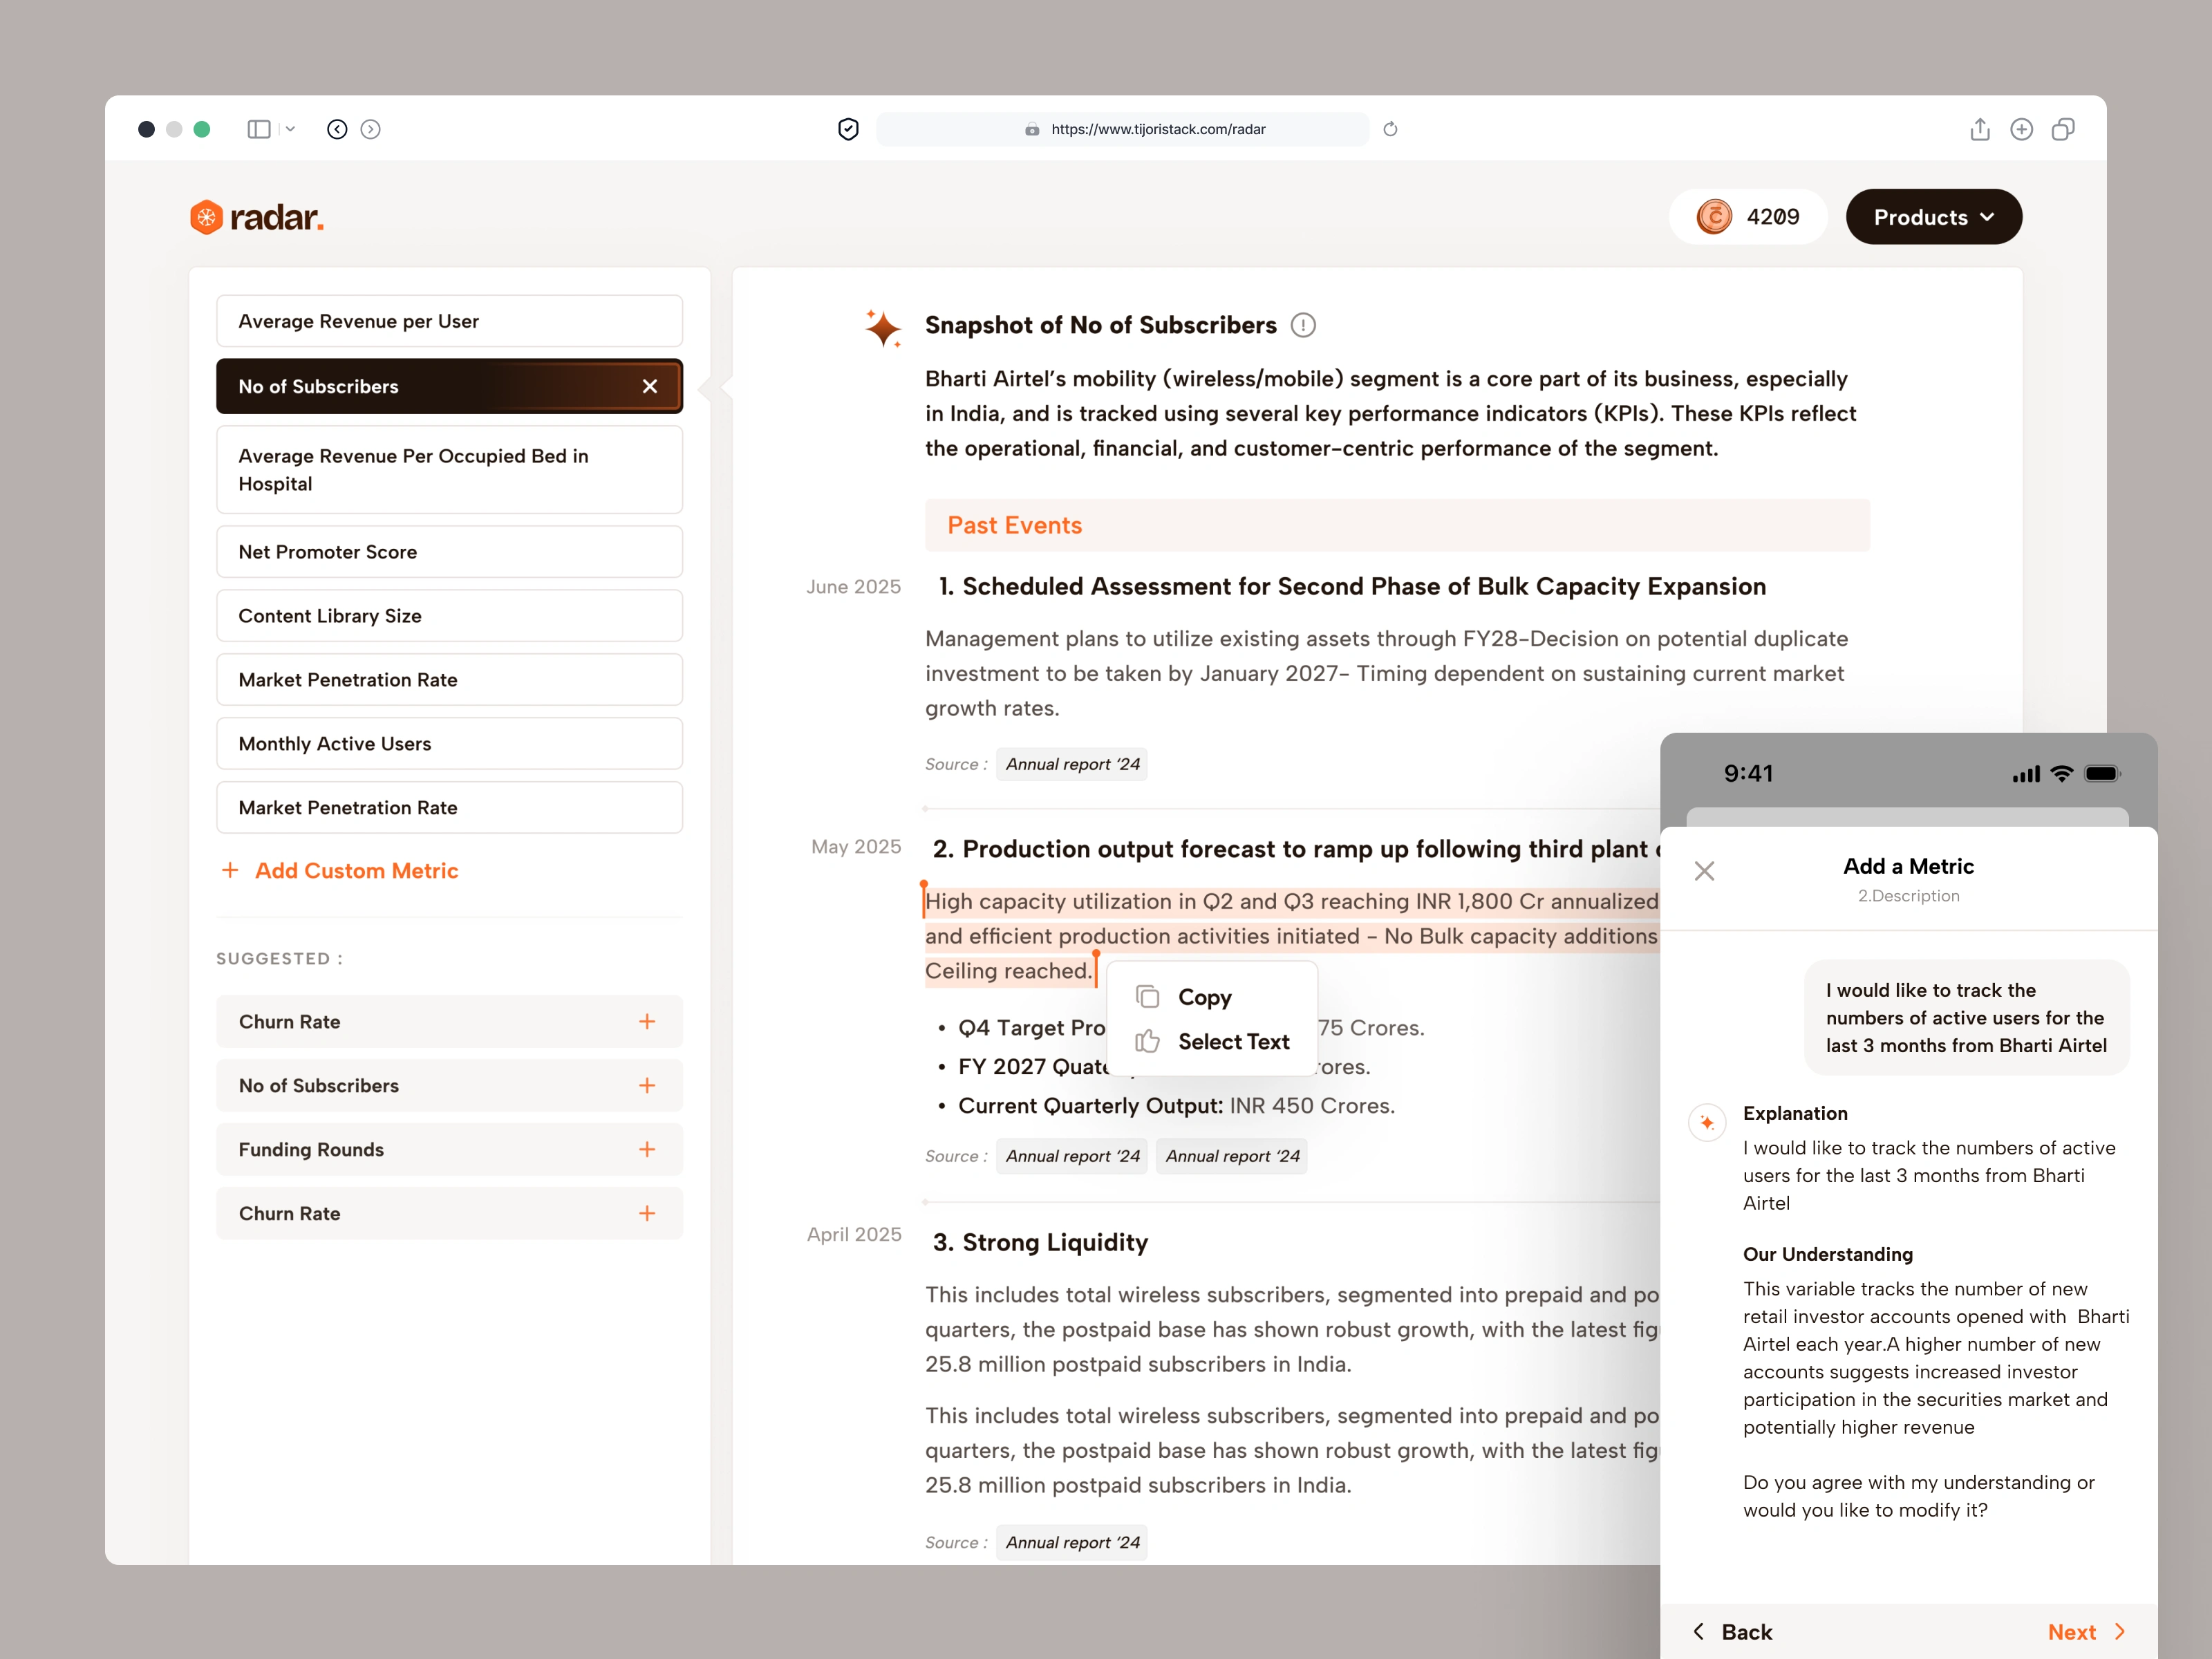
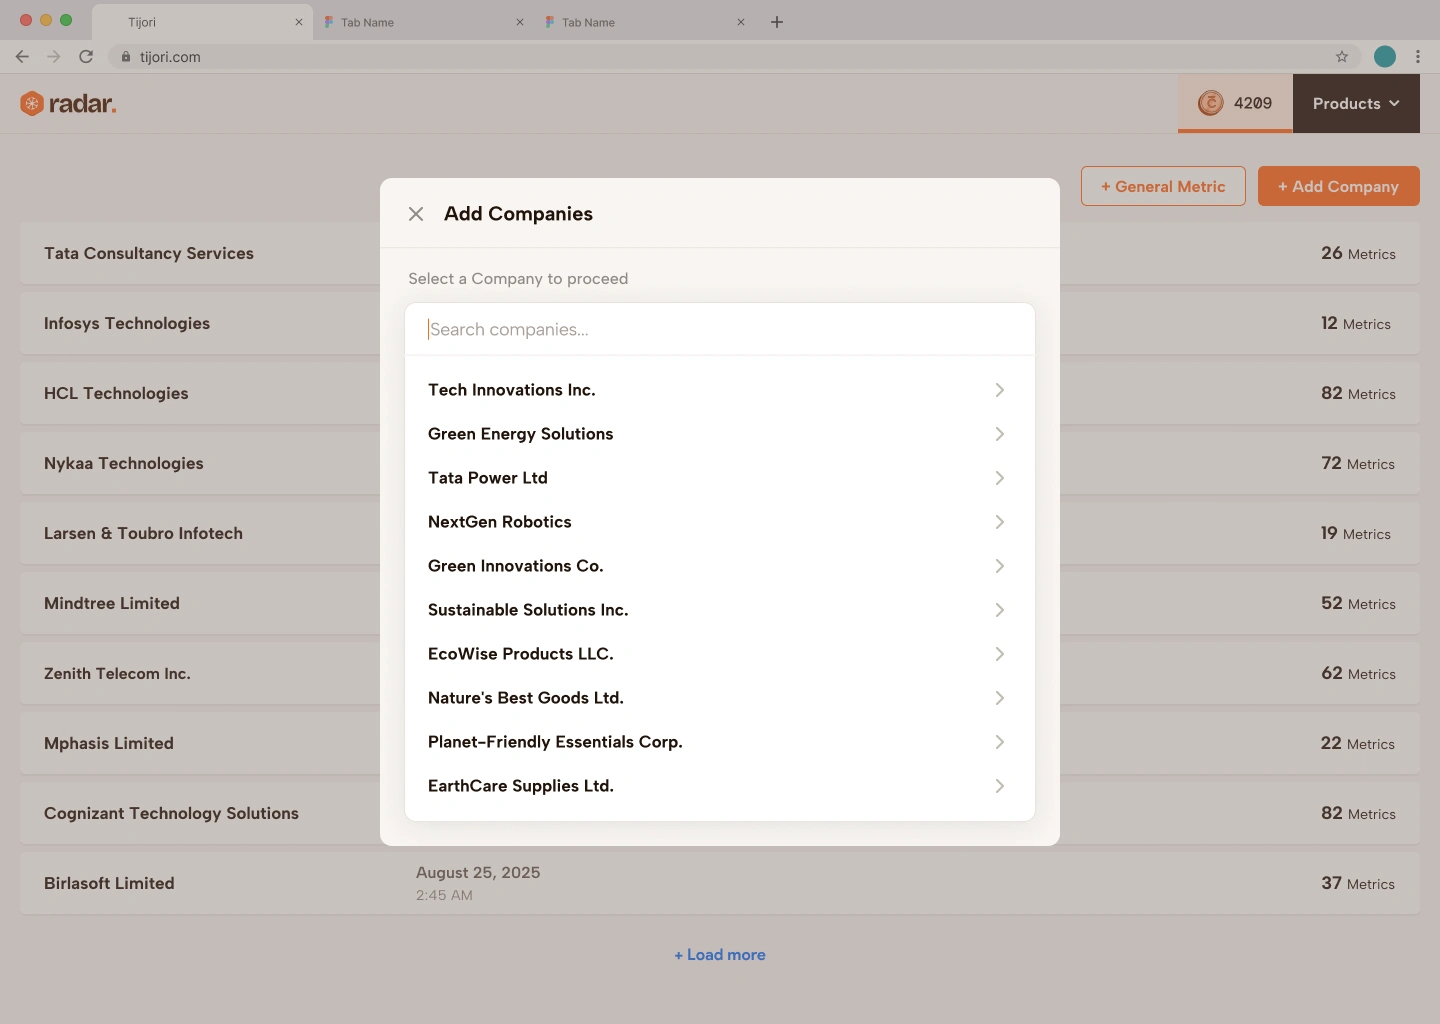
The AI confirms what it understood before it tracks anything. A one-box prompt that returns a result instantly was faster, but a misread metric silently pollutes every snapshot after it. Adding a metric became a short guided flow: the user writes what they want, Radar replies with an Explanation and Our understanding, then asks "Do you agree, or would you like to modify it?" One extra tap buys a correct definition for every quarter that follows.
A snapshot is a dated story, not a single number. A chart alone hides why a metric moved. Each snapshot opens with a short summary, then a timeline of past events (capacity expansions, production forecasts, liquidity) with the date in the margin and the key figures pulled out as bullets. The investor reads the reason next to the number.
Sources sit on every claim. We considered one sources list at the bottom of the page. Instead, each event ends with source chips such as "Annual report '24", so trust is checked at the exact line a decision is made on.
Suggested metrics remove the blank page. Most users don't know which KPIs matter for an unfamiliar sector. The sidebar pairs "your metrics" with suggested ones (Churn rate, Funding rounds, No. of subscribers), each one tap to add, plus a clear path to a custom metric.
Outcome and next steps
Radar is live at tijoristack.ai/radar, built with Tijoristack's dev team from these designs. No usage numbers are public yet, so this case study claims shipping, not growth.
Designing an AI or fintech product? Let's talk
2 likes · 7 views · Nov 17, 2026
Ask an AI for any stock metric and get the proof with it. I led design for Radar by Tijoristack, from investor research to shipped web and mobile.
