Interactive and Dynamic Dashboard
Jagrit Sharma
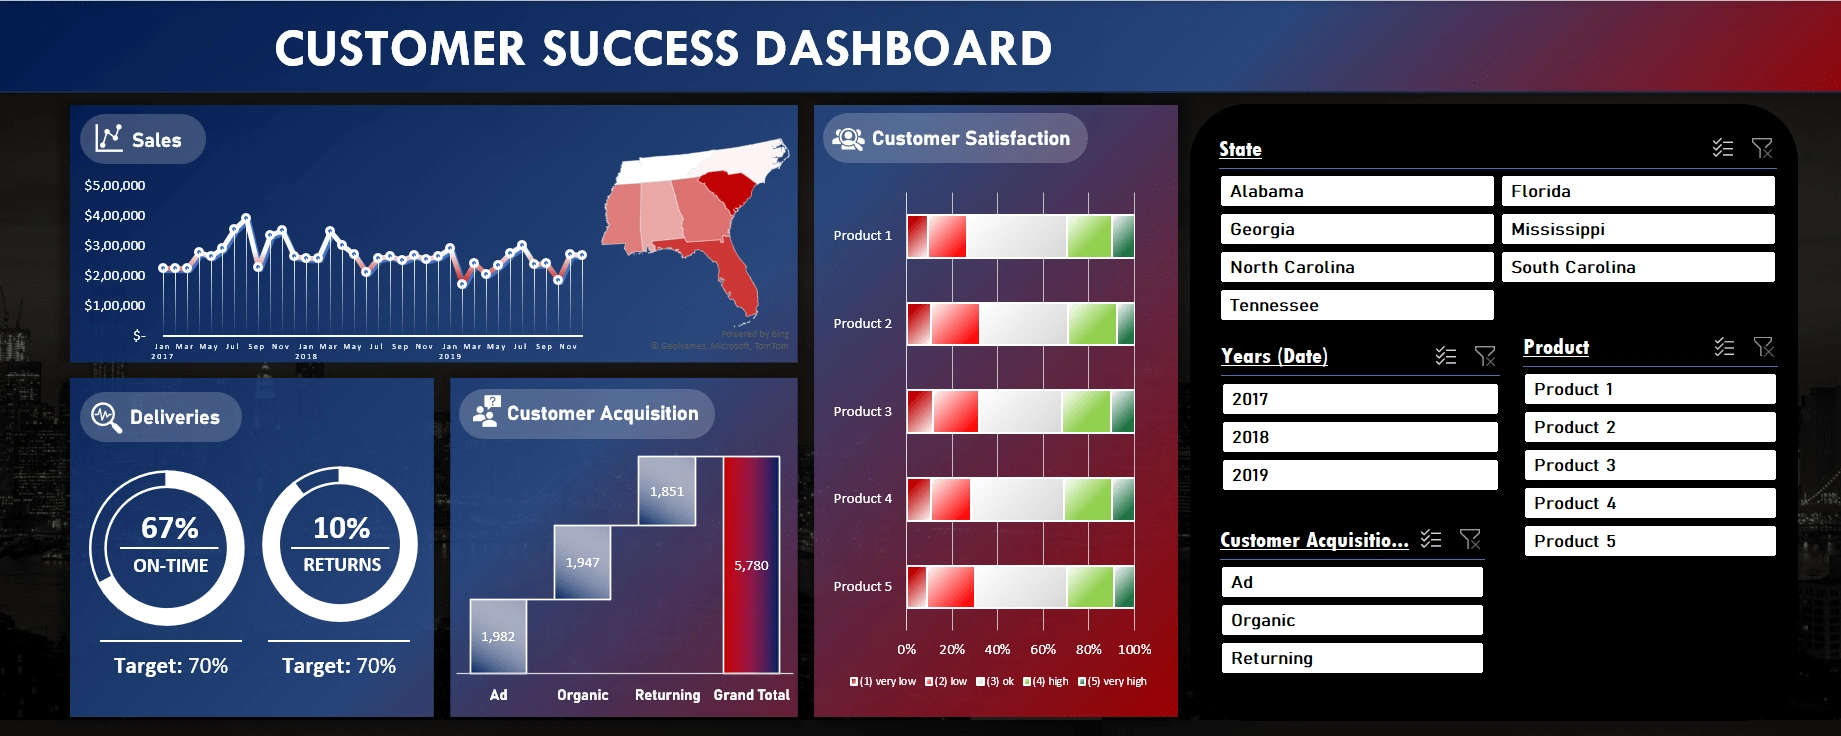
CUSTOMER SUCCESS DASHBOARD
Excel Dashboard
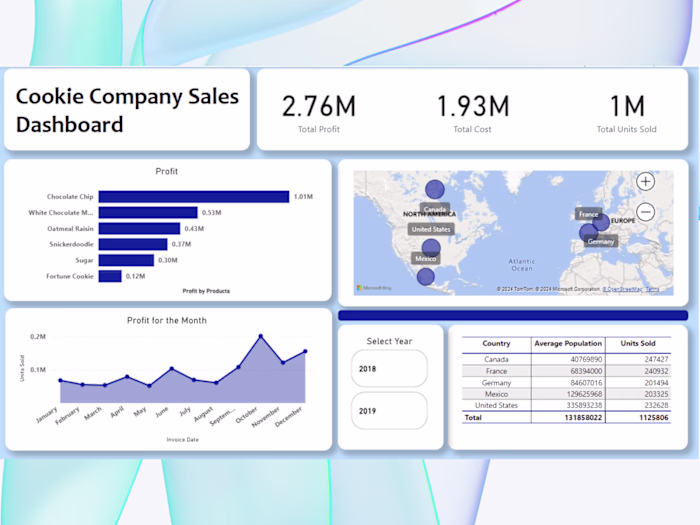
I made a user-friendly Excel dashboard that displays data in an organized and easy-to-understand way. I used pivot tables and slicers to allow users to interact with the data and filter it based on specific criteria. With one click, the charts, graphs, and map update to reflect the filtered data. This makes it easier to analyze the data and identify trends or patterns. The dashboard is designed to provide a comprehensive view of the data and enable users to make data-driven decisions with ease.
I created this dashboard in just 45 minutes, and I plan to develop more professional ones for my portfolio.
Like this project
Posted Apr 10, 2024
I have created an interactive Excel dashboard with slicers for dynamic data visualization, including charts, doughnut charts, and a map.
Likes
0
Views
1