Power BI Dashboard
Jagrit Sharma
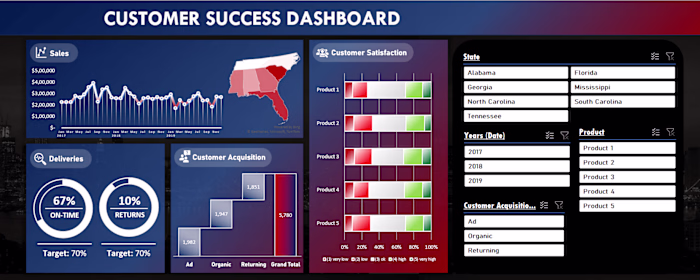
I have created an interactive and visually appealing dashboard in Power BI.
Dynamic Dashboard
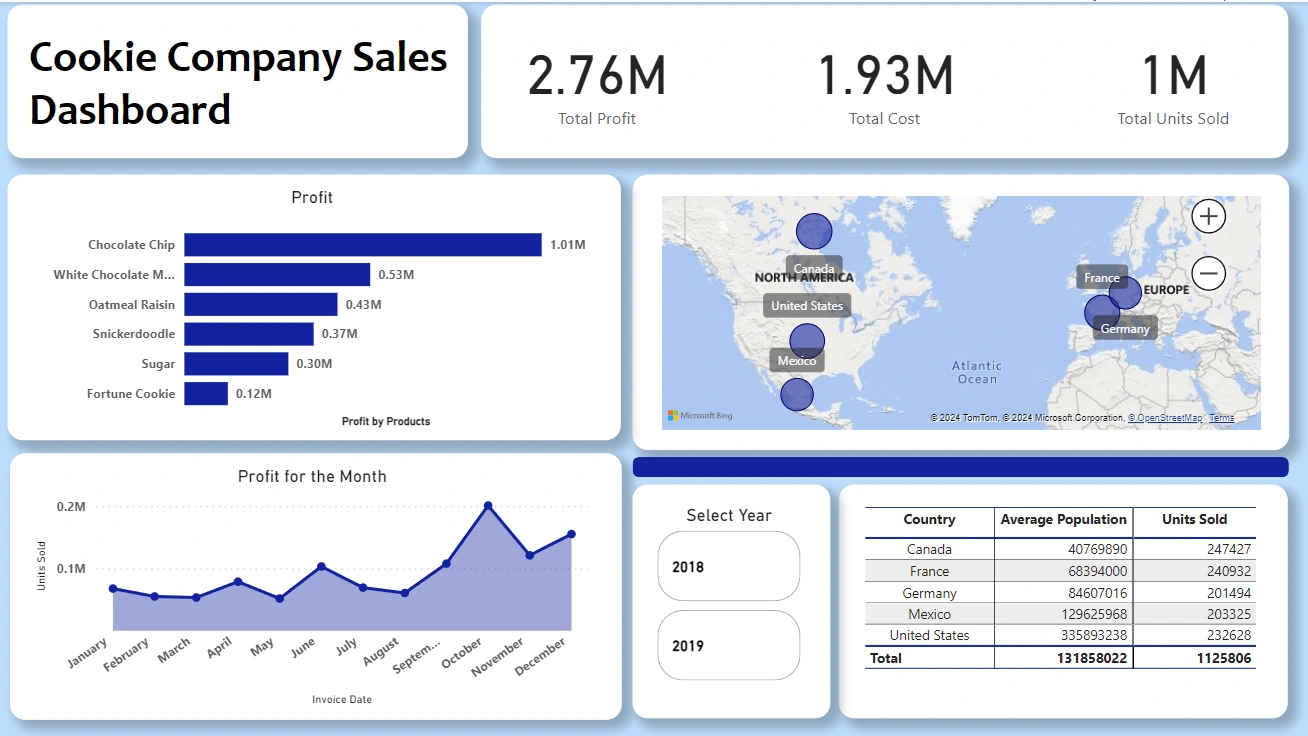
I've developed an interactive Power BI dashboard to monitor the Cookie company's financial performance. It offers detailed insights into profits, costs, and units sold, allowing for a comprehensive analysis of the business.
The dashboard includes a map visualization to track sales across different regions, providing a geographical perspective. Additionally, it features a monthly profit breakdown, helping identify trends and patterns over time.
One of the unique aspects of this dashboard is its comparison of total units sold to the average population of the country, offering valuable market penetration insight. Furthermore, a slicer enables users to toggle between data for 2018 and 2019, facilitating easy year-on-year comparisons for strategic decision-making.
Thank you
Like this project
Posted Apr 12, 2024
The Power BI Dashboard I created helps analyze business situations and make data visually appealing.
Likes
0
Views
0