CrowdIntel: Spatial Market Intelligence

Omoniyi Daniel



Turn a field of signals into a map you can explore.
Overview
CrowdIntel (BETA) is a high-tech market-intelligence interface built around a 3D network view. Instead of presenting markets as a flat list of rows and charts, the product places them inside a spatial system where nodes, clusters, and glowing relationships can be explored in context.
The experience combines a galaxy-like data field with filtering, temporal controls, market tooltips, and a selected-trader detail panel. The result is an interface that makes relational data feel tangible while retaining the analytical depth needed for investigation.
CrowdIntel network overview
The challenge
Complex market data is difficult to understand when every signal is separated into a table, card, or isolated chart. Users need to see both the larger pattern and the individual activity behind it: where clusters form, how sentiment changes over time, and which traders or markets deserve a closer look.
CrowdIntel needed an interface that supported exploration at multiple levels, from a category-level view to a detailed trader profile with historical performance and activity.
The approach
The product uses a 3D galaxy metaphor as its primary information space. Market questions become nodes. Light trails suggest relationships or shared activity. Larger clusters provide visual anchors, while heat-like concentrations communicate where activity is densest.
A category bar makes major domains directly accessible, including Politics, Geopolitics, Crypto, Finance, Tech, Sports, Entertainment, Social Media, and Other. A timeline and playback control add a temporal dimension, allowing users to inspect how the network changes over a selected period.

Geopolitics market signals
Interaction design
The experience is designed around progressive investigation. Users can pan and zoom through the network, filter the visible category, toggle Sharp money or Clusters only, and scrub through time. Hovering a node reveals market context such as the question, probability, and volume. Selecting a trader opens a right-side detail panel with score, metrics, tabs, a profit and loss chart, and chronological activity.
The camera transitions smoothly between areas of the network. Pulsing nodes, satellite particles, and colored signals provide feedback without turning the data into decoration. Emerald and crimson distinguish positive and negative positions, while cyan marks active interface states and analytical focus.
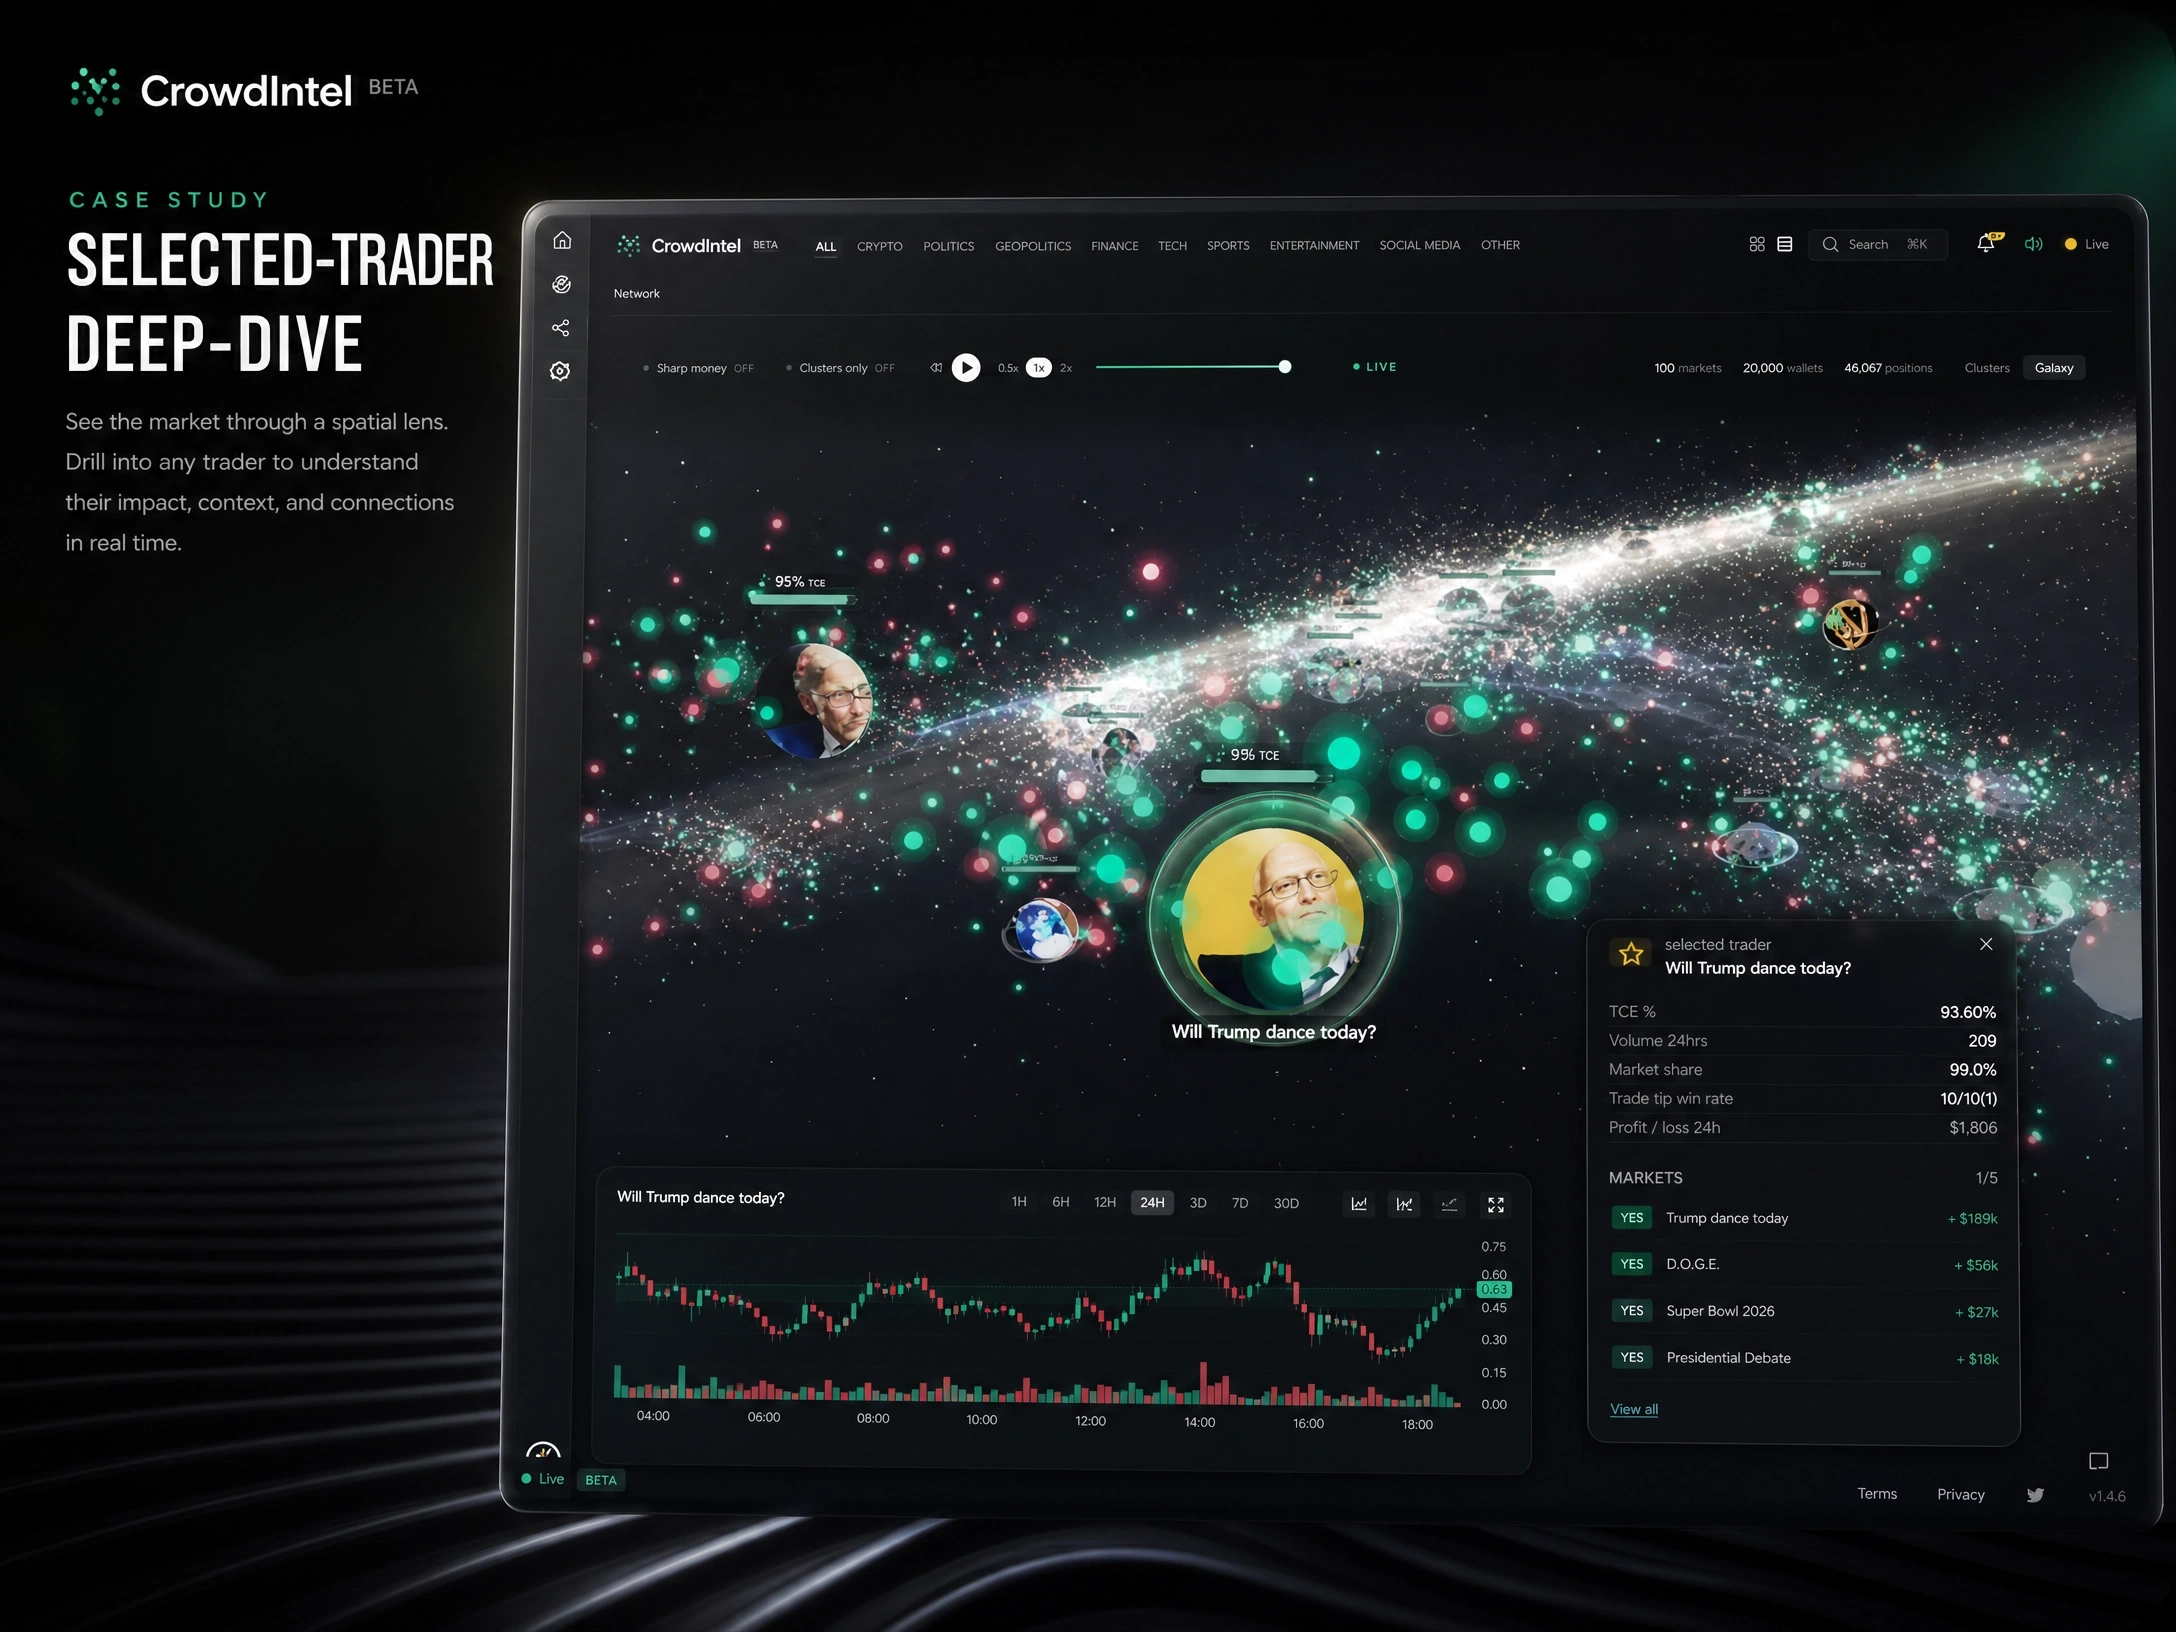
Trader detail view
Information architecture
Category navigation
Which market domain should I explore? Top filters for Politics, Geopolitics, Crypto, Finance, Tech, Sports, Entertainment, Social Media, and more.
Galaxy view
What is happening across the system? 3D nodes, clusters, relationships, and heat concentrations.
Temporal layer
How did the network change? A timeline scrubber with play and pause controls.
Market inspection
What does this node represent? A tooltip with market question, probability, and volume.
Trader deep dive
Who is behind the activity? A right-side detail panel with score, metrics, chart, and alerts.
What makes it memorable
CrowdIntel treats the network itself as the interface. Rather than asking users to read a static dashboard and mentally reconstruct relationships, it gives them a spatial model they can move through, filter, rewind, and inspect.
The visual metaphor supports the analytical purpose: clusters show proximity, trails imply connection, color communicates position, and motion guides attention. The 3D layer becomes part of the reasoning model, not a decorative surface.
Like this project
Posted Sep 1, 2026
A spatial market-intelligence interface that turns connected market signals into an interactive 3D network.