UX/UI Design for B2B Platform for Carbon Emissions Repoting

Yuliia Ishchenko


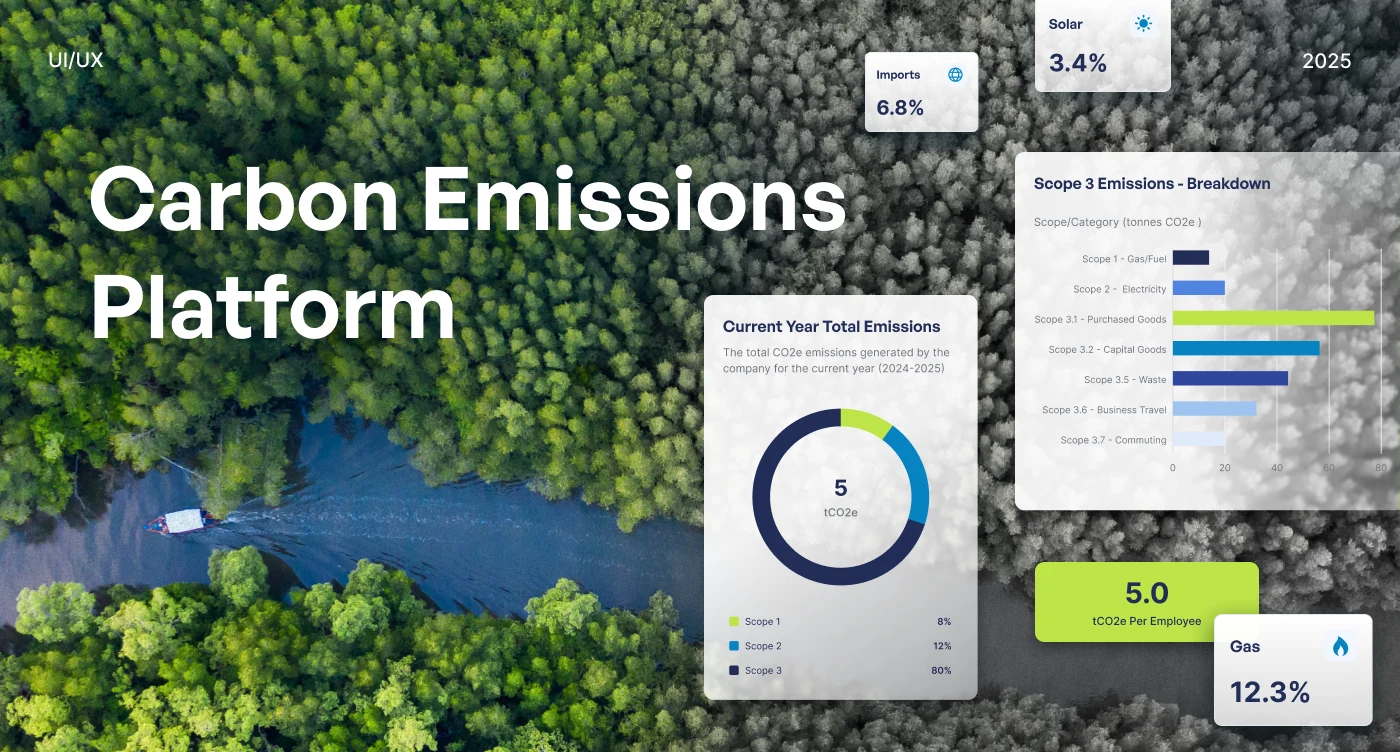
Carbon Emissions Platform
A carbon intelligence platform designed to help companies measure, analyze, and reduce their carbon footprint with clarity and precision.
NetScope is a sustainability SaaS platform that helps businesses simplify carbon reporting by automatically extracting and interpreting financial data from accounting tools such as Xero and QuickBooks. The platform transforms complex financial and emissions data into clear dashboards, reports, and sustainability insights aligned with global reporting standards.
Year: 2025
Industry: Climate Tech, Sustainability, Carbon Accounting, ESG, SaaS
Project Type: UX/UI Design, SaaS Platform, Landing Page, Company Report Page
Scope: Research, User Flow, Analysis, Wireframes, UI/UX Design, Company Report Page, Landing Page, Design System
Contribution: Product UX, UI Design, Dashboard Design, Data Visualization, Onboarding Flow, Design System, Landing Page Design
Project Overview
NetScope was designed as a carbon intelligence platform for companies that need to understand, report, and reduce their carbon emissions.
The product helps businesses connect financial data from cloud-based accounting tools and automatically transform it into carbon insights. Instead of manually collecting invoices, categorizing expenses, and calculating emissions, users can follow a guided flow that brings them from onboarding to a complete carbon footprint dashboard.
The main design challenge was to make carbon accounting feel simple, trustworthy, and actionable for users who may not be sustainability experts.
Problems
Carbon reporting is complex and data-heavy
Businesses often need to work with financial records, suppliers, expenses, emission scopes, reporting periods, and sustainability standards. Without a structured interface, this process can become confusing and time-consuming.
Many companies do not know where to start
Carbon footprint calculation requires several steps: company setup, financial period confirmation, data integration, accounting review, and emissions analysis. Users needed a clear journey that explains what to do next.
Financial data needs to be translated into carbon insights
Accounting data alone is not enough. The platform had to help users understand how financial transactions connect to emissions categories and Scope 1, Scope 2, and Scope 3 reporting.
Different roles needed different workflows
The product had to support both individual businesses and third-party agents, such as external accountants or consultants managing multiple clients.
Emissions data needed to be visually clear
The dashboard had to display total emissions, gas consumption, electricity consumption, emission trends, Scope 3 breakdowns, and carbon intensity metrics without overwhelming the user.
The product needed a public-facing report experience
Companies needed a branded report page that could present sustainability statements, emissions overview, carbon offsets, and downloadable resources in a professional format.
Goals
Simplify the carbon reporting process for businesses.
Create a guided onboarding journey from company setup to carbon insights.
Support two user roles: individual businesses and third-party agents.
Make financial data integration with Xero, QuickBooks, or manual upload easy to understand.
Design clear accounting review screens for expenses, suppliers, and nominal accounts.
Build a carbon footprint dashboard with easy-to-read data visualizations.
Create a landing page that communicates the product value clearly.
Design a company report page for sustainability reporting and public presentation.
Build a scalable design system for future platform development.
About the Project
NetScope is built around a clear mission:
Simplifying carbon reporting — empowering companies to take real climate action and meet sustainability goals with confidence.
The platform automatically extracts and interprets financial data to deliver real-time carbon insights. By connecting with accounting platforms such as Xero and QuickBooks, NetScope reduces manual work and helps companies understand where emissions are coming from.
The product is designed to give businesses a clearer path from financial data to sustainability action.
Workflow
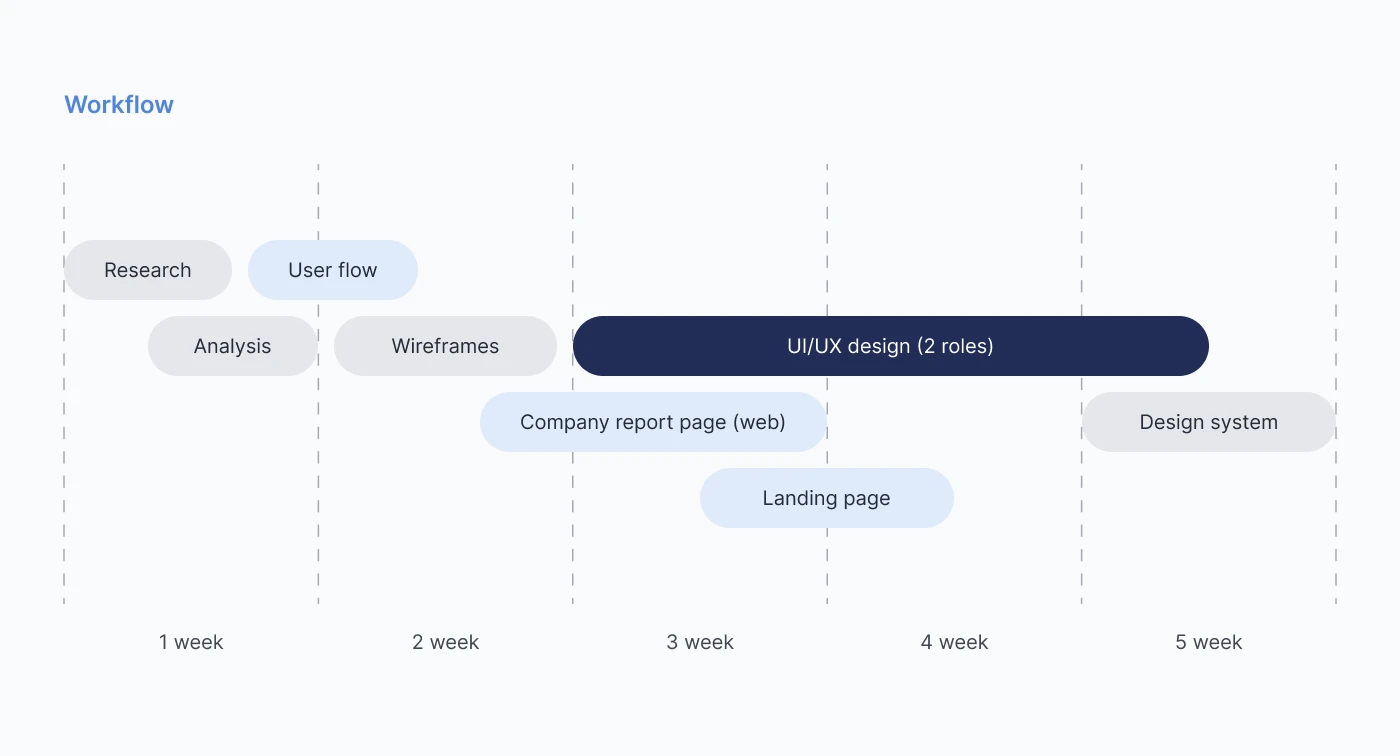
The project was structured across a focused five-week workflow.
Week 1
Research, user flow, and early analysis were completed to understand the product logic, user roles, and carbon reporting journey.
Week 2
Wireframes and early structure were created to define onboarding, accounting data review, and dashboard logic.
Weeks 2-4
The core UI/UX design phase covered the main product experience for two roles: individual businesses and third-party agents.
Weeks 3-4
The company report page and landing page were designed in parallel with the product interface.
Week 5
The design system was finalized to support consistency across the platform, landing page, and reporting experience.
Visual Identity
The visual identity was designed to feel professional, trustworthy, and sustainability-focused.
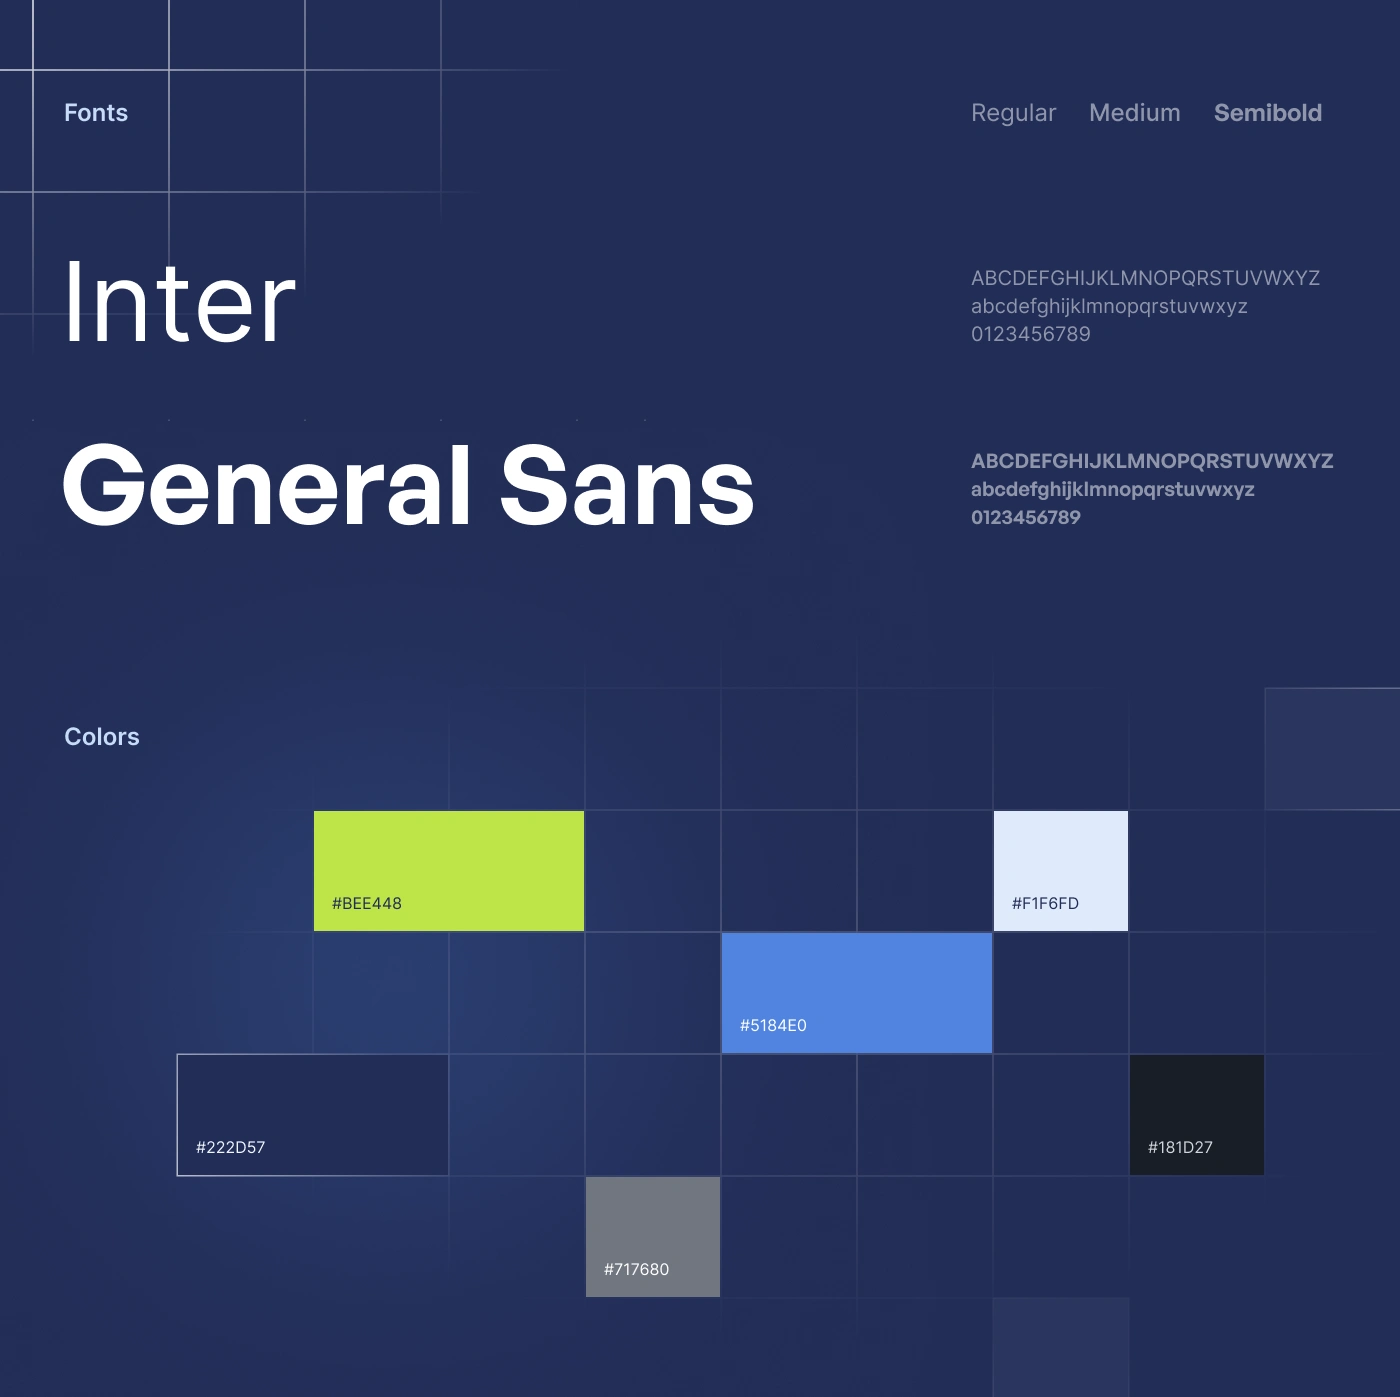
The style combines a dark navy foundation, clean white surfaces, light blue backgrounds, and a bright green accent. This creates a strong connection to climate and environmental themes while keeping the interface polished and business-oriented.
Typography
Two typefaces were used:
Inter - used for interface readability, dashboard data, tables, forms, labels, and navigation.
General Sans - used for larger headings and brand-oriented sections to give the product a modern, confident tone.
Color Palette
The color system includes:
#BEE448 — bright green accent used for key actions, progress, sustainability highlights, and active states.
#5184E0 — blue accent used for charts, secondary data visualization, and supporting highlights.
#F1F6FD — light surface color used for clean dashboard areas and cards.
#222D57 — primary navy color used for navigation, contrast, and brand foundation.
#181D27 — dark neutral used for deeper contrast and premium sections.
#717680 — gray tone used for secondary text, metadata, and neutral UI elements.
The palette helps balance environmental messaging with the seriousness of financial and compliance-related data.
Platform Structure
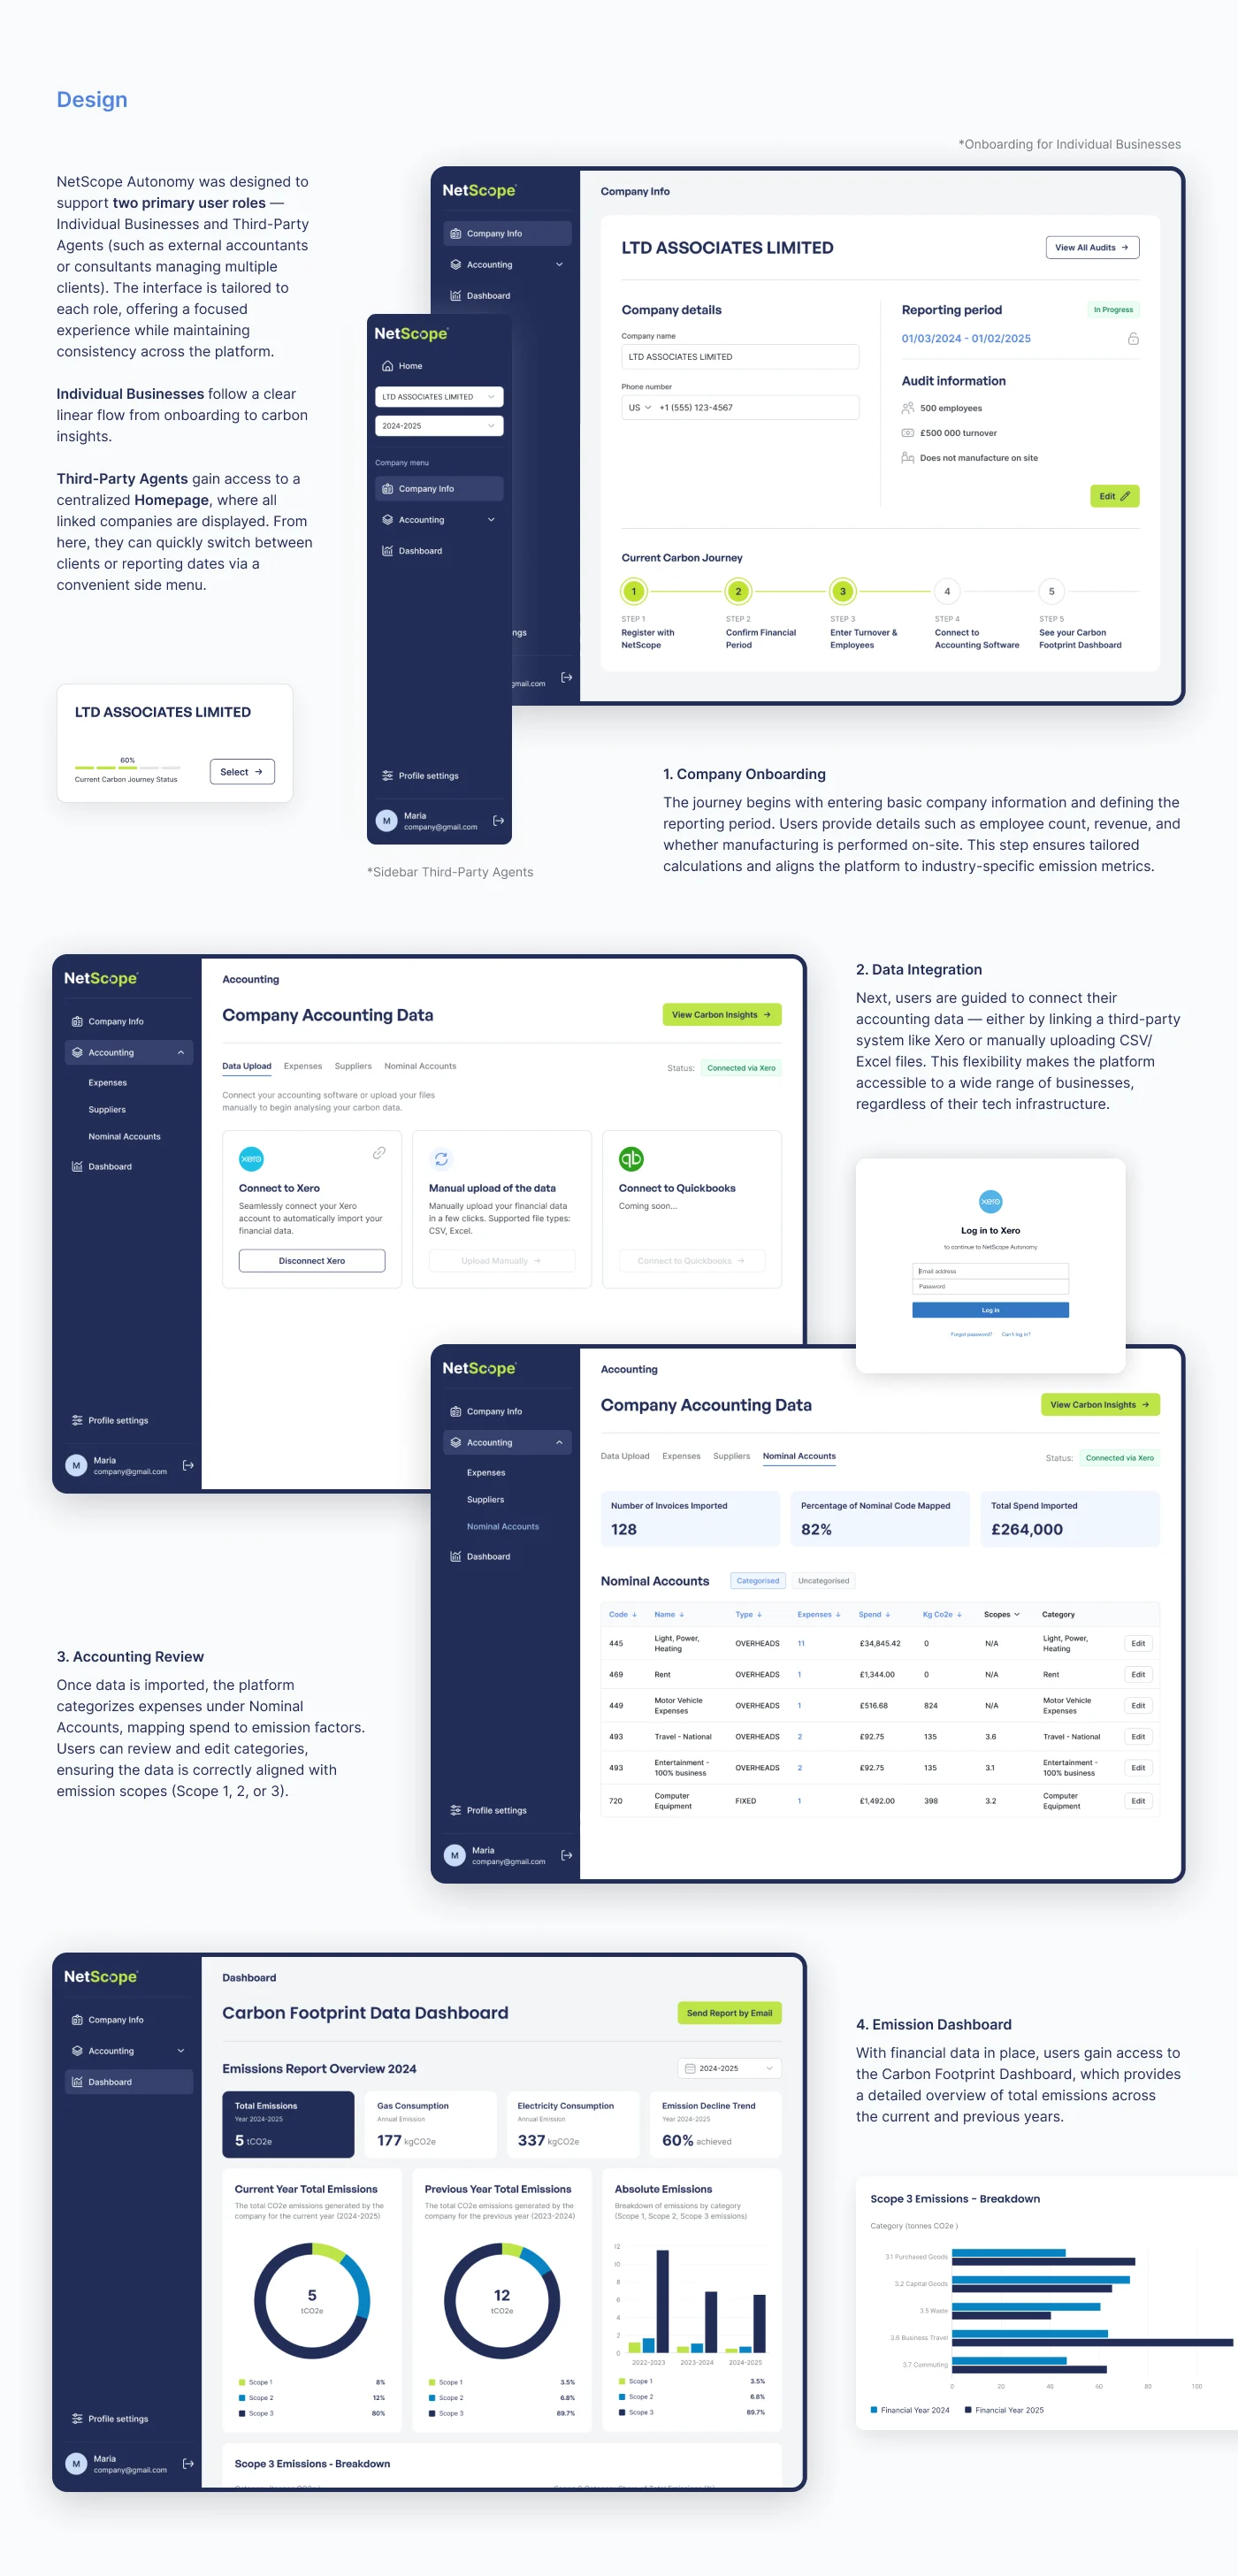
NetScope was designed to support two primary user roles.
Individual Businesses
Individual businesses follow a clear linear flow from onboarding to carbon insights.
They enter company information, define the reporting period, confirm financial details, connect accounting software, review accounting data, and then access their carbon footprint dashboard.
This role is focused on simplicity and guided progress.
Third-Party Agents
Third-party agents can manage multiple companies from one centralized workspace.
They can switch between linked companies, track client progress, review reporting periods, and access each company’s carbon journey through a convenient side menu.
This structure makes the platform useful for external accountants, consultants, and sustainability advisors managing several clients.
Company Onboarding
The onboarding flow starts with basic company information and reporting details.
Users provide information such as company name, phone number, annual revenue, employee count, turnover, and whether manufacturing is performed on-site.
A progress tracker called the Current Carbon Journey guides users through the main steps:
Register with NetScope
Confirm financial period
Enter turnover and employees
Connect to accounting software
See the carbon footprint dashboard
This structure helps users understand the full process and reduces uncertainty.
Data Integration
The platform guides users through connecting their accounting data.
Users can connect to Xero, upload data manually using CSV or Excel, and prepare for QuickBooks integration.
This makes the product flexible for businesses with different financial workflows and technical setups.
The design focuses on making integrations clear, visual, and easy to follow.
Accounting Review
Once data is imported, users can review and edit accounting information.
The accounting section includes:
Expenses
Suppliers
Nominal accounts
Invoice data
Spend values
Kilograms of CO2e
Emission scopes
Categories
Mapped and unmapped nominal codes
Users can check how financial data is categorized and ensure that expenses are correctly aligned with emission categories.
This step is important because it connects raw financial data to meaningful carbon calculations.
Carbon Footprint Dashboard
The dashboard was designed to give users a complete overview of their emissions.
The dashboard uses cards, donut charts, bar charts, and status metrics to make sustainability data easier to understand.
The goal was to help businesses quickly see where their emissions come from and what areas need attention.
Scope-Based Emissions Visualization
A key part of the dashboard was visualizing emissions across Scope 1, Scope 2, and Scope 3.
The interface shows how much each scope contributes to total emissions and breaks down Scope 3 into categories such as: Gas and fuel, Electricity, Purchased goods, Capital goods, Waste, Business travel, Commuting.
This helps users identify the most significant sources of emissions and prioritize reduction actions.
Landing Page Design
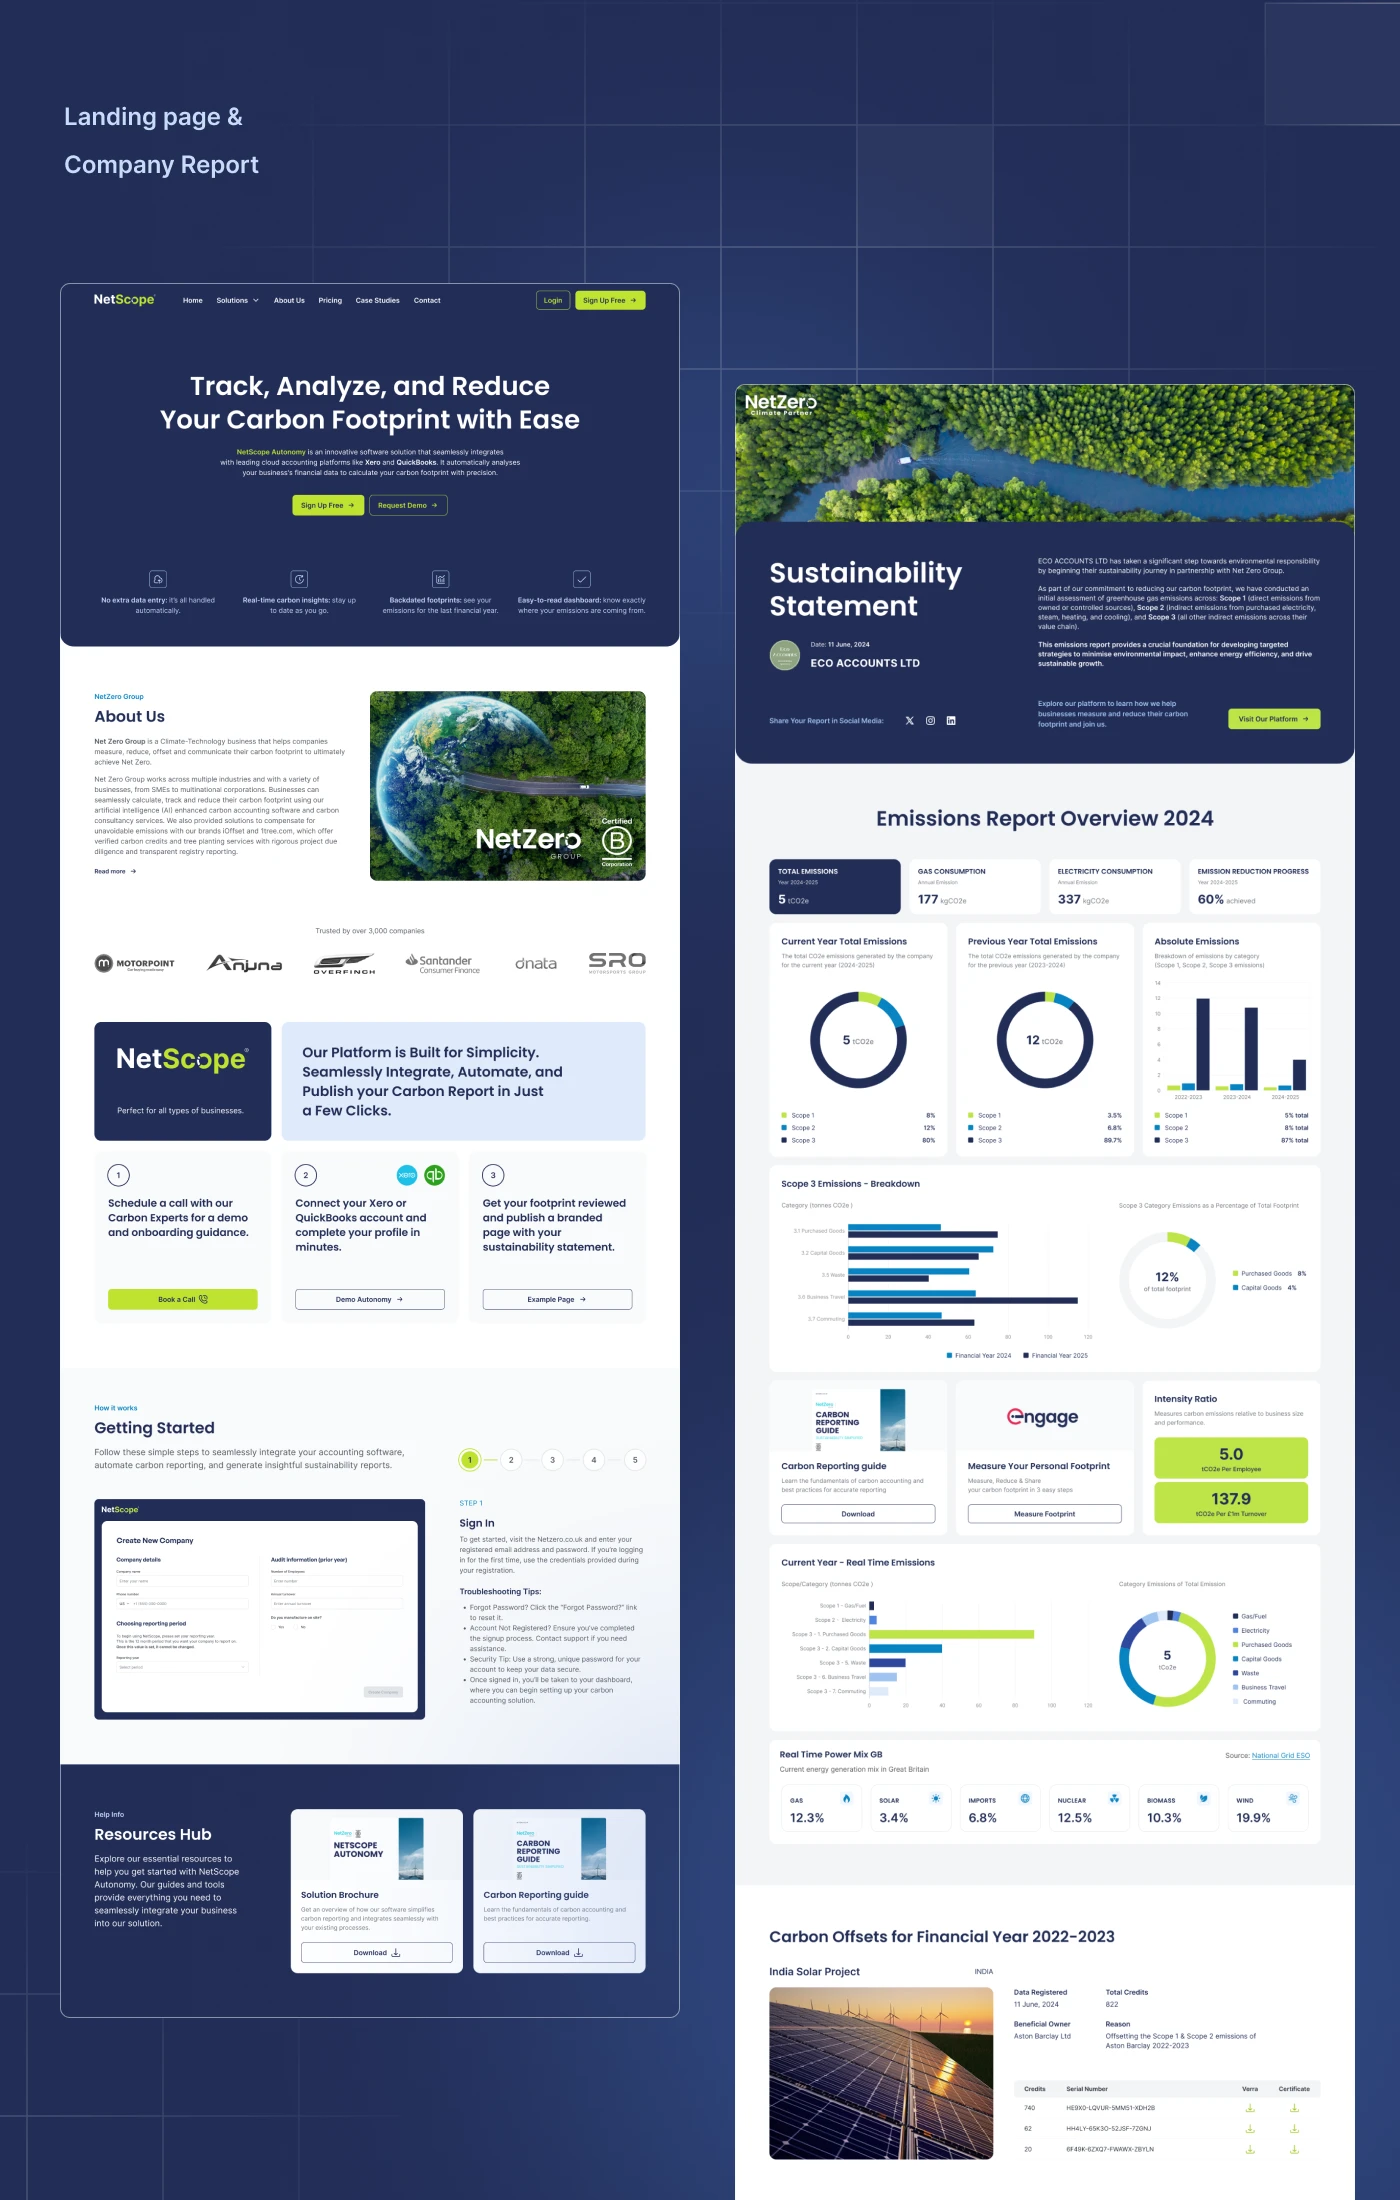
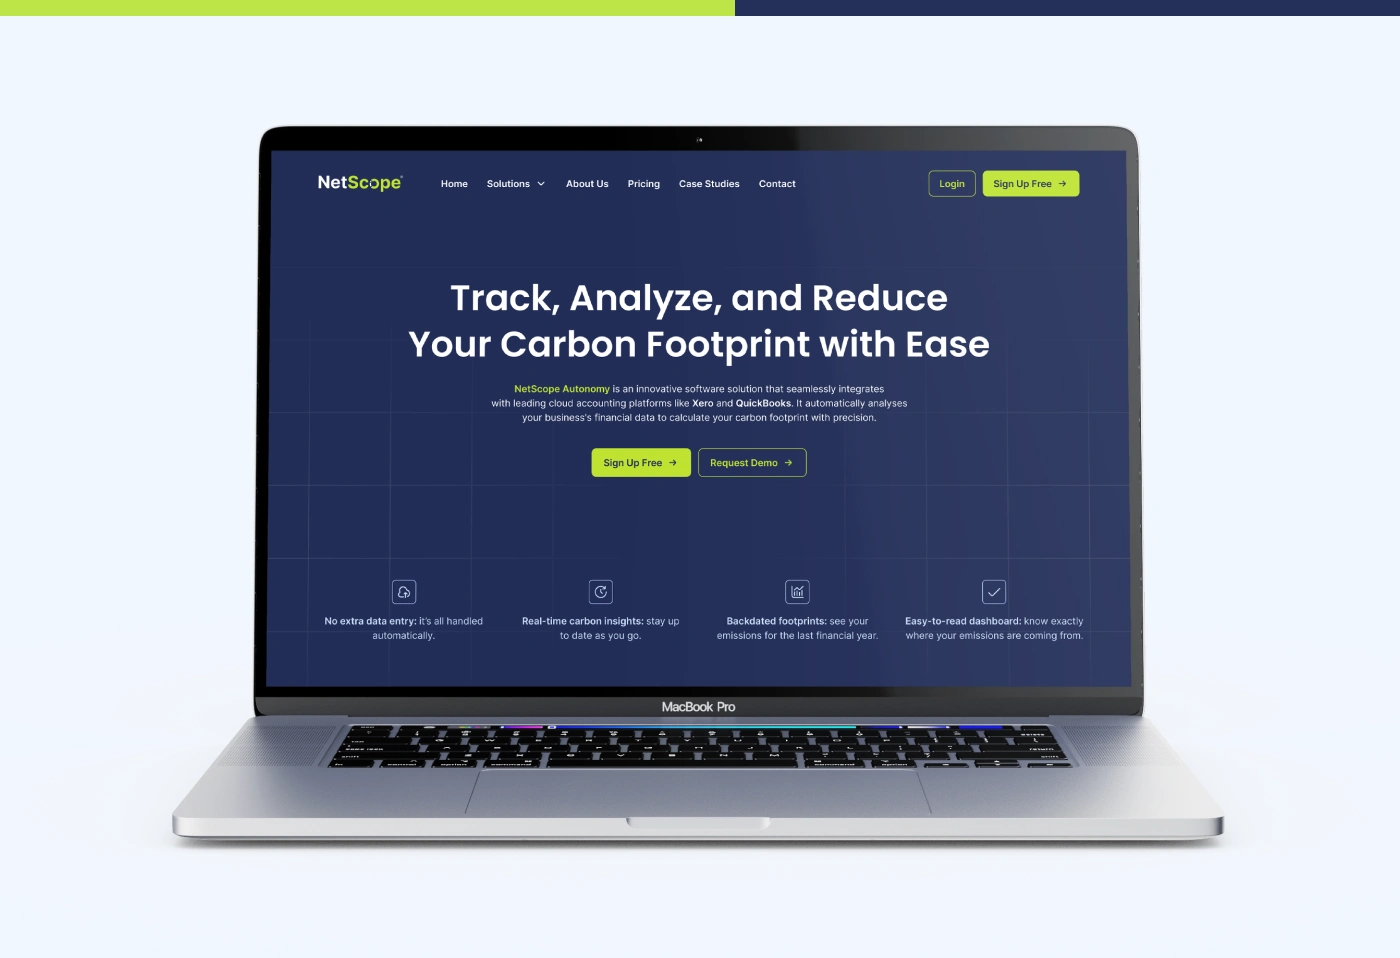
A landing page was designed to explain NetScope’s value proposition and convert visitors into users.
The main message is:
Track, analyze, and reduce your carbon footprint with ease.
The landing page communicates that NetScope can automatically analyze business financial data, provide real-time carbon insights, show backdated footprints, and display emissions clearly in a dashboard.
The landing page was designed to make a complex sustainability product feel accessible and credible.
Company Report Page
A branded company report page was designed to present sustainability results in a polished public-facing format.
The report includes:
Sustainability statement
Company details
Emissions report overview
Total emissions
Current and previous year emissions
Scope breakdowns
Carbon reporting guide
Personal footprint resource
Intensity ratio
Real-time power mix
Carbon offsets
Downloadable certificates
This page allows companies to present their carbon footprint and sustainability progress in a professional, shareable way.
Design System
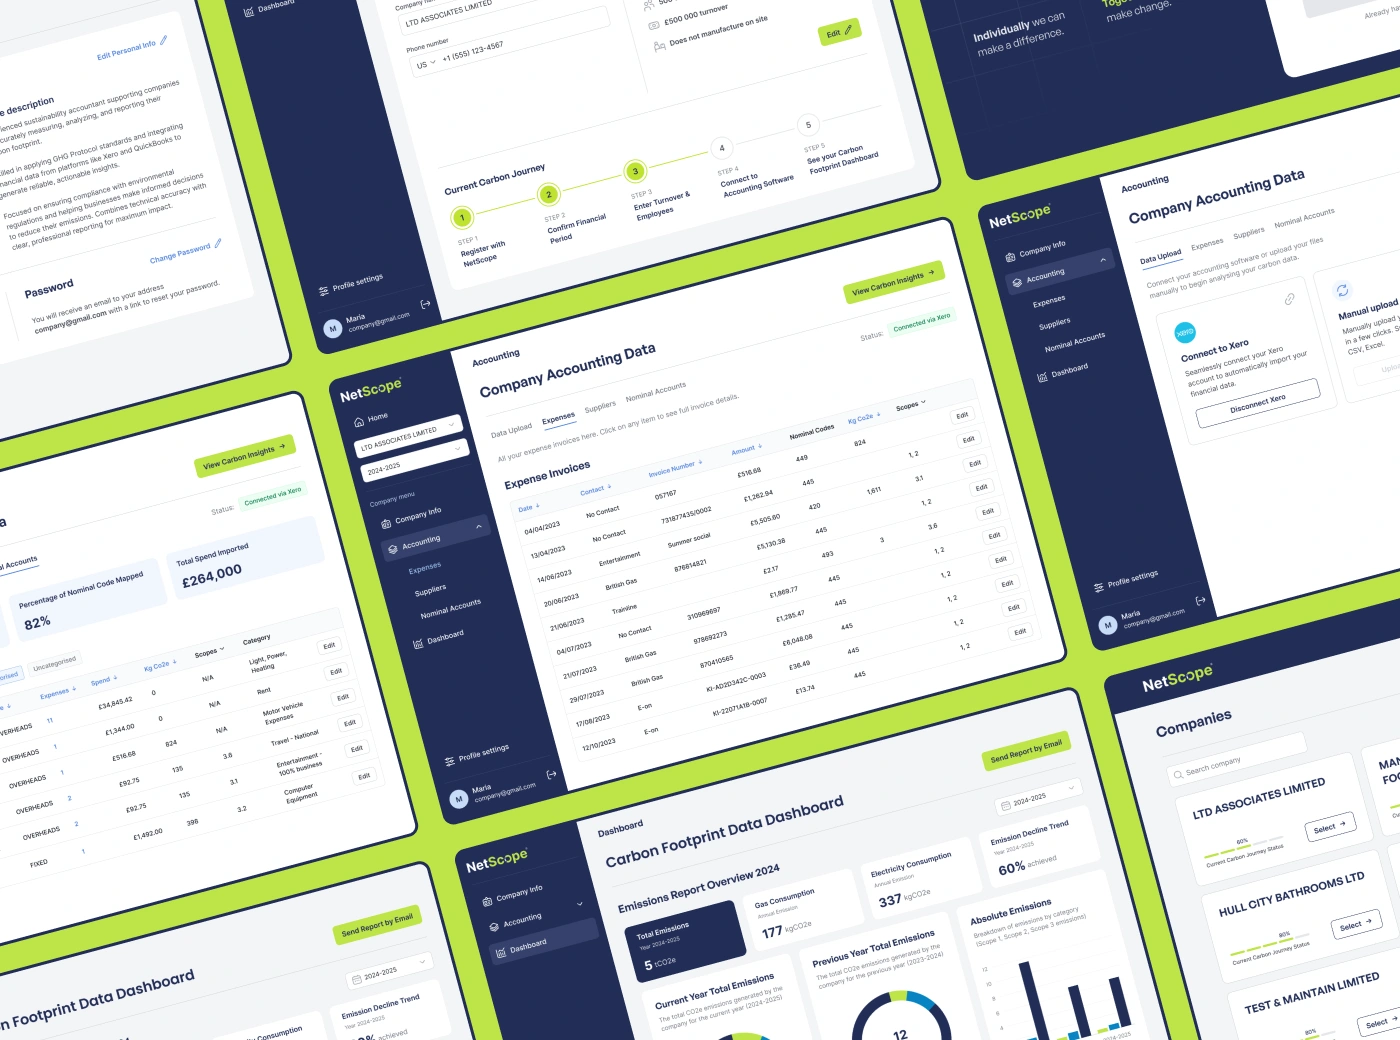
A scalable design system was created to keep the product consistent across the platform, landing page, and report pages.
This foundation makes it easier to expand the platform with new reporting features, integrations, and sustainability tools.
Results
The final design created a complete product experience for carbon reporting and sustainability analytics.
Key Results
A guided carbon reporting journey from onboarding to dashboard insights.
Support for two user roles: individual businesses and third-party agents.
Accounting integration flow for Xero, QuickBooks, and manual data upload.
Clear accounting review screens for expenses, suppliers, nominal accounts, and emissions mapping.
A complete carbon footprint dashboard with emissions metrics, charts, and Scope 3 breakdowns.
A public company report page for presenting sustainability statements and carbon data.
A conversion-focused landing page for explaining the product and supporting sign-ups or demo requests.
A scalable design system built for future product growth.
Project Scope
This case study covers the full first design phase of the NetScope carbon emissions platform, including research, user flow, analysis, wireframes, UI/UX design, company report page, landing page, and design system.
The product was designed as a scalable foundation for future sustainability features, deeper reporting, additional integrations, and advanced emissions analytics.
Conclusion
NetScope turns complex carbon accounting into a clear and structured digital experience.
The design helps companies connect accounting data, review emissions-related financial information, understand their carbon footprint, and present sustainability progress through dashboards and reports.
The final result is a clean, credible, and scalable Climate Tech platform that helps businesses move from carbon data to real climate action.
✍️ Contact me and I will provide you with an estimate for your project!
Like this project
Posted May 1, 2026
UX/UI design for a carbon intelligence platform helping businesses track emissions, analyze accounting data, and generate sustainability reports.
Likes
0
Views
9
Timeline
Oct 2, 2025 - Nov 20, 2025