Wildlife Dashboard
Dikshant Choudhary
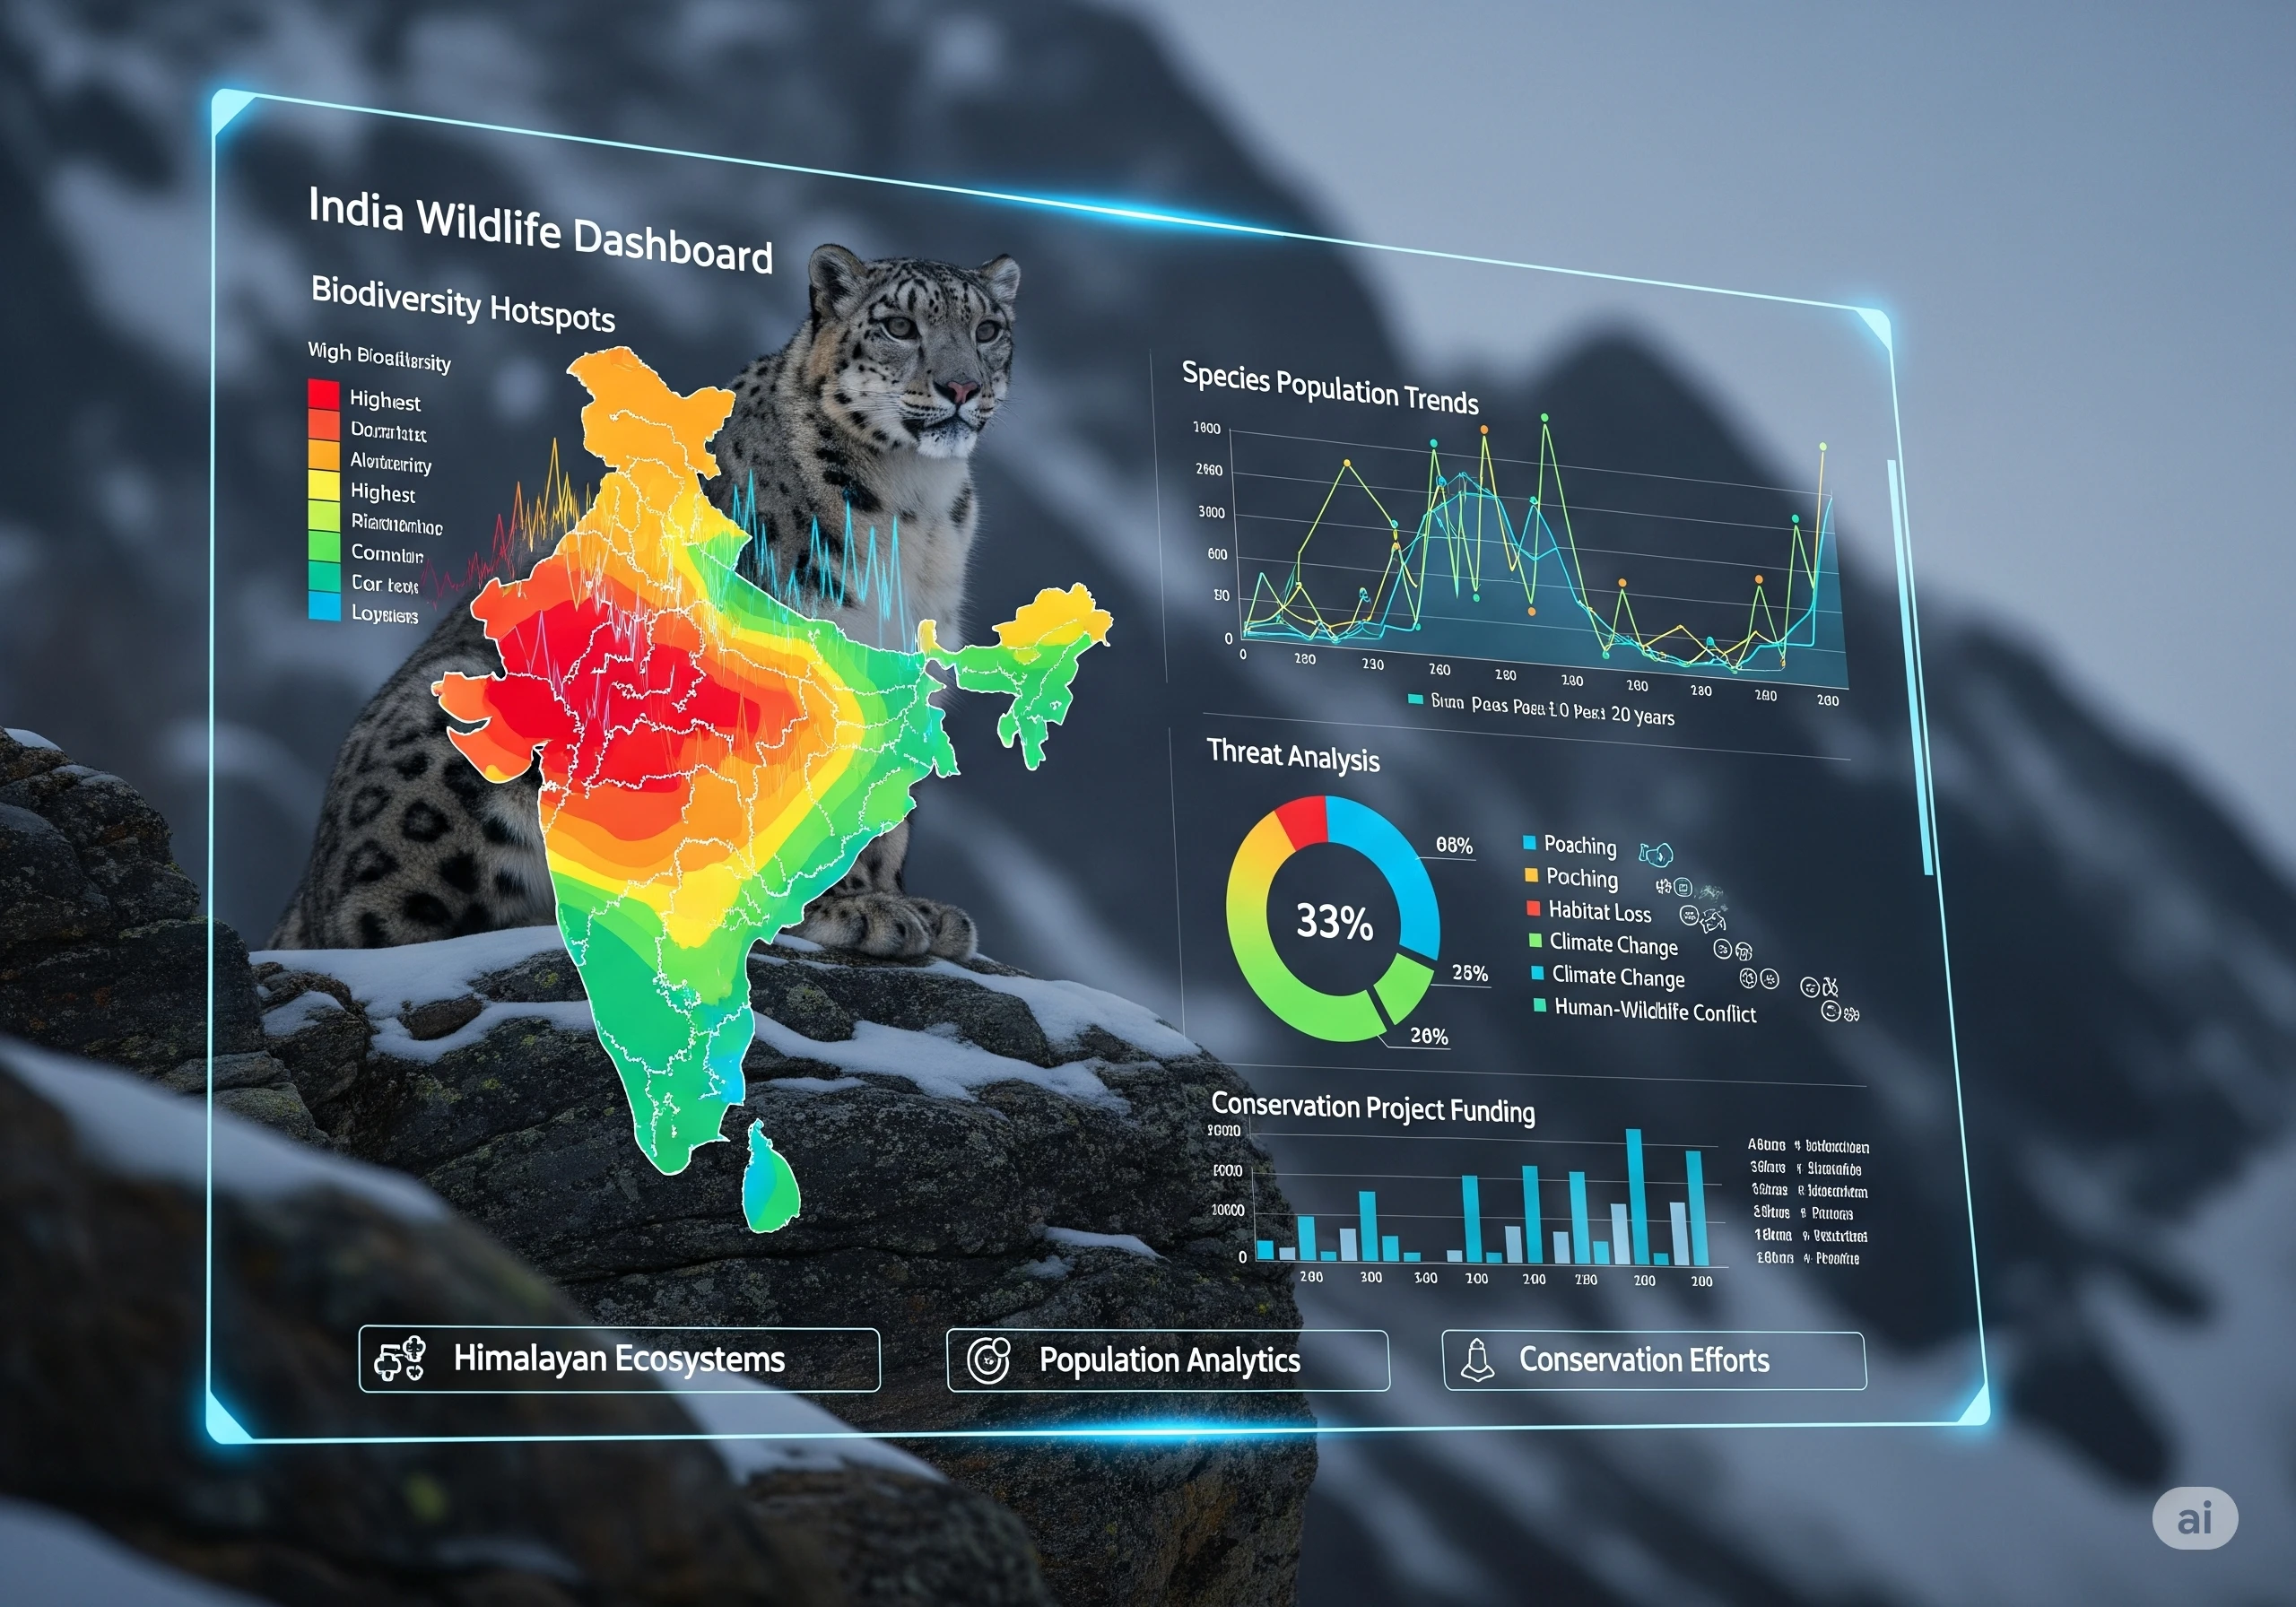
Indian Wildlife Dashboard
The Indian Wildlife Dashboard is a centralized, interactive data visualization platform dedicated to monitoring and preserving India's rich natural heritage. Think of it as a single source of truth that takes complex scientific and field data about wildlife and makes it accessible, understandable, and actionable for everyone from researchers to the general public.
What it does?
The dashboard performs several key functions to turn raw numbers into a clear story:
Aggregates Data: It collects and organizes vast amounts of information from various sources, including government reports, wildlife census data, field surveys from forest officials, and academic research.
Visualizes Trends: It transforms this data into intuitive visual formats like interactive maps, charts, and graphs. This allows users to easily see and analyze species population trends, animal migration routes, and changes over time.
Monitors Habitats: It tracks crucial environmental factors, such as forest cover, deforestation rates, and the health of wildlife corridors, providing a clear picture of the ecosystems that support our wildlife.
Identifies Threats: By mapping data on poaching incidents, human-animal conflict, and habitat encroachment, it helps pinpoint critical hotspots where intervention is needed most.
Its Impact
This is the most important part. The dashboard isn't just about data; it's about driving real-world action and creating positive change. It helps in the following ways:
Empowers Conservationists: For forest officials and on-the-ground conservation agencies, it provides the actionable intelligence needed to make strategic decisions. They can use it to better allocate patrol resources, identify poaching routes, and plan more effective conservation interventions.
Informs Policymakers: It provides clear, data-driven evidence to government bodies and policymakers. This helps in formulating stronger environmental laws, justifying conservation budgets, and designing effective, large-scale protection strategies.
Supports Researchers: It offers a valuable, centralized resource for scientists and students, saving them time in data collection and allowing them to focus on deeper analysis, leading to new insights and discoveries.
Engages the Public: By making the state of India's wildlife accessible and easy to understand, it fosters public awareness, education, and a stronger sense of collective ownership and responsibility for our natural heritage. Ultimately, the Indian Wildlife Dashboard bridges the critical gap between information and action, serving as a powerful tool in the mission to protect and sustain India's incredible biodiversity for generations to come.
Tools used: Microsoft Power BI
Like this project
Posted Jul 25, 2025
This Wildlife Dashboard Project in Power BI is designed to showcase critical wildlife data through clear, interactive visualizations.
Likes
0
Views
5
Timeline
Jul 19, 2025 - Jul 22, 2025