CFO Dashboard Development with Power BI
Adeel Siddiqui
CFO Dashboard - Power BI
Project Overview
This project is a 4-page CFO Dashboard built in Power BI to provide executive-level financial insights and support strategic decision-making.
The dashboard focuses on more than just reporting numbers - it helps identify financial risks, profitability drivers, working capital pressure, budget control issues, and department-level performance.
The goal was to build a decision-support system for finance leadership rather than a basic reporting dashboard.
Key Business Questions Solved
Is the company profitable but facing cash flow pressure?
Which departments are overspending against budget?
How strong is working capital performance?
Are forecasts accurate enough for strategic planning?
Which department contributes most to profitability?
Where should management focus first for cost optimization?
Live Dashboard
Dashboard Pages
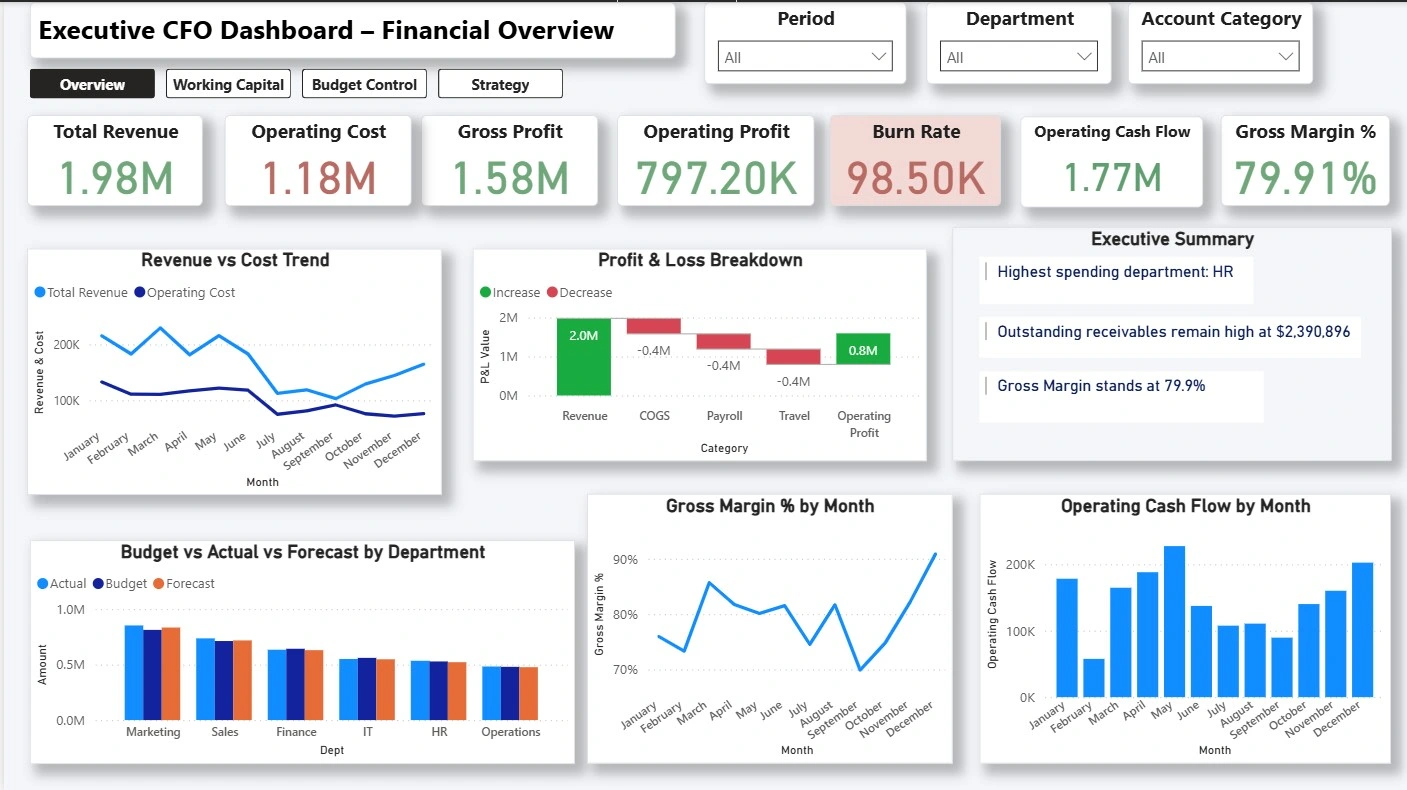
1. Executive Financial Overview
Focus:
Revenue vs Cost
Gross Profit
Operating Profit
Gross Margin %
Operating Cash Flow
Burn Rate
Profit & Loss Breakdown
Department-level budget comparison
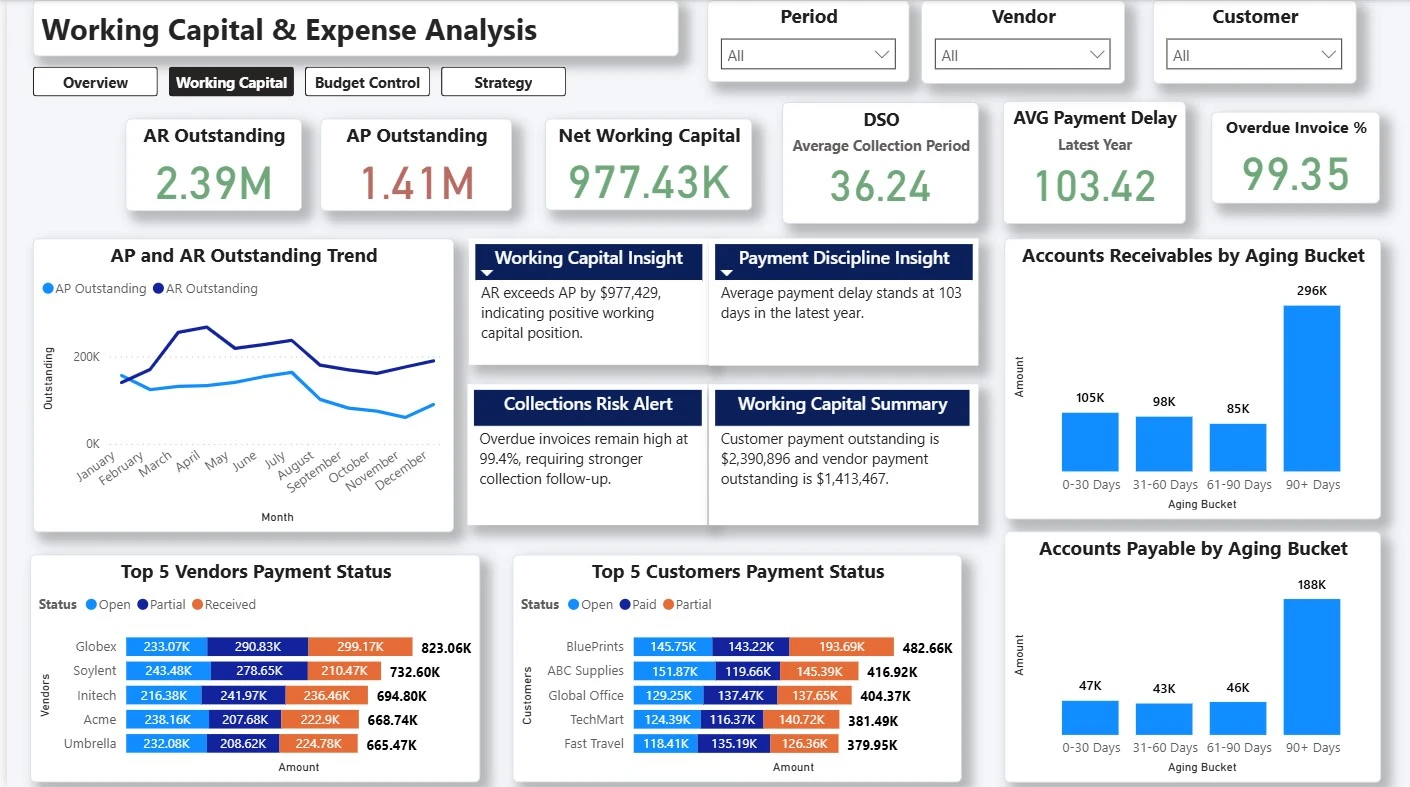
2. Working Capital & Expense Analysis
Focus:
AR Outstanding
AP Outstanding
Net Working Capital
DSO (Collection Period)
Payment Delay Analysis
Aging Bucket Analysis
Customer and Vendor payment behavior
Collections risk identification
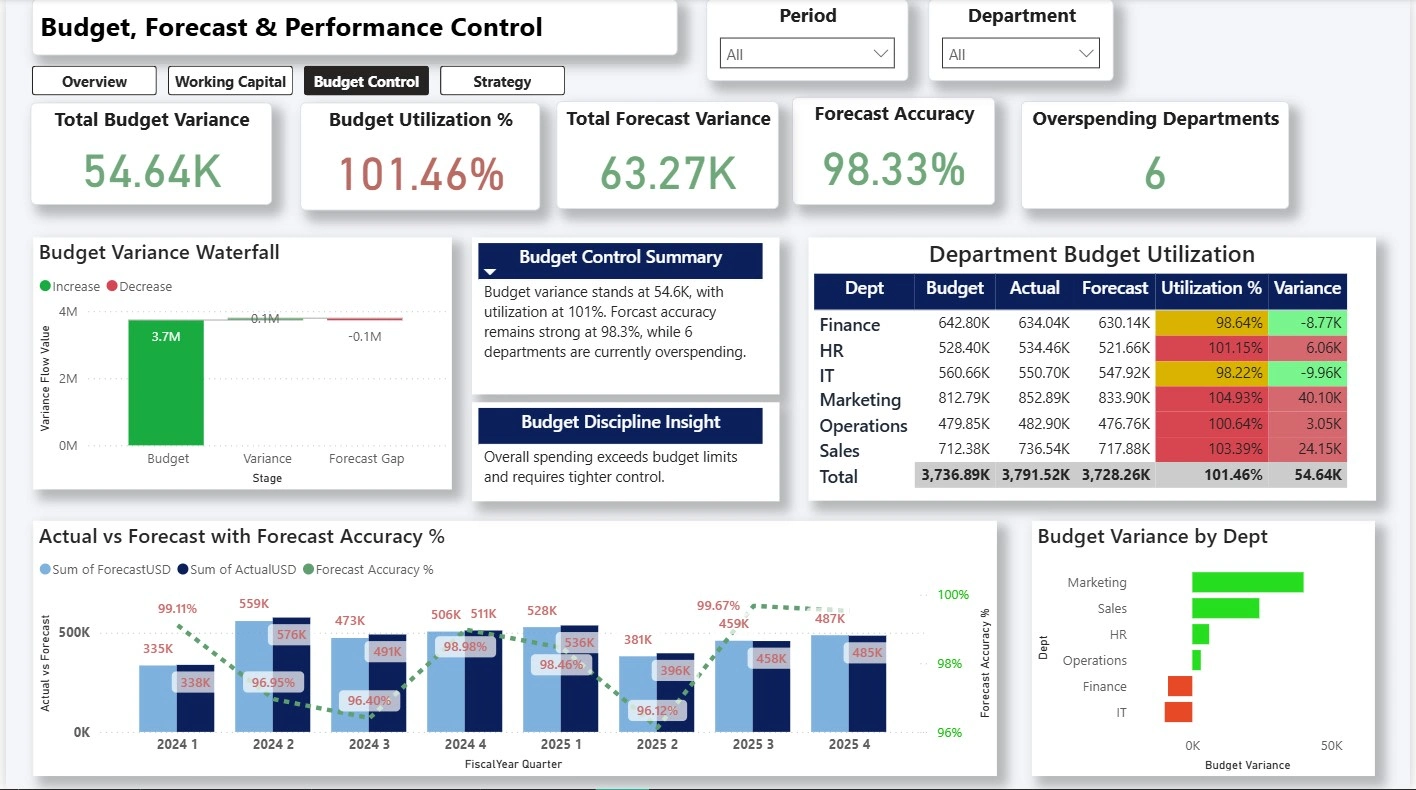
3. Budget, Forecast & Performance Control
Focus:
Budget Variance
Forecast Variance
Budget Utilization %
Forecast Accuracy %
Overspending Departments
Variance Waterfall Analysis
Department-level budget control
Forecast reliability monitoring
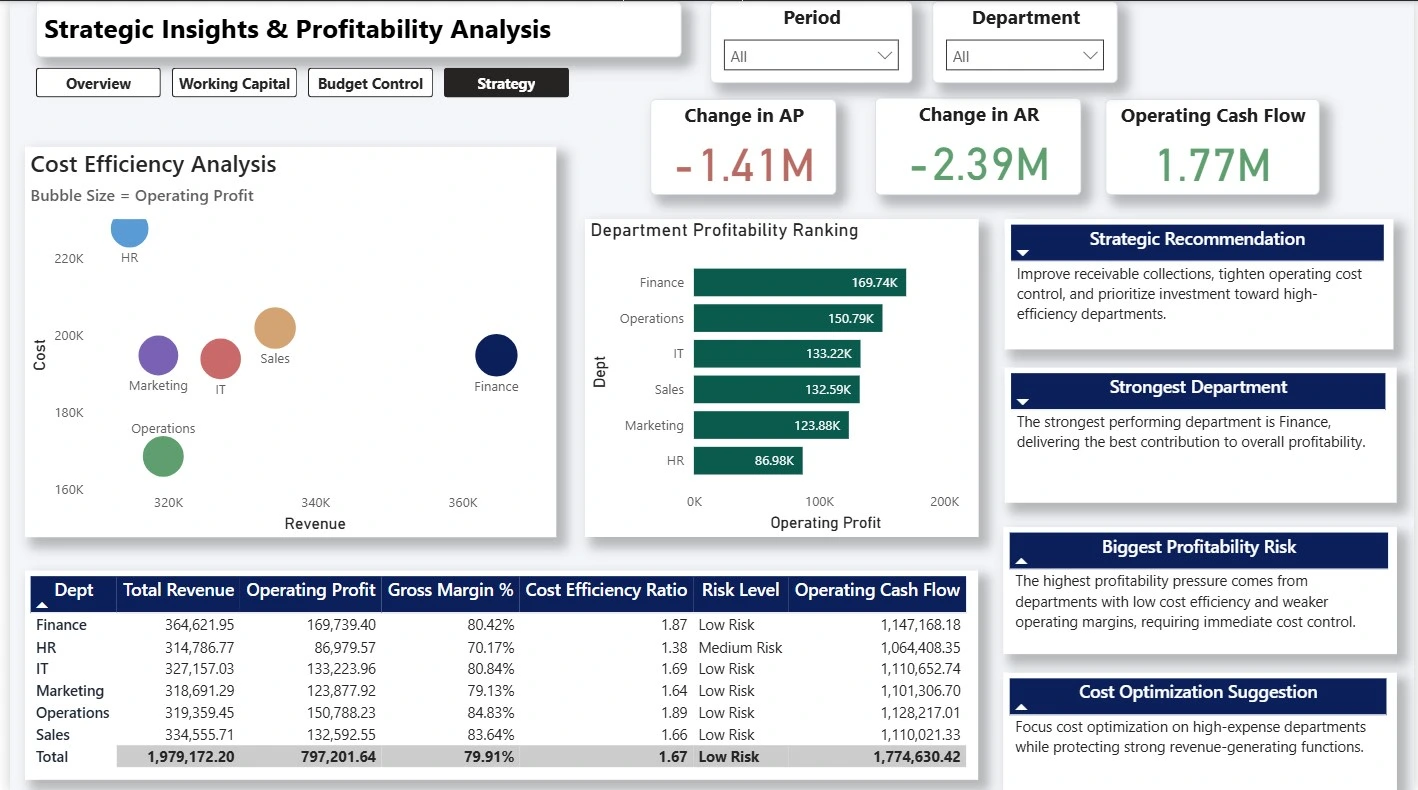
4. Strategic Insights & Profitability Analysis
Focus:
Cost Efficiency Analysis
Operating Cash Flow
Department Profitability Ranking
Strategic Risk Matrix
Risk Level Identification
Executive Recommendations
Profitability optimization strategy
Tools Used
Power BI
DAX
Power Query
Excel (source datasets)
Dataset Used
Source: Finance & Accounting Practice Datasets (total 5)
Dataset Link: https://excelx.com/practice-data/finance-accounting/
Main files used:
General Ledger
Accounts Receivable
Accounts Payable
Budget Forecast
Expense Claims
The dataset was used to simulate a real-world CFO reporting environment covering profitability analysis, working capital management, budget control, forecasting, and strategic financial decision-making.
Key DAX Measures
Some major measures used:
Total Revenue
Operating Cost
COGS
Gross Profit
Operating Profit
Gross Margin %
Burn Rate
Operating Cash Flow
AR Outstanding
AP Outstanding
Budget Variance
Forecast Variance
Forecast Accuracy %
Cost Efficiency Ratio
Strategic Risk Level
Key Findings
Strong profitability existed alongside working capital pressure
AR Outstanding was significantly high
Overdue invoices were dominating receivables
Multiple departments were overspending budget limits
Marketing showed the highest budget variance
Finance was the strongest profitability contributor
Collections discipline needed more attention than revenue growth
Main conclusion:
The problem was not revenue. The problem was cash discipline.
Author
Adeel Siddiqui
Focused on Finance Analytics, Power BI, SQL, Data Analytics, and decision-driven dashboard development.
Like this project
Posted Apr 28, 2026
Built a CFO Dashboard in Power BI for financial insights and decision support.