Retail Sales Analytics Dashboard with Power BI
Adeel Siddiqui
Retail Sales Analytics Dashboard | Power BI
A 3-page interactive Power BI dashboard designed to analyze retail sales performance, customer behavior, and strategic business recommendations.
Dashboard Pages
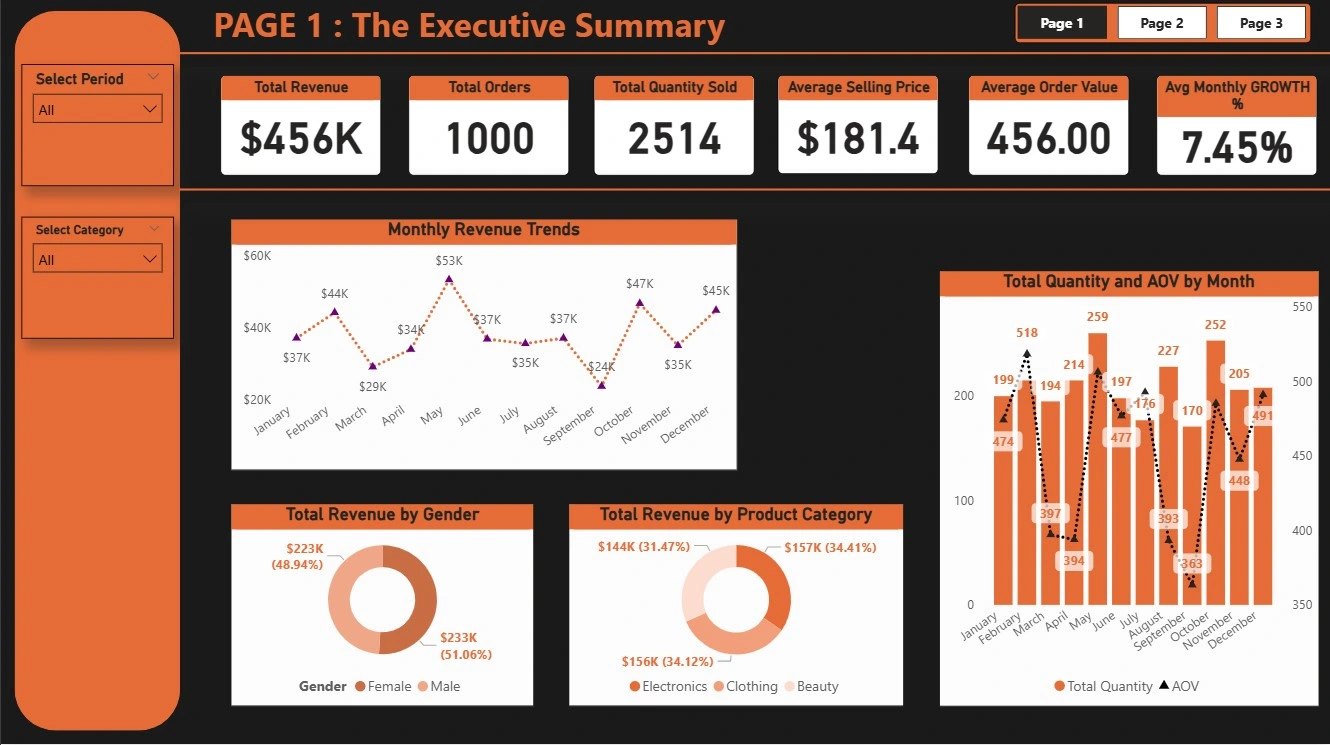
Page 1: Executive Summary
Total Revenue, Orders, Quantity Sold
Average Selling Price (ASP)
Average Order Value (AOV)
Avg Monthly Growth %
Monthly Revenue Trends
Revenue by Gender and Product Category
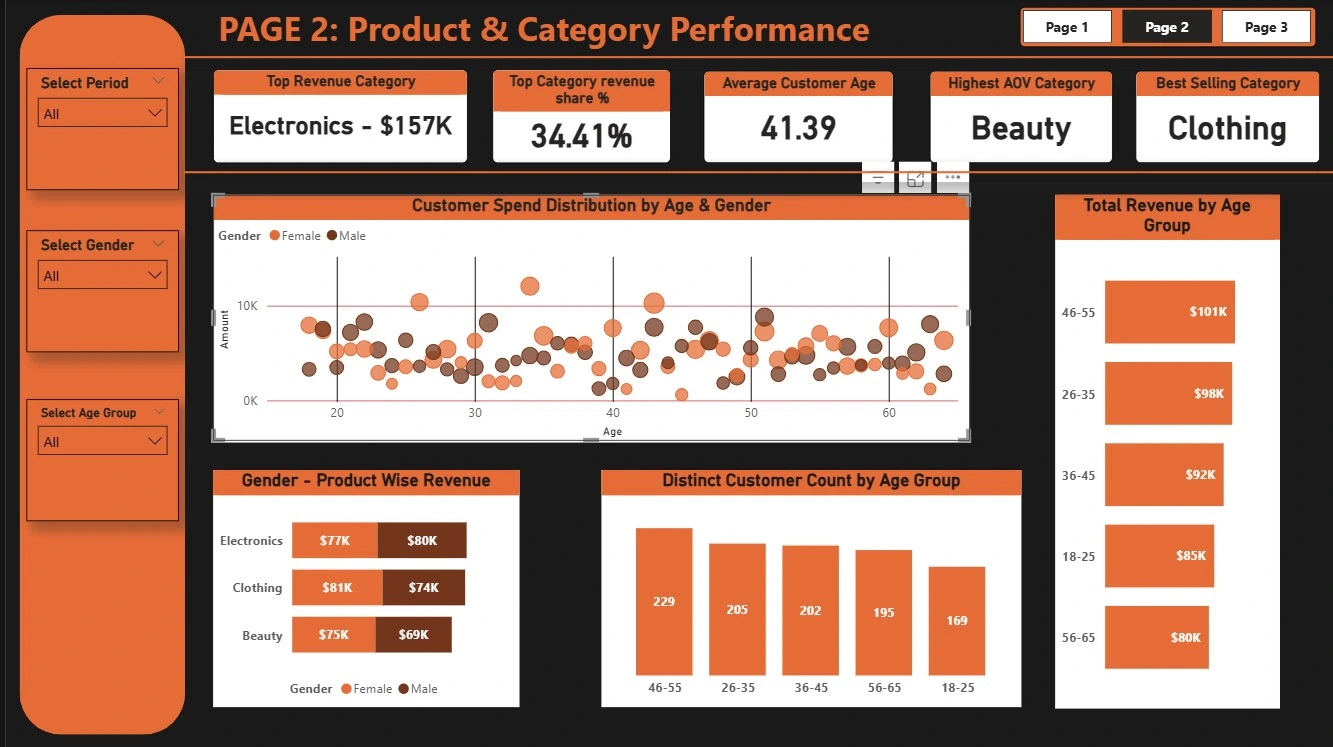
Page 2: Product & Customer Performance
Top Revenue Category
Highest AOV Category
Best Selling Category
Revenue Share %
Customer Spend Distribution by Age & Gender
Revenue by Age Group
Product-wise Revenue by Gender
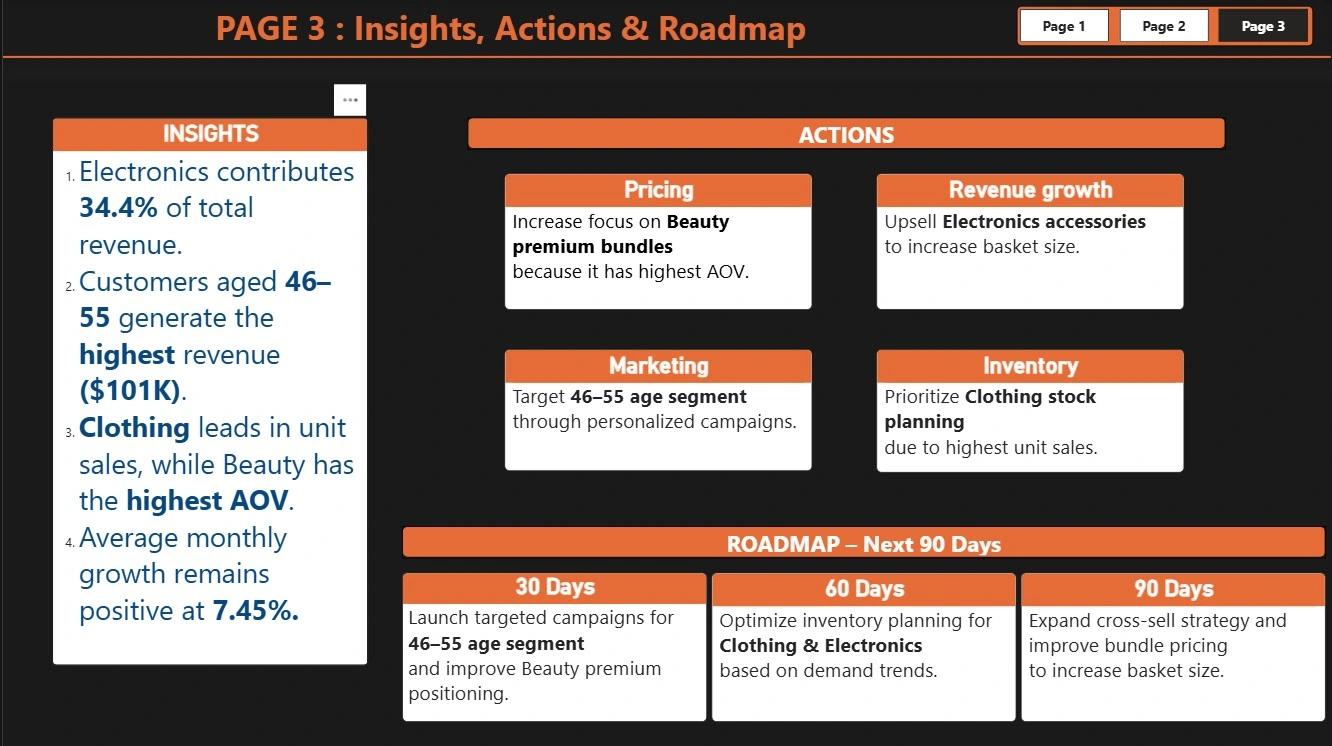
Page 3: Insights, Actions & Roadmap
Key Business Insights
Strategic Recommendations
30-60-90 Day Business Roadmap
Tools Used
Power BI
DAX
Data Modeling
Business Intelligence
Dashboard Design
Key Insights
Electronics contributed 34.4% of total revenue
Customers aged 46–55 generated the highest revenue
Clothing led in unit sales
Beauty had the highest AOV
Average monthly growth remained positive at 7.45%
Dataset
Retail Sales Dataset (Kaggle)
Author
Adeel Siddique
Like this project
Posted Apr 28, 2026
Developed an interactive Power BI dashboard for retail sales analysis and business strategy.
Likes
0
Views
2